<?xml version="1.0" encoding="utf-8"?>
<feed xmlns="http://www.w3.org/2005/Atom">
    <id>https://motherduck.com</id>
    <title>MotherDuck Blog posts | RSS Feed</title>
    <updated>2026-10-30T22:48:06.233Z</updated>
    <generator>Next.js using Feed for Node.js</generator>
    <link rel="alternate" href="https://motherduck.com"/>
    <link rel="self" href="https://motherduck.com/atom.xml"/>
    <subtitle>Welcome to MotherDuck's blog posts!</subtitle>
    <logo>https://motherduck.com/images/mother-duck-large-logo.png</logo>
    <icon>https://motherduck.com/favicon.ico</icon>
    <rights>MotherDuck is powered by DuckDB</rights>
    <entry>
        <title type="html"><![CDATA[Introducing Dive Apps: Superpowers for AI Builders]]></title>
        <id>https://motherduck.com/blog/dive-apps-superpowers-for-ai-builders</id>
        <link href="https://motherduck.com/blog/dive-apps-superpowers-for-ai-builders"/>
        <updated>2026-10-29T00:00:00.000Z</updated>
        <summary type="html"><![CDATA[MotherDuck is launching Dive Apps: fully custom data apps that can write-back anywhere. Build them with your agent and they run on the MotherDuck data warehouse. Use Dive Apps to replace SaaS apps, automate your operations, or bring humans into the loop to steer your agents.]]></summary>
        <content type="html"><![CDATA[
<p>A dashboard is just a fancy report if you can’t take action on it.</p>
<p>Today we are launching Dive Apps: fully custom data apps that can write-back anywhere. <a href="https://motherduck.com/docs/key-tasks/dives/run-flights-from-dives/">Build them with your agent</a> and they run on the MotherDuck data warehouse. Use Dive Apps to replace SaaS apps, automate your operations, or bring humans into the loop to steer your agents. They are the best way to use AI to build your business.</p>
<p>Don’t build dashboards - build apps! You have the power of AI behind you. Anything that used to be a report should be an app instead, and can be just as easily. Connect your agent to our <a href="https://motherduck.com/docs/key-tasks/ai-and-motherduck/mcp-workflows/mcp-setup/">MCP server</a> and an app for your whole team is just one prompt away.</p>
<p>Dive apps work by letting your Dive visualizations trigger Flights, our serverless Python runtime. While you can certainly update data inside MotherDuck, the flexibility of Flights means you can <a href="https://motherduck.com/docs/cookbook/flight-hubspot-list-sync/">write data back into source systems</a> as well. Or <a href="https://motherduck.com/docs/cookbook/flight-dive-export/">send emails</a>. Or <a href="https://motherduck.com/docs/cookbook/flight-freshness-alert/">post in Slack</a>. One of my favorites is that you can <a href="https://motherduck.com/dive-gallery/dives/machine-learning-interpretability-dashboard">rerun machine learning models</a> (remember when data science was the sexiest job of the 21st century?). For even more power, you can <a href="https://motherduck.com/docs/cookbook/flight-analysis-agent/">kick off a full-featured agent harness</a> to act on your behalf.</p>
<p><img src="https://motherduck-com-web-prod.s3.us-east-1.amazonaws.com/assets/img/dive_app_ad_budget_fast_403d6efb17.svg" alt="Dive App Example Diagram"></p>
<h2>What can you build?</h2>
<p>Dive Apps are designed for flexibility, so there are many ways to use them. Now that custom software is so inexpensive, there are more and more places we will see ROI from building an app. If it takes an hour to speed up something your team does once a week, you see benefits immediately. These are just examples to get your creativity flowing - imagine what you will build!</p>
<h3>Replace SaaS Apps</h3>
<p>Completely duplicating the capabilities of a SaaS app sounds daunting, but I’m confident you aren’t using every feature of every SaaS app. Agents can replicate just the features that you rely on and customize for your business.</p>
<p>Still paying for project management software? Build an interface that matches your company’s exact workflow. Using a SaaS to stitch together multiple marketing and ads systems? Your agent can load that into MotherDuck and you can build a decision support system for your team. Not only can you make the right decision, but you can push that decision into the upstream systems.</p>
<p>AheadComputing is a semiconductor design company <a href="https://motherduck.com/case-studies/ahead-computing-agent-first-data-platform/">building on top of MotherDuck</a> and is slashing SaaS app costs. Ben Holtzman, staff design enablement engineer, phrased it this way:</p>
<blockquote>
<p>"A single license for a power analytics tool for six months could be $50,000. There are basically only three companies that create this vendor tooling. You're operating in a space with a virtual monopoly."</p>
</blockquote>
<p>Instead of more licenses, they designed an even more feature rich interface on top of MotherDuck.</p>
<h3>Automate Your Operations</h3>
<p>Augment your domain experts with Dive Apps that bring together everything they need to make a decision. Then, put that decision into practice right in the app.</p>
<p>Imagine how much faster issues could be resolved if customer support specialists had a custom command center app at their disposal. It could retrieve the full context of how a user is interacting with the product, their contract details, and any similar conversations. Within the app they can send messages directly to the customer. But this is more than a vanilla chat window, this app is a command center after all! It has relevant docs automatically surfaced and best practice snippets ready to embed. As a result, your team moves faster and customers are happier!</p>
<p>How do you handle RevOps today for your sales team? A custom app could build forecasts based on your business’s exact subscription structure and predict based on actual usage statistics in the product.</p>
<p>Instead of just looking at inventory levels, you could actually send out a purchase order when stock gets low. You could game out what-if scenarios to see if same day shipping is worth it or if “priority shipping” is reliable enough to keep your production line up. These kinds of decisions need data from all kinds of source systems.</p>
<h3>Steer Your Agents</h3>
<p><img src="https://motherduck-com-web-prod.s3.us-east-1.amazonaws.com/assets/img/dive_app_discount_approval_03450c1ed5.svg" alt="dive-app-discount-approval.svg"></p>
<p>Over time, agents will take on a larger fraction of the decisions in our businesses. However, if you’ve ever automated a complex business process, you know you don’t just flip a switch and call it a day.</p>
<p>The fastest way to implement automation is to make changes incrementally: first advise, then require approval, then only escalate exceptional cases, then go fully autonomous. Having an app keeps a human in the loop for as long as it is valuable. Customizing that app keeps the time-spent-per-case as low as possible and surfaces all the background someone needs to make a wise choice. Each time the domain expert correctly overrides the agent gets saved to improve the agent for next time. Eventually quality reaches 99.9% and you switch out the lights on that process and let the robots handle it.</p>
<p>That implementation process requires an app that gives the human the ability to write back to source systems and to document where the agent fell short. Without write-back, operators won’t be able to trust the automation or fix things when something unforeseeable occurs.</p>
<h2>Build on the Best Infrastructure</h2>
<p>There is plenty of noise about where you should build with AI. Why build on MotherDuck? Fundamentally, it’s because it’s incredibly simple to use, brings all the capabilities of a data warehouse, but skips the drawbacks of a legacy platform.</p>
<h3>The Easiest Way to Centralize All Your Data</h3>
<p>Your most important decisions need data and context from multiple source systems. If a problem could be solved with data that is already in one place, you’ve solved that problem already. MotherDuck Flights are the easiest way to pull data from anywhere into an efficient, central location. Your agent has the full power of Python available (with all its open source ETL libraries) to pull from thousands of sources in just a couple of prompts.</p>
<h3>A Fast Query Engine That Spins Up Instantly</h3>
<p>Once your data is centralized, you need a high performance analytical engine to make sense of it. Time is valuable, and whether it’s your operational team or executive team, they need answers quickly. Latency is critical in any app. Joining tables together or extracting meaning out of a deluge of log data are compute intensive, and analytical engines are the right tool for the job.</p>
<p>But you don’t want it to be a huge, always on, monolithic cluster. Likewise, you can’t wait minutes for things to initialize. Especially for data app interactions that can be variable, you want your compute to spin up just as you need it and spin down when you are done.</p>
<p>With MotherDuck, you can handle the scale you need without the multi-second queries and high cost baggage of a decade-old legacy warehouse architecture. In short, you need warehouse horsepower, but with the latency profile of an app DB not a batch job system. On MotherDuck, each user can have their own compute resources too, so nobody waits in line.</p>
<h3>Flexibility is Key, Governance is Non-Negotiable</h3>
<p>If an app-building platform locks you into cookie cutter widgets, no AI will help you build exactly what you want. Conversely, if there are no guardrails, then you can’t deploy with confidence. MotherDuck includes Single-Sign-On (<a href="https://motherduck.com/docs/key-tasks/authenticating-and-connecting-to-motherduck/authenticating-to-motherduck/sso-setup/">SSO</a>), Role-Based Access Control (<a href="https://motherduck.com/docs/concepts/roles-and-access-control/">RBAC</a>), and now Table, Row, or Column Level Security (<a href="https://motherduck.com/docs/key-tasks/sharing-data/table-level-security/">TLS</a>, <a href="https://motherduck.com/docs/key-tasks/sharing-data/secure-views/">RLS</a>, or <a href="https://motherduck.com/docs/key-tasks/sharing-data/secure-views/">CLS</a>). That lets you share your apps with exactly who you need to and lock them down as appropriate. Data in MotherDuck is private by default, so you can opt in when it is time to share with other users.</p>
<p>As an integrated part of MotherDuck, you can manage your data and Dive Apps access all in the same spot. No separate dashboard permissioning system!</p>
<h3>Store Your Context For the Long Term</h3>
<p><img src="https://motherduck-com-web-prod.s3.us-east-1.amazonaws.com/assets/img/guides_one_definition_of_revenue_35c520f53e.png" alt="Illustration of a Guides file tree with an org-shared Revenue folder and a private My workflow folder"></p>
<p>If you want your agent to be able to build an app that fits your business rules, you need context. In <a href="https://motherduck.com/product/guides/">MotherDuck Guides</a> you can teach your agent about the structure of your data and curate best practices. That way, your agents understand your company’s data and provide more accurate answers.</p>
<p>Why Guides? Don’t bet on just one AI lab and put all your context in their proprietary system! What happens when the other company drops a new model that laps the rest? You want to be able to switch to the best in class LLM at a moment’s notice.</p>
<p>You already need a place to store your data, so store your metadata right alongside it. Data stores last forever, but the leader in the AI race changes every week…</p>
<h3>Apps That Take Action in Any System</h3>
<p>An app is really just a report if it doesn’t actually trigger changes in your business. If your business runs right on top of MotherDuck, write straight back to a MotherDuck database. Or if you want to take action in a source system, Flights can push data anywhere and trigger any actions needed. Your data doesn’t get stuck in any database, it can flow wherever is needed.</p>
<p>Actions can range from something as simple as a Slack alert to actually executing a discount on a customer’s bill. Those financial decisions are cases where the augmentation approach that keeps a human in the loop can be most effective. After the agent gets 50 right in a row, then you can move to auto-pilot with a scheduled Flight!</p>
<h2>Conclusion</h2>
<p>If you’re running your business just with an agent on every laptop, you’re still in the spreadsheet era of AI. Sure, you’re emailing around artifacts instead of xls files, but you’re not getting the gains that the AI labs promised.</p>
<p>To get the most out of AI, you want to automate entire process flows. To do that accurately, you need the right data and the right context. You need the right guardrails in place to set your organization free to innovate. <a href="https://motherduck.com/docs/key-tasks/dives/run-flights-from-dives/">Dive Apps</a> let you move your business faster because they tie in directly with the full power of MotherDuck.</p>
<p>We can’t wait to see what you build! Quack on!</p>
]]></content>
        <author>
            <name>Alex Monahan</name>
        </author>
    </entry>
    <entry>
        <title type="html"><![CDATA[Bringing the Big Ducks]]></title>
        <id>https://motherduck.com/blog/bigger-ducks</id>
        <link href="https://motherduck.com/blog/bigger-ducks"/>
        <updated>2026-10-28T00:00:00.000Z</updated>
        <summary type="html"><![CDATA[The pursuit of all things duck-related has led us to some interesting places. In this blog, MotherDuck CEO Jordan Tigani explores the bigger, darker corners of benchmarks on top DuckDB 1.5 (and teases what is possible in DuckDB 2.0).]]></summary>
        <content type="html"><![CDATA[
<p>“Would you rather fight a horse-sized duck or 100 duck-sized horses?” That’s the interview question we give to every job applicant at MotherDuck. The correct answer, of course, is that anyone who would pick a fight with a giant duck gets removed from consideration immediately, as obviously unsuited to work at a company called “MotherDuck.” We don’t have anything against horses, but we are rather sensitive towards anyone choosing to harm web-footed waterfowl.</p>
<p>Aside from the absurdity of this question, it is actually a pretty decent metaphor for the technology we’ve built at MotherDuck. Whereas most of the prevailing analytical databases are designed around having a bunch of small instances working in concert, we made the conscious decision to let our ducklings get big rather than to harness more of them at once. A Snowflake 3XL, for example, is basically 64 Snowflake extra-small instances in a trenchcoat; that is, 64 fixed-sized instances that are networked together to collaborate on running queries. A MotherDuck Giga instance, on the other hand, has about the same amount of CPU and RAM as a Snowflake 3XL, but is in a single, very large machine.</p>
<p>One of the points I made in the blog post “<a href="https://motherduck.com/blog/big-data-is-dead/">Big Data is Dead</a>” four years ago was that the line between what is considered “normal” data size and “big” data keeps moving. Above the line for “big” data means you have to use special handling, special compute, special storage to be able to use it effectively. “Normal” data is the size that just works, typically what you can process on a single machine. As the threshold for big data moves higher and higher, the number of workloads that need to be handled using “big” compute architectures goes down.</p>
<p>So where, exactly, is the line for Big Data? In the early days of MotherDuck, we used to describe it as  “about a terabyte.” However, since then, machines with hundreds of cores and terabytes of RAM have become pretty standard. Moreover, people have gotten better at writing code for high core counts, which means you continue to get better performance as the number of CPUs in a machine increases. These days, I’d draw the line at least 10x higher, as workloads that are 10s of terabytes are now pretty straightforward to handle on a single machine.</p>
<p>Even now, database people tend to scoff at the idea of a single node architecture. <em>That can’t possibly scale!</em> So I’d like to offer an existence proof. Let’s see how MotherDuck scales to workloads of 10s of terabytes. And let's see how it lines up against more conventional data warehouses with distributed architectures.</p>
<p><strong>Giga Duckling vs the World</strong></p>
<p>Our largest instance at MotherDuck is called a “Giga.” We don’t usually share the precise hardware specifications, but it uses the better part of an instance with 192 cores and 1.5 TB of RAM. I wanted to see how this instance stacks up against other data warehouses as we start to toe the line into big data territory. Just how big can you go before the single node architecture starts to be a liability?</p>
<p>It is dangerous to write blog posts about performance because people tend to accuse you of cheating; either you optimize your system behind the curtain to make it look better or you fail to optimize the competitor’s system to make it look worse. What makes things even more complicated is that many vendors have “no benchmark” clauses in their terms of service that threaten to do nasty things to you if you publish benchmarks.</p>
<p>My solution to this is that I’m only referring to numbers that other people have published. Then I don’t have to worry about violating their terms of service. The downside is that some of them are a little bit old; that would be a deal-breaker if I was trying to say one service was faster than another. But I’m really just trying to show that MotherDuck can keep up.</p>
<p>The other thing that can be somewhat sketchy is when vendors report their own numbers. That’s why a lot of people get third parties to do their benchmarking. But that tends to take a lot of time to do, and I’m taking a slightly different approach; I’m just asking Claude to run the benchmarks, with no special instructions. I also inspect the output to make sure it doesn’t do something weird.</p>
<p>I picked the <a href="https://www.tpc.org/tpcds/">TPC-DS</a> benchmark because it is the hardest data warehouse benchmark and one that scales to large sizes. It has 99 different queries, with some fiendishly difficult joins. You can generate the benchmark data to run at any scale. A scale factor of 1 corresponds to about 1 GB of data stored and scans about 17 GB of data during the course of the benchmark.</p>
<p>To score the benchmark results, we report the geometric mean of the query times. This is in keeping with the other results that were reported, so we can compare apples to apples. It is also generally considered best practice to use geomean when running database benchmarks because some of the queries have very different complexities and expected runtimes. If you used the total duration or the average (arithmetic mean) duration to compare timings, the results would be dominated by a handful of the longer running queries and the short ones would barely count.</p>
<p><strong>The first terabyte</strong></p>
<p>To start out with, I looked at the TPC-DS 1 TB size (scale factor 1,000). MotherDuck ran this benchmark with a geomean of 690 milliseconds.  How does that stack up against other “big data” warehouses? Well, I found a <a href="https://www.fivetran.com/blog/warehouse-benchmark">blog</a> post from Fivetran in 2022 that has Redshift at 4.2 seconds, Snowflake 2XL at 4.9 seconds, Databricks 2X at 6 seconds, and BigQuery at 6.1 seconds (data <a href="https://docs.google.com/spreadsheets/d/11LeHSy_epGUpypJ9AJFY8LNWSodVCfHQF-CBRoo4Br0/edit?gid=665108003#gid=665108003">here</a>). This is a few years old, and all of those other systems have likely gotten a lot faster since then, but even so, it doesn’t look like MotherDuck struggles at this data size.</p>
<p><img src="https://motherduck-com-web-prod.s3.us-east-1.amazonaws.com/assets/img/image1_4f9dc71bb7.png" alt="image1.png"></p>
<p>We also ran this benchmark using the smaller MotherDuck Mega instance, which clocked in at 2 seconds, which is still faster than the competitive systems. So you don’t need the biggest duck in the pond to handle the 1 terabyte data size.</p>
<p><strong>Tiny Terabytes</strong></p>
<p>There are times when one terabyte just won’t do. What about ten? Surely the single node DuckDB architecture starts to founder at that point, no? Why don’t we try TPC-DS at scale factor 10,000? This is about 10 Terabytes on disk, and scans 168 Terabytes in the 99 queries of the benchmark. To put this in context, running this benchmark on BigQuery with their default pricing model costs more than $1,000.</p>
<p>The MotherDuck result is now 5.6 seconds geomean. To compare with other data warehouses, I found a <a href="https://www.oracle.com/mysql/performance-benchmarks/">blog post</a> from Oracle, also in 2022, that benchmarked Redshift, Snowflake, BigQuery, and Azure Synapse, with instance sizes that are all price-wise just a little bit more expensive than the MotherDuck Giga. The results are pretty close together, with Redshift the fastest of the non-MotherDuck lot at 8 seconds flat.</p>
<p><img src="https://motherduck-com-web-prod.s3.us-east-1.amazonaws.com/assets/img/image2_d58ba625ff.png" alt="image2.png"></p>
<p>To be clear, the goal here really isn’t to claim that MotherDuck is faster than any other engine. I’m just saying that at scales that many people consider to be “pretty big,” MotherDuck, with the single-node architecture, is competitive. It isn’t just for toy data sizes.</p>
<p>On one hand, these results are a few years old, and every engine on the list has almost certainly gotten faster in that time. On the other hand, I’m also running an older version of DuckDB. DuckDB 2.0 came out last week and has some very significant performance improvements, particularly for larger instances. These benchmarks were done against DuckDB version 1.5.6 because we haven’t upgraded to version 2.0 yet in MotherDuck (we’re waiting for the first patch version to come out next month). So I may not be showing other engines in their best light, but I’m also not showing DuckDB in its best light either.</p>
<p><strong>Ducks, Ducks, and More Ducks</strong></p>
<p>These results show that scaling up can work well to handle large workloads that scan 10s of Terabytes of data. That scale includes the vast majority of workloads at the vast majority of organizations, and the results vindicate the decision by the DuckDB team to focus on making a super fast single node engine.</p>
<p>We bet heavily on DuckDB, as not only a robust engine but also one that was going to get better quickly. This has borne out well because DuckDB has continued to improve at a rapid pace; over the last year the performance on these benchmarks has largely doubled, and we expect that the recently released DuckDB 2.0 is likely going to significantly improve performance again for these workloads.</p>
<p>At MotherDuck we’ve also gotten very good at running DuckDB at scale. Our FlashCache storage engine creates a distributed tiered store underneath DuckDB that provides great performance even on cold starts. On this benchmark, MotherDuck scales as well as competitive systems at a similar or larger price point. We’d go further and say that if a workload can be handled on a Snowflake XL, it would be surprising if you couldn’t do it in MotherDuck faster and less expensively; after all, a MotherDuck Giga has a lower price point and has more CPU and RAM with a lower latency architecture.</p>
<p>We have a long-standing bet going with one of our investors about whether we would need to make MotherDuck run in distributed mode. There are still some workloads that do struggle to scale up, and I’d expect we’d want distributed support before long. In the age of AI, adding distributed support gets easier and easier (I know of three ongoing projects to do so). That said, the number of workloads that need distributed mode is pretty small, and gets smaller over time as machines get bigger. In the meantime, make way for giant ducklings!</p>
<p><strong>Appendix: A note on the Methodology</strong></p>
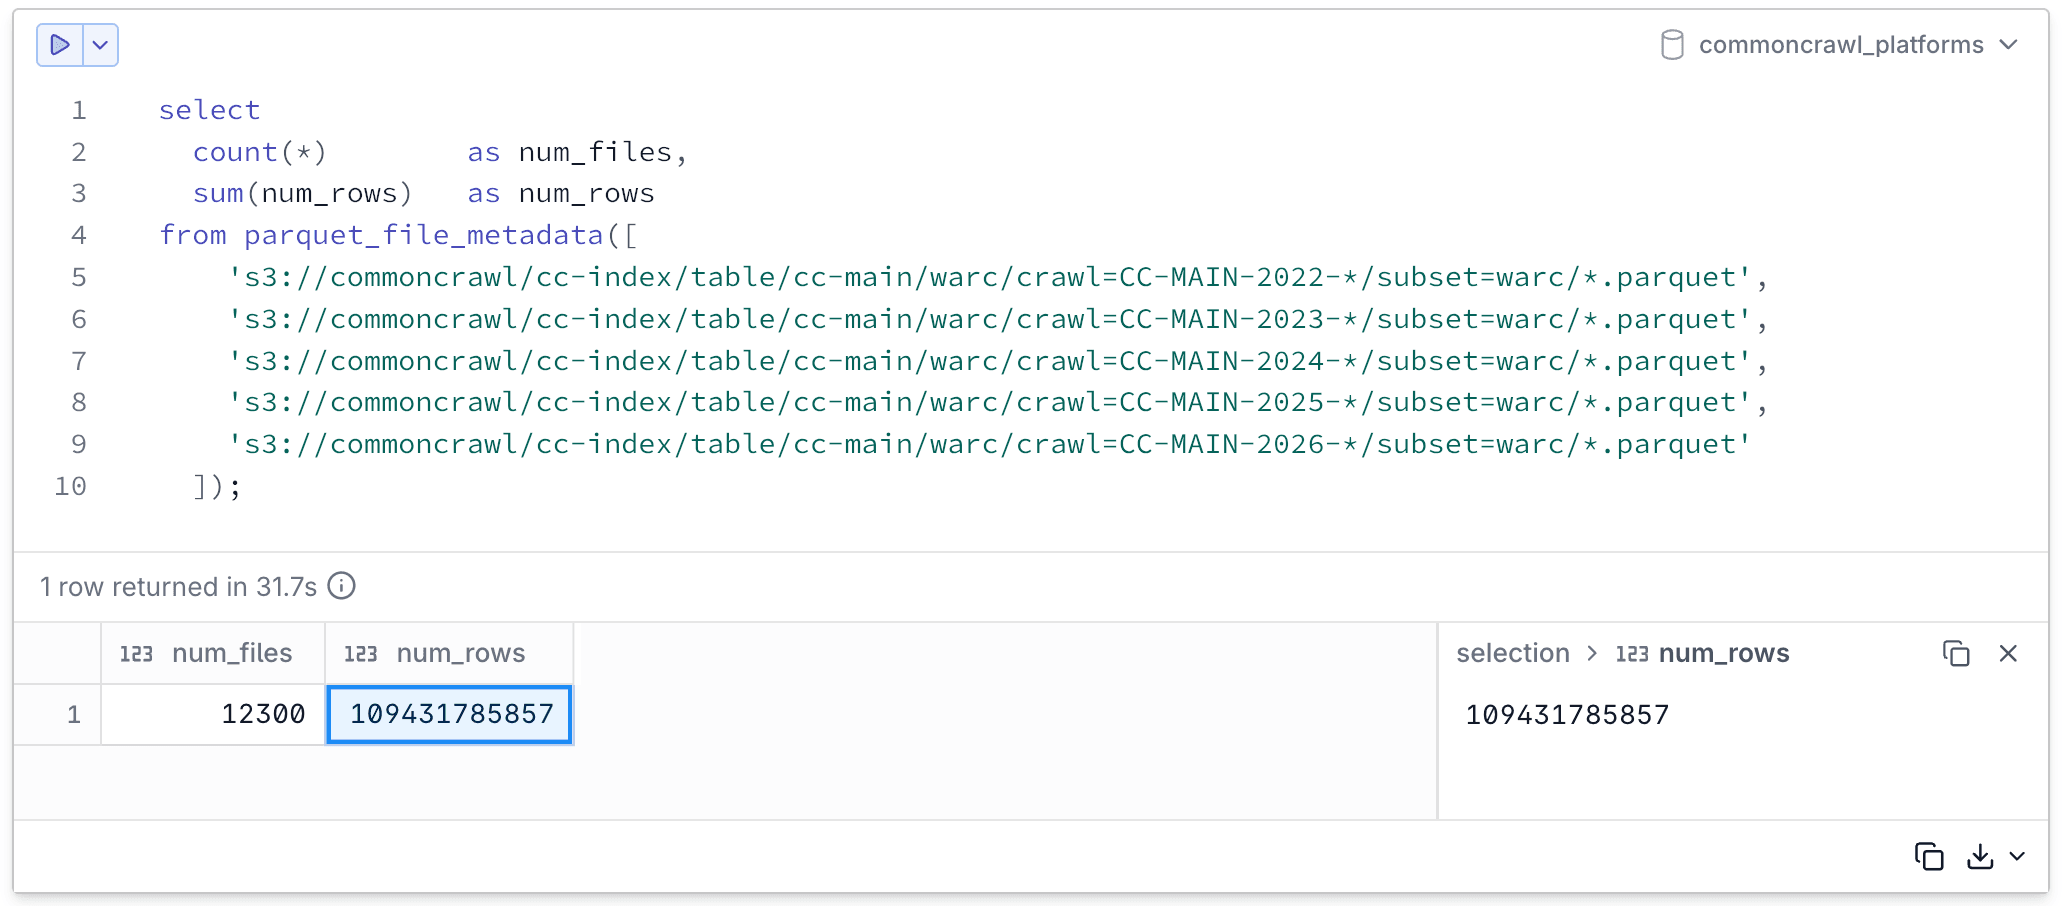
<p>We ran the standard TPC-DS (99 queries) query sets, unmodified, using the query text that ships in DuckDB's <code>tpcds</code> extension.The queries ran against MotherDuck instances (Mega or Giga) running DuckDB version 1.5.6. The Scale Factor 1k dataset was generated with DuckDB's built-in <code>dsdgen</code> and stored in a MotherDuck share; TPC-DS 10k scale factor set came from Amazon's public dataset (<br>
<code>s3://redshift-downloads/TPC-DS/2.13/10TB</code>) . The queries were fun from a Python DuckDB client (also version 1.5.6) on EC2 in us-east-1, with the parameter <code>attach_mode=single</code> which avoids loading databases other than the ones being used in the benchmark.  Each time is client wall-clock and includes fetching the results. The first run is cold, and we report the best of three iterations per query. Results are summarized as the geometric mean of hot query times. The blog posts we compared with also reported ‘hot’ query times, and the approach taken was similar to how snowflake ran TPCH in their own recent blog <a href="https://www.snowflake.com/en/blog/engineering/snowflake-tpc-h-benchmark-performance0/">post</a>.</p>
]]></content>
        <author>
            <name>Jordan Tigani</name>
        </author>
    </entry>
    <entry>
        <title type="html"><![CDATA[DuckDB Ecosystem Newsletter : October 2026]]></title>
        <id>https://motherduck.com/blog/duckdb-ecosystem-newsletter-october-2026</id>
        <link href="https://motherduck.com/blog/duckdb-ecosystem-newsletter-october-2026"/>
        <updated>2026-10-18T00:00:00.000Z</updated>
        <summary type="html"><![CDATA[The October 2026 DuckDB Ecosystem Newsletter: Jev typed AI answers in DuckDB and MotherDuck SQL, DuckDB 2.0's PEG parser and async S3 reads, DuckLake maintenance, analysis-ready OpenStreetMap, OneLake in the browser, a native Mac app, plus a community spotlight on Mark Litwintschik.]]></summary>
        <content type="html"><![CDATA[
<h2>HEY, FRIEND </h2>
<p>I hope you're doing well. I'm <a href="https://www.ssp.sh/">Simon</a>, and I am happy to share another monthly newsletter with highlights and the latest updates about DuckDB, delivered straight to your inbox.</p>
<p>In this October issue, I gathered the usual 10 updates, starting with Jev, the new "System One" model and how to use it with DuckDB and MotherDuck, the new PEG parser and faster S3 reads in DuckDB 2.0, a maintenance strategy for DuckLake, querying OneLake in the browser, and a native Mac app. Lots of great articles from the community as always.</p>
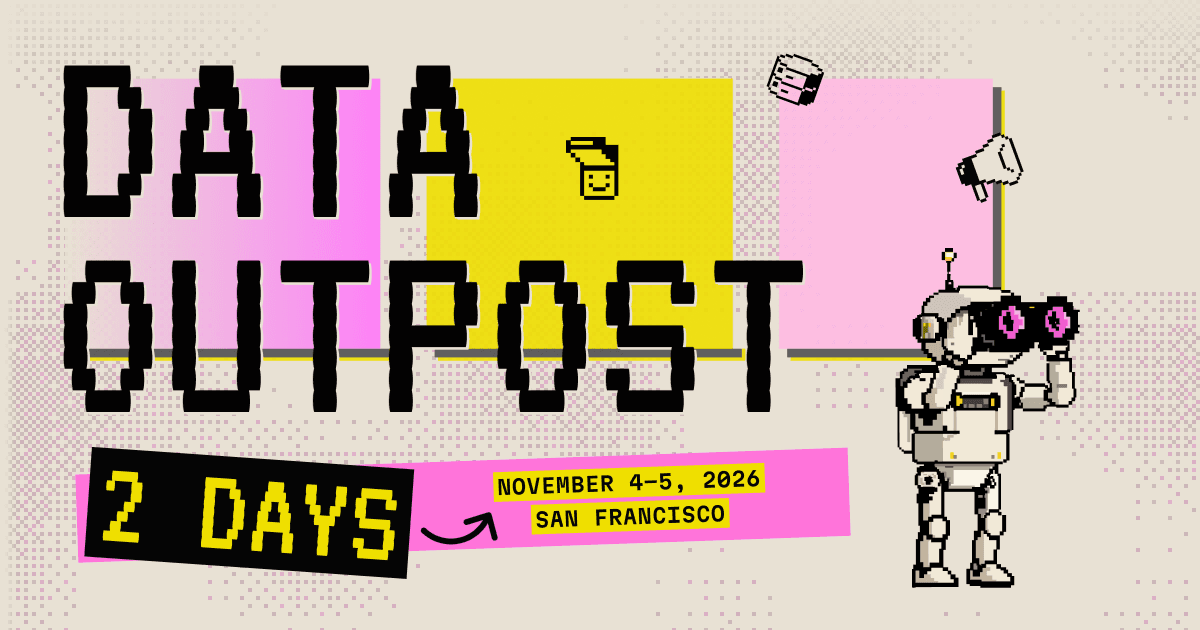
<p><a href="https://www.dataoutpost.ai/">Data Outpost</a> is happening November 4-5 in SF, with speakers from DoorDash, Perplexity, Stripe, Canva, Vercel, and Fivetran + dbt Labs on agentic data infrastructure, the semantic layer, and data stacks after agents.</p>
<h3><a href="https://motherduck.com/blog/motherduck-supports-jev/">Introducing prompt_jev(): bringing Jev to DuckDB/MotherDuck SQL</a></h3>
<p><strong>TL;DR</strong>: Jev, TypeSafe AI's recently announced "System One" model, returns a typed answer (a yes/no probability, one label from a fixed list, or an ordinal score) instead of generated text and can now be called from SQL through the <code>jev</code> DuckDB community extension and MotherDuck's <code>prompt_jev()</code>.</p>
<p>I combined different articles for this paragraph, in the <a href="https://duckdb.org/2026/09/29/jev">first</a>, Geertjan and Gábor walk through <code>INSTALL jev FROM community;</code> and the <code>jev()</code>, <code>jev_prob()</code>, <code>jev_choice()</code> and <code>jev_score()</code> functions. They note that a cheaper predicate such as <code>age > 40</code> in the same <code>WHERE</code> clause runs first, so rows it rejects are never sent to the API. Then <a href="https://motherduck.com/blog/motherduck-supports-jev/">Hamilton, Till and Jacob</a> report 89% accuracy on 100k AG News rows in 40 s for $0.50, against 83% in 17m49s for gpt-5-nano and 88% in about 32 minutes and $37.58 for GPT-5.6 Terra. Runs at 1M and 10M rows performed similarly, and the post includes SQL that reproduces the benchmark from <code>hf://datasets/fancyzhx/ag_news/...</code>.</p>
<p><a href="https://motherduck.com/blog/jev-for-analytics/">Mehdi</a> classified 100k CFPB complaints in 82.2 s into a struct with <code>request.choice</code> and <code>request.confidence</code> fields. On high-confidence rows (≥ 0.8), Jev matched the label GPT-5 and Claude Opus agreed on 96.9% of the time. In <a href="https://motherduck.com/blog/jev-analytics-use-cases/">Part 2</a>, he swapped a remote-work regex (22 hand-tuned alternatives plus exclusion lists) for a single <code>choice :=</code> question. On 2,000 postings it ran in 1.7 s, versus 37.0 s for <code>prompt()</code>. The regex was still faster at 0.2 s, but Jev only needs label definitions to maintain. There's also the <a href="https://www.youtube.com/watch?v=Nyz26272jmI">video version</a> with Hamilton.</p>
<h3><a href="https://duckdb.org/2026/08/20/duckdb-20-peg-parser">DuckDB v2.0: Your Database Deserves a Better Parser</a></h3>
<p><strong>TL;DR</strong>: DuckDB v2.0 replaces its PostgreSQL-derived LALR parser with a PEG-based parser to simplify grammar evolution.</p>
<p>Daniël explains that shifting to a Parsing Expression Grammar (PEG) allows DuckDB to avoid traditional Bison shift/reduce conflicts by using ordered choices and packrat parsing. This memoization technique prevents exponential backtracking on malformed queries; for instance, parsing 19 unmatched parentheses improved from 10.6 seconds to 0.001 seconds.</p>
<p>The new architecture allows extensions to register custom grammar rules at runtime, such as BigQuery-style pipe syntax (<code>|></code>), by hooking into extension points like <code>select_atom_rule</code>. This enables developers to reuse existing internal rules like <code>GroupByClause</code> or <code>WhereClause</code> within their own syntax transformations.</p>
<h3><a href="https://www.linkedin.com/posts/kelsey-hightower-849b342b1_ive-been-playing-with-duckdb-and-i-gotta-share-7510475105206996992-Jvoh/">Kelsey Hightower using DuckDB</a></h3>
<p><strong>TL;DR</strong>: Even Kelsey Hightower (known for his work with Kubernetes &#x26; cloud computing) is using DuckDB , and says:</p>
<blockquote>
<p>I've been playing with DuckDB and I gotta say the docs are amazing. The built-in web shell is a really nice touch. You can play with DuckDB right inside your web browser. This might be my SQLite replacement.</p>
</blockquote>
<h3><a href="https://thefulldatastack.substack.com/p/ducklake-in-production-maintenance">DuckLake in Production: Maintenance Strategy</a></h3>
<p><strong>TL;DR</strong>: Hoyt details automated snapshot expiration and file cleanup routines to optimize storage and query performance.</p>
<p>Technical implementations focus on managing the DuckLake metadata catalog and S3 storage. DuckLake optimizes small writes by inlining data directly in the catalog, which may eventually require <code>ducklake_flush_inlined_data</code> to move rows to Parquet. After attaching the database, engineers should execute <code>CALL ducklake_expire_snapshots(..., older_than => now() - INTERVAL '7 days')</code> to enforce time-travel policies. This must be followed by <code>ducklake_cleanup_old_files</code> to purge physical data from S3 and <code>ducklake_delete_orphaned_files</code> to remove untracked Parquet files.</p>
<h3><a href="https://tech.marksblogg.com/layercake-openstreetmap.html">Analysis-Ready OpenStreetMap</a></h3>
<p><strong>TL;DR</strong>: Mark highlights how the Layercake project's spatially-sorted Parquet files enable high-performance OpenStreetMap analysis with DuckDB via metadata-based row-group skipping.</p>
<p>Mark demonstrates how DuckDB's Parquet reader efficiently processes the 39 GB buildings dataset. A count query with <code>GROUP BY 2</code> on 657 million rows consumed only 2.2 MiB of bandwidth, showcasing projection pushdown and column-level statistics. The data is updated weekly and hosted on Cloudflare. He also details integrating these datasets into <a href="https://www.qgis.org/download/">QGIS</a> using the GeoParquet Downloader plugin, which utilizes an internal DuckDB environment to perform bounding box queries against remote files.</p>
<h3><a href="https://techontherocks.show/31/">Falling Into Databases: The DuckDB Story with Hannes Mühleisen</a></h3>
<p><strong>TL;DR</strong>: Hannes explains how DuckDB grew from an accidental career at the CWI research lab into a from-scratch in-process analytical database.</p>
<p>The team first tried retrofitting MonetDB, but usability requirements leaked into engine design, so they restarted despite a roughly three-year setback. Adoption came from fixing concrete pain points: a robust CSV parser, Parquet reading without Hadoop, and SQL conveniences like trailing commas (<code>SELECT a, b, FROM t</code>). Another one is that operators spill to disk instead of crashing when intermediate results exceed memory. DuckLake later stored lake metadata in a database rather than Avro files. Quack is an HTTP-based protocol with DuckDB on both client and server, so queries can run locally, remotely, or split between them.</p>
<h3><a href="https://github.com/djouallah/onelake_studio">Serverless, in-browser SQL over your OneLake</a></h3>
<p><strong>TL;DR</strong>: The OneLake Studio project offers a SQL interface for querying OneLake data directly using DuckDB-WASM, eliminating the need for backend infrastructure or data copying.</p>
<p>The application is a static web app. It integrates with Azure Storage via delegated permissions (<code>user_impersonation</code>) to access data using an Entra ID token and queries data through OneLake's Iceberg REST catalog, processing tables via Parquet files. For efficient data retrieval, it utilizes HTTP range requests and implements a service worker (<a href="https://github.com/djouallah/onelake_studio/blob/main/site/sw.js"><code>site/sw.js</code></a>) for caching responses (up to 512MB).</p>
<p>Data files are registered as URLs, allowing DuckDB to fetch only required row groups and columns, with limitations including a 200,000-row cap for query results to prevent browser tab crashes. Other file formats like CSV, JSON, and SQLite are handled, with SQLite files being copied and converted into DuckDB tables. <a href="https://studio.projectscontrols.com/">Web Demo</a></p>
<h3><a href="https://github.com/KoliStat/bedevere-wise">Bedevere-wise: In-browser SQL data viewer for SAS, SPSS, Stata, Parquet, Excel, and CSV files</a></h3>
<p><strong>TL;DR</strong>: <code>bedevere-wise</code> is a local-first viewer that utilizes DuckDB-WASM to query and visualize files like Parquet, SAS (statistical software packages), and SPSS without data leaving the device.</p>
<p>The technical implementation relies on a <code>DuckDBService</code> wrapper and a <code>DataProvider</code> interface to drive canvas-rendered grids and Vega-Lite charts. Integration is straightforward; developers can <code>await duck.initialize()</code> and then execute queries like <code>CREATE OR REPLACE TABLE table_name AS SELECT * FROM read_parquet('file.parquet')</code>. The project also features an <code>EmbedSqlEditor</code> with a PostgreSQL-extended dialect. <a href="https://bedeverewise.app/">Web app</a>, <a href="https://kolistat.com/blog/bedevere-0-15/">Latest updates</a></p>
<h3><a href="https://performancede.substack.com/p/duckdb-20-and-s3-file-read-performance">DuckDB 2.0 and S3 File Read Performance</a></h3>
<p><strong>TL;DR</strong>: DuckDB 2.0 introduces native asynchronous I/O for file reads, delivering a ~67% performance improvement for querying large datasets on AWS S3.</p>
<p>Matt benchmarked the 2.0 Alpha against version 1.5.6, processing thousands of JSON files. By utilizing <code>read_json_auto()</code> combined with <code>UNNEST</code>, the test showed that the async engine reduces wait times on high-latency storage. For a workload of 10,000 files, the execution time decreased from approximately 297 seconds to 99 seconds.</p>
<h3><a href="https://datapuddle.app/">I built a native Mac app for DuckDB</a></h3>
<p><strong>TL;DR</strong>: Haris developed Datapuddle, a DuckDB client optimized for columnar data rendering with minimal memory overhead.</p>
<p>Haris implemented a custom grid view utilizing <code>CGContext</code> and <code>CTLineDraw</code> to read cells directly from DuckDB's columnar chunks at draw time, bypassing row-object instantiation. This maintained flat memory usage while processing a 41-million-row Parquet file. For Mac users, this provides a low-latency environment for ad-hoc exploration of large datasets without the resource footprint of Chromium-based alternatives. <a href="https://apps.apple.com/us/app/datapuddle/id6811235967?mt=12">AppStore</a> (not free though), <a href="https://sh.reddit.com/r/DuckDB/comments/1wshn6l/i_built_a_native_mac_app_for_duckdb/">Reddit post</a>.</p>
<h3><a href="https://luma.com/motherduck-hazel">Behind the Agent: How Hazel Built an AI Coworker for Consumer Brands</a></h3>
<p><strong>2026-10-21. h: 09:30 PT. Online</strong></p>
<h3><a href="https://luma.com/mother-6ug3">DuckLake Performance Optimization: Faster Queries From Your Lakehouse</a></h3>
<p><strong>2026-10-27. h: 10:00 PT. Online</strong></p>
<h3><a href="https://luma.com/flock-in-Helsinki">The Data Team's New Tools (MotherDuck at Helsinki Data Week)</a></h3>
<p><strong>2026-10-28. h: 15:00. Helsinki Bryggeri Brewhouse, Helsinki, Finland</strong></p>
<h3><a href="https://www.dataoutpost.ai/">Data Outpost 2026</a></h3>
<p><strong>2026-11-05. h: 08:30. Convene 100 Stockton, San Francisco, CA</strong></p>
<h3><a href="https://luma.com/mother-b13e">DuckDB 2.0: How to Speed Up Your Workloads</a></h3>
<p><strong>2026-11-10. h: 09:00 PT. Online</strong></p>
]]></content>
        <author>
            <name>Simon Späti</name>
        </author>
    </entry>
    <entry>
        <title type="html"><![CDATA[prompt_jev() now works on images]]></title>
        <id>https://motherduck.com/blog/motherduck-announce-jev-image</id>
        <link href="https://motherduck.com/blog/motherduck-announce-jev-image"/>
        <updated>2026-10-16T00:00:00.000Z</updated>
        <summary type="html"><![CDATA[prompt_jev() now takes images: store them as BLOBs in MotherDuck, ask closed questions in SQL, and get typed answers with a confidence score you can join with the rest of your data.]]></summary>
        <content type="html"><![CDATA[
<p>Three weeks ago we brought <a href="https://motherduck.com/blog/motherduck-supports-jev/">prompt_jev()</a> to MotherDuck, a week after TypeSafe announced Jev. You ask a closed question in plain English, pick the shape of the answer (yes/no, one choice from a list, a score), and get a typed result with a confidence score, straight from SQL. We showed <a href="https://motherduck.com/blog/jev-analytics-use-cases/">five use cases</a> on text columns.</p>
<p>Today, with TypeSafe's Jev 1.14, <code>prompt_jev</code> also <strong>takes images</strong>. Store them in a <code>BLOB</code> column, ask your questions, and the answers come back as columns you can filter, join and GROUP BY with the rest of your data.</p>
<p>And yes, we also asked seven models the only question that really matters: hot dog or not hot dog? On <a href="https://hotdogbench.com/#leaderboard">hotdogbench.com</a>, Jev isn't the top dog, but it's the first one to the bun.</p>
<h2>Try it in one query</h2>
<p>Hugging Face hosts lots of public image datasets as Parquet, with each image stored as bytes. Read them with <code>hf://</code> and hand the bytes straight to Jev:</p>
<pre><code class="language-sql">SELECT image.path AS file,
       prompt_jev([{name: 'dish', image: image.bytes}], 'Is `dish` a dessert?') AS is_dessert
FROM 'hf://datasets/ethz/food101/data/validation-00000-of-00003.parquet'
LIMIT 5;
</code></pre>
<p>| file        | is_dessert |
| ----------- | ---------: |
| 1827892.jpg |       0.72 |
| 2802124.jpg |       0.90 |
| 2192983.jpg |       0.90 |
| 1062952.jpg |       0.95 |
| 3157161.jpg |       0.93 |</p>
<p>Each row gets a probability between 0 and 1. These five photos are beignets, so they score high.</p>
<h2>How fast, how accurate, how cheap?</h2>
<p>We used the same dataset: <a href="https://huggingface.co/datasets/ethz/food101">Food-101</a>, labeled photos of 101 dishes. One question per photo, "Which dish is shown?", with all 101 dishes as the allowed answers, asked to Jev, Gemini, GPT and Claude on the same 1,010 photos (10 per dish).</p>
<p>| Model                              | Rows/s | Accuracy | Cost for the 1,010 photos |
| ---------------------------------- | -----: | -------: | ------------------------: |
| <strong>Jev (prompt_jev in MotherDuck)</strong> | <strong>44</strong> |    90.2% |                <strong>~$0.06</strong> |
| Gemini 3.8 Flash, low thinking     |     10 |    96.8% |                     $1.14 |
| Gemini 3.8 Flash, default thinking |      7 |    97.0% |                     $1.43 |
| GPT 6.1 Sol                        |      7 |    93.4% |                     $1.89 |
| Claude Opus 5.5                    |      9 |    95.7% |                     $6.60 |</p>
<p>We can score accuracy here because Food-101 has the right answer for every photo. On your own data you won't have that, so the real question is which answers you can trust.</p>
<p>The big difference between Jev and a standard LLM is the <strong>confidence score</strong>. Every answer comes with one, and on this benchmark it reflects how often Jev is actually right. If you keep only the answers at 0.8 or more (<code>WHERE jev.confidence >= 0.8</code>), Jev is right <strong>97.7%</strong> of the time, on 80% of the photos.</p>
<p>| Min. confidence threshold | Photos kept | Accuracy on kept photos |
|---|---:|---:|
| (keep everything) | 100% | 90.2% |
| 0.5 | 94% | 92.7% |
| 0.7 | 86% | 95.8% |
| 0.8 | 81% | 97.7% |
| 0.9 | 73% | 98.5% |
| 0.95 | 65% | 98.9% |
| 0.99 | 50% | 99.2% |</p>
<p>This of course begs the question - what if we combine Jev with another model to a cheap first pass and then a secondary cleanup loop?</p>
<p>| Models to use | Accuracy | Cost per 1,000 photos |
|---|---:|---:|
| Gemini 3.8 Flash alone | 97.0% | $1.40 |
| <strong>Jev + Gemini 3.8 Flash</strong> | <strong>96.5%</strong> | <strong>~$0.45</strong> |
| Jev + Gemini Flash-Lite | 95.3% | ~$0.18 |
| Jev alone | 90.2% | $0.08 |</p>
<p>Notice how we can achieve big gains in accuracy for relatively small increases cost compared to using a System Two LLM for the entire job.</p>
<h2>Getting your images in</h2>
<p>If your images sit in S3, one query loads them into a <code>BLOB</code> column (with an S3 secret in place):</p>
<pre><code class="language-sql">CREATE TABLE images AS
SELECT filename AS path, content AS image
FROM read_blob('s3://my-bucket/photos/*.jpg');
</code></pre>
<p>Jev needs each side of an image between 280 and 1,568 pixels. Bigger images need a resize first: a <a href="https://motherduck.com/docs/concepts/flights/">Flight</a> (Python that runs on MotherDuck compute) with <a href="https://pillow.readthedocs.io/en/stable/reference/Image.html">Pillow</a> does it. The docs have a <a href="https://motherduck.com/docs/sql-reference/motherduck-sql-reference/ai-functions/prompt-jev/#resize-images-before-you-send-them">ready-to-use example</a> that reads from S3, shrinks anything too big and writes the result back as a BLOB.</p>
<p>Or skip the code and ask the MotherDuck MCP server from Claude or your agent of choice:</p>
<blockquote>
<p>Load the JPEGs under s3://my-bucket/photos/ into a new table <code>photos.main.images</code>, one row per file with the image as a BLOB. Resize anything longer than 1568px on its longest side, skip images under 280px on their shortest side, and run it as a MotherDuck Flight. Tell me how many images landed and how many were skipped.</p>
</blockquote>
<h2>Five centuries of art in one GROUP BY</h2>
<p>We took the <a href="https://github.com/metmuseum/openaccess">Metropolitan Museum of Art's open access collection</a>, half a million CC0 catalog records, and kept every public-domain painting, print, drawing and photograph with an image: about 77k works, loaded as 600px BLOBs. Then we asked <strong>14 questions about every image in one SQL query</strong>. Here are 4 of them:</p>
<pre><code class="language-sql">SELECT object_id,
       prompt_jev(
         [{name: 'art', image: image}],
         questions := {
           smile: {type: 'choice',
                   instructions: 'If a human face is clearly visible in `art`, what is the expression of the most prominent face?',
                   criteria: ['no_clear_face', 'neutral_or_serious', 'closed_mouth_smile', 'smile_showing_teeth', 'laughing']},
           dog: {type: 'noul', instructions: 'Is there a dog anywhere in `art`?'},
           dog_box: {type: 'box', instructions: 'the dog in `art`'},
           skull: {type: 'noul', instructions: 'Does `art` show a human skull or skeleton?'}
           -- plus 10 more: main subject, weather, sunset, drink, food, cat, ...
         }) AS jev
FROM images;
</code></pre>
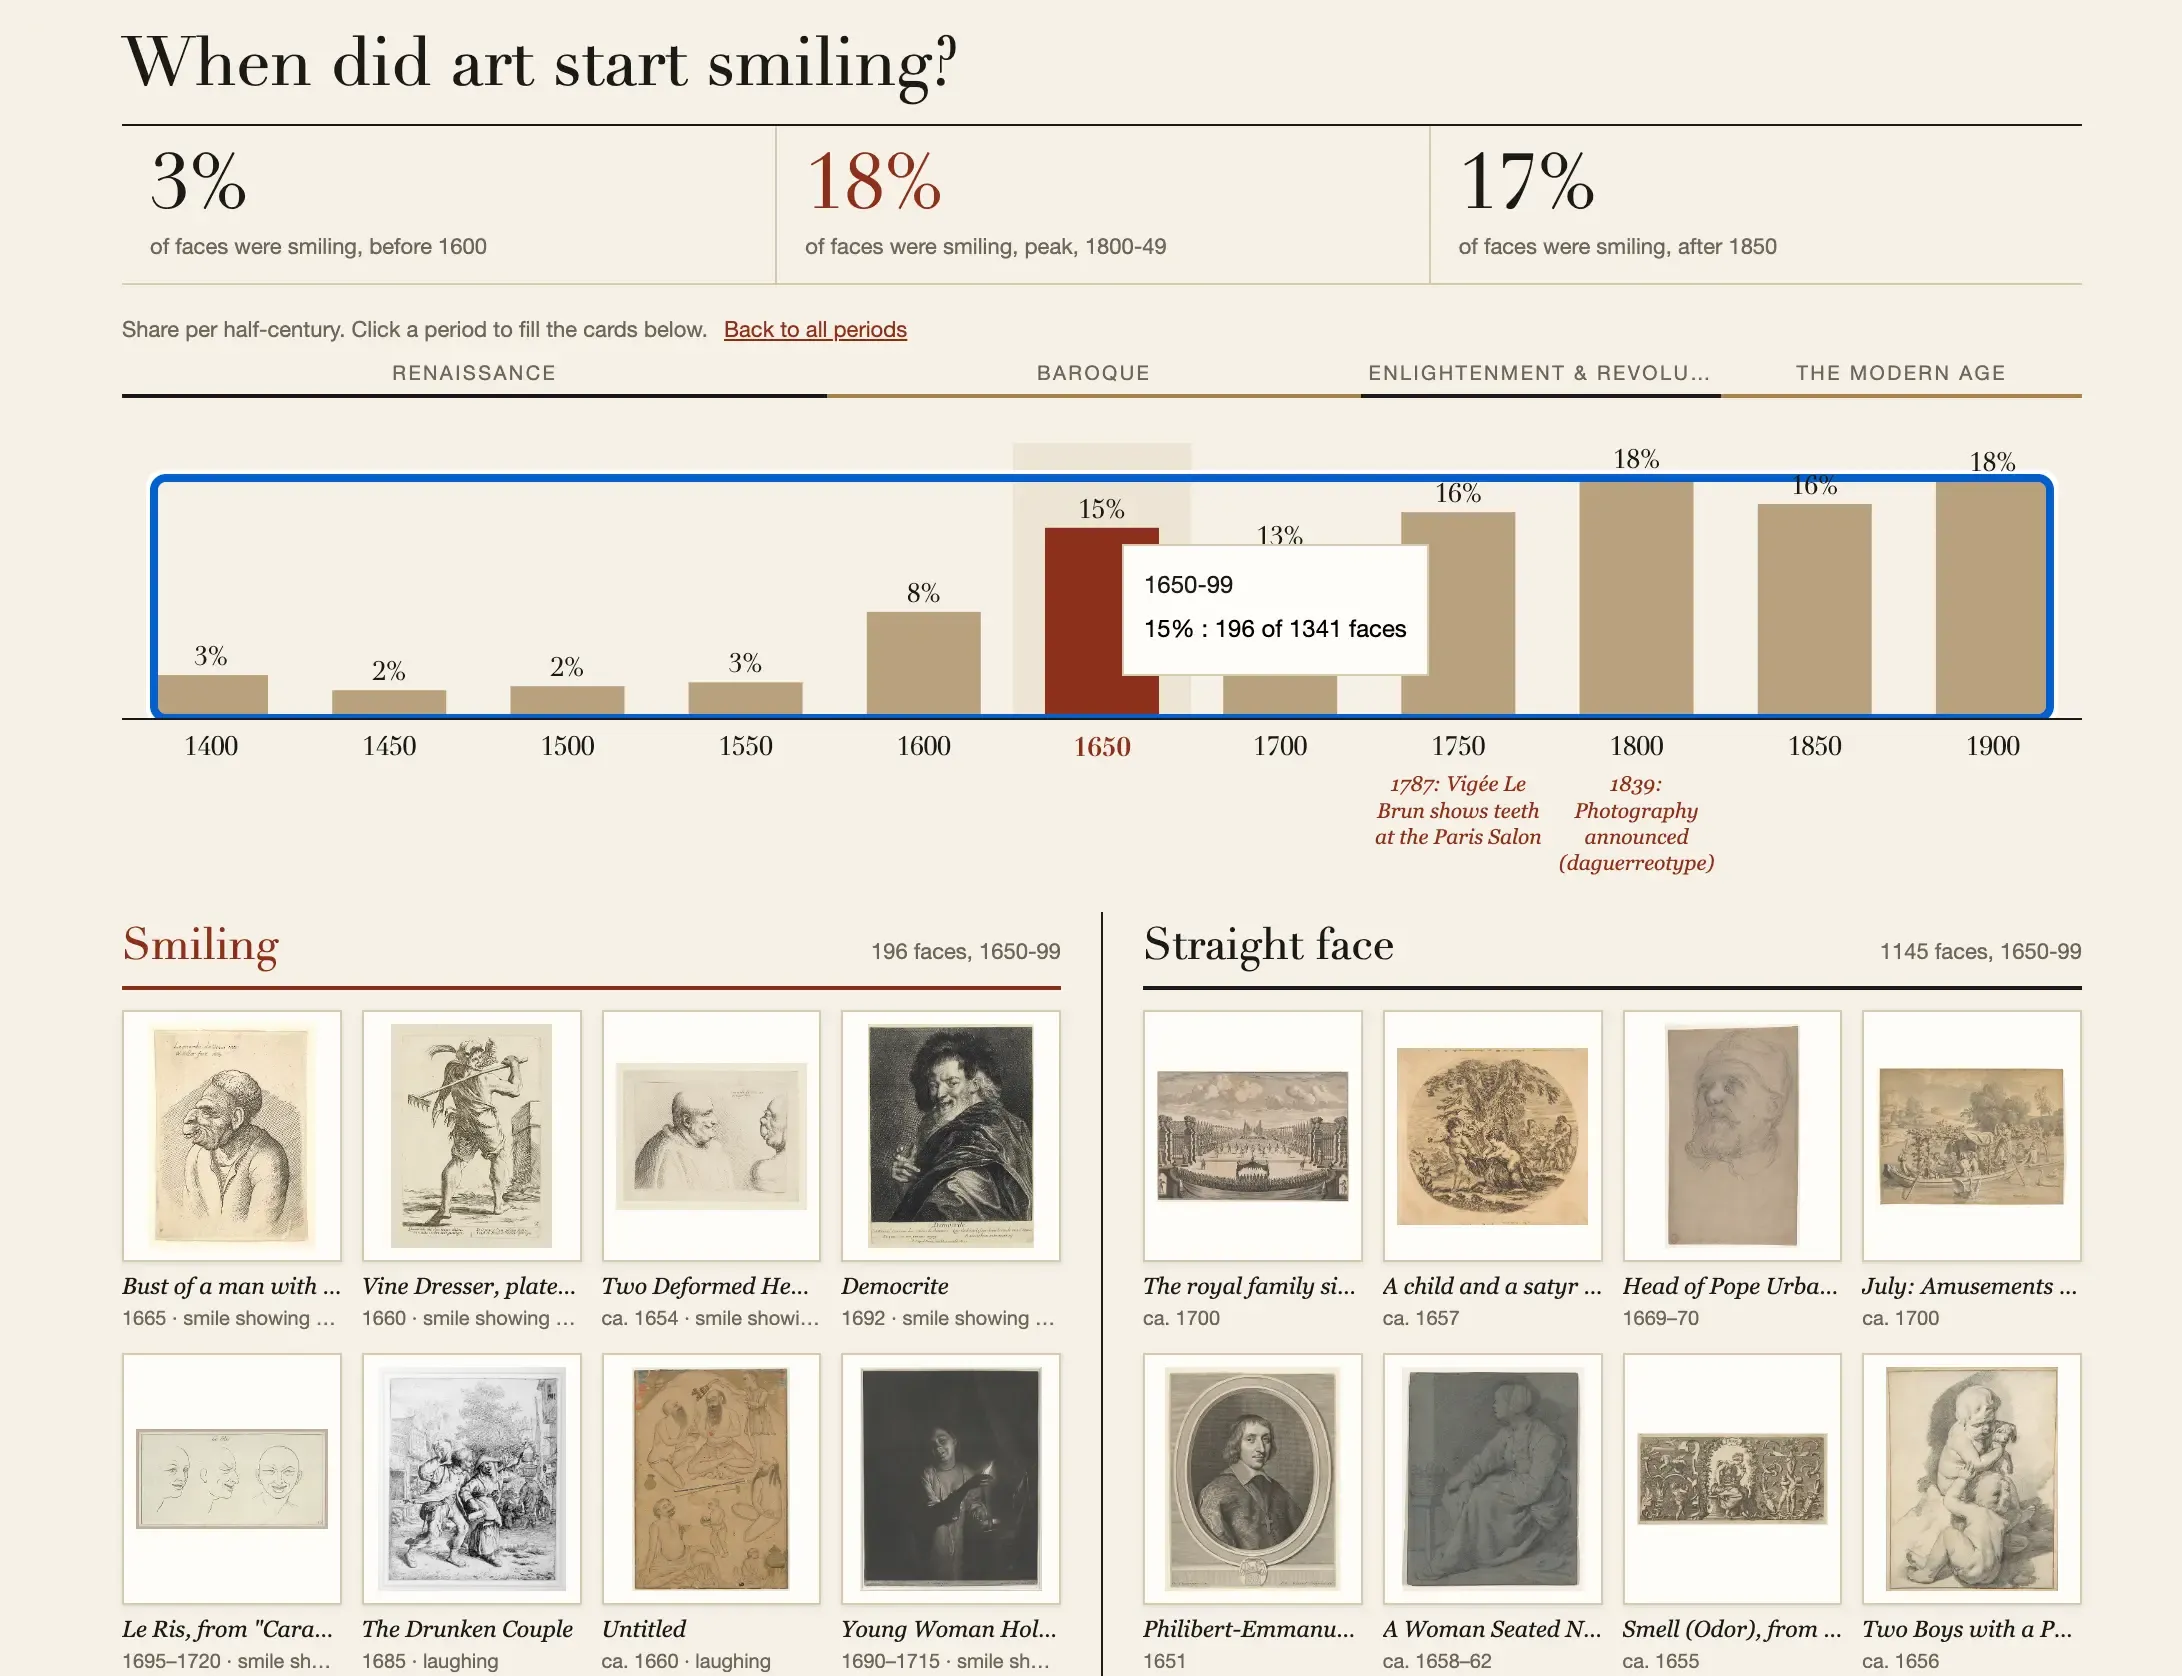
<p>Once the answers are stored as columns, they join with the Met's catalog like any other data. When did people start smiling in art? One <code>GROUP BY</code>:</p>
<pre><code class="language-sql">SELECT (floor(o.begin_year / 50) * 50)::INT AS half_century,
       round(100 * count(*) FILTER (WHERE f.smile IN ('closed_mouth_smile', 'smile_showing_teeth', 'laughing'))
                 / count(*) FILTER (WHERE f.smile &#x3C;> 'no_clear_face')) AS pct_smiling
FROM features f  -- Jev's answers, one column per question
JOIN objects o USING (object_id)
WHERE o.begin_year BETWEEN 1400 AND 1949
  AND o.end_year - o.begin_year &#x3C;= 25  -- only works the Met dates within 25 years
  AND NOT f.rejected
GROUP BY ALL
ORDER BY half_century;
</code></pre>
<p><img src="https://motherduck-com-web-prod.s3.us-east-1.amazonaws.com/assets/img/articles/motherduck-announce-jev-image/images/smiles_by_half_century_fd12512a88.webp" alt="Share of visible faces that smile, by half-century"></p>
<p>Almost nobody smiles before 1600! Many reasons for <a href="https://history.nebraska.gov/why-so-serious-3-reasons-why-you-never-see-a-smile-in-old-photographs/">that</a>, but that's for another blog.</p>
<p>Explore the full dive below, or <a href="https://motherduck.com/dive-gallery/dives/the-met-measured-five-centuries-of-art-one-group-by">open it in the dive gallery</a>:</p>
<h2>Get started</h2>
<p>Images are now just another column in MotherDuck. Load your product photos, scans, screenshots or camera-trap pictures as BLOBs, ask your questions, and join the answers with the rest of your data.</p>
<p>Everything you need is in the <a href="https://motherduck.com/docs/sql-reference/motherduck-sql-reference/ai-functions/prompt-jev/">prompt_jev() docs</a>.</p>
]]></content>
        <author>
            <name>MotherDuck team</name>
        </author>
    </entry>
    <entry>
        <title type="html"><![CDATA[MotherDuck is coming to Azure]]></title>
        <id>https://motherduck.com/blog/azure-waitlist</id>
        <link href="https://motherduck.com/blog/azure-waitlist"/>
        <updated>2026-10-15T00:00:00.000Z</updated>
        <summary type="html"><![CDATA[MotherDuck is coming to Azure. Pick your region on the waitlist; regions open in order of demand. Your Copilot agents can connect to MotherDuck today.]]></summary>
        <content type="html"><![CDATA[
<p><strong>TL;DR:</strong> MotherDuck is coming to Microsoft Azure. <a href="https://motherduck.com/product/azure/">Join the waitlist</a> and tell us which Azure region you need. You don't have to wait to start on the AI side: the MotherDuck MCP server already works with Copilot Studio and GitHub Copilot.</p>
<p>Many data teams don't get to pick their cloud. Their company standardized on Microsoft years ago, so identity runs through Entra ID, the data is on Azure Blob Storage, and the reports run through Power BI. Hundreds of those teams have asked us for MotherDuck on Azure. Today they query across clouds from MotherDuck on AWS, and Azure bills them for egress on every query.</p>
<p>So we're bringing MotherDuck to Azure. We're building it to be the same product, running in Azure instead of AWS.</p>
<h2>What MotherDuck is</h2>
<p>MotherDuck is a serverless data warehouse built on DuckDB, where every person and agent gets its own compute on the same data.</p>
<p>Most warehouses give each team or workload its own cluster, sized by an admin. That works when a few analysts run reports. It breaks down when every person, and every person's agents, ask questions at the same time. Sizing each cluster for the peak leaves capacity that is mostly idle, and sizing it for the average means people wait at the peak.</p>
<p>Instead, MotherDuck gives every user, every agent and every customer its own compute, called a Duckling. Each one connects to the same shared data and is sized independently. A heavy agent doesn't slow anyone else's work. These Ducklings scale to zero when they're idle, so you pay for what runs, not for the peak.</p>
<p>On top of that architecture, we've built the rest of the platform for agents.</p>
<h2>Built for agents</h2>
<ul>
<li><strong>An MCP server for your agents.</strong> Connect Claude, ChatGPT, Cursor, Copilot and other MCP clients to your MotherDuck databases, and let the LLM write the SQL query. There are both read-only and read-write MCP tools depending on your needs.</li>
<li><strong>Dives: data apps, built by agents.</strong> Ask a question and get back an interactive, live app. Share it with your team, or embed it in your own product for your customers.</li>
<li><strong>Guides: business context in one place.</strong> Write down how your company defines revenue, which table to trust and what's changed recently, so every person and agent works from the same definitions.</li>
<li><strong>Flights: pipelines next to the data.</strong> The agent writes Python jobs for ingestion, enrichment and transformation of data, with a built-in cron for scheduling.</li>
</ul>
<p>The data team uses these to bring in the data and write down what it means. Everyone else asks questions on top, each person and agent on its own Duckling, so a busy agent never slows anyone else down.</p>
<h2>What it looks like in practice</h2>
<p><a href="https://motherduck.com/case-studies/ahead-computing-agent-first-data-platform/">AheadComputing</a>, a startup designing a RISC-V CPU, built its first data platform on Azure Postgres. Once the team started using it, transformations on small data sets took over an hour. It moved to MotherDuck and was in production within a week. Hardware engineers who don't write SQL now ask Claude Code, which queries MotherDuck through the MCP server. 74% of the company's engineers were onboarded in the first weeks. A dashboard request that used to take three months now takes about 90 minutes, because engineers build their own Dives.</p>
<p><img src="https://motherduck-com-web-prod.s3.us-east-1.amazonaws.com/assets/img/Azure_Hero_Meadow_photo_2x_886935722a.png" alt="Azure Hero — Meadow (photo)@2x.png"></p>
<h2>Ready for Microsoft</h2>
<p>The Microsoft tools your company already uses connect to MotherDuck today.</p>
<ul>
<li><strong>Entra ID.</strong> Your team signs in to MotherDuck with the Microsoft identity it already uses.</li>
<li><strong>Copilot Studio.</strong> Add MotherDuck as an MCP tool on your agent. Each person can sign in with their own MotherDuck account, or the agent can use a shared service account. For an agent you publish to a wide audience, a read-scaling token keeps it read-only.</li>
<li><strong>GitHub Copilot in VS Code.</strong> Install the MotherDuck MCP server, and its tools appear in Copilot's Agent mode.</li>
<li><strong>Power BI.</strong> Connect through Power BI's native PostgreSQL connector and the MotherDuck Postgres endpoint. You don't need a custom connector or a driver install.</li>
</ul>
<p>The <a href="https://motherduck.com/docs/key-tasks/ai-and-motherduck/mcp-setup/">MCP setup docs</a> and the <a href="https://motherduck.com/docs/integrations/bi-tools/powerbi/">Power BI guide</a> have the detailed steps, and today your Copilot agent and your Power BI reports reach MotherDuck on AWS. With Azure regions, the compute will sit in Azure, right next to your data.</p>
<p>In addition to handling data warehousing workloads, MotherDuck can sit beside the other parts of the ecosystem. Fabric, Synapse and Databricks can handle portions of the work, with MotherDuck serving the interactive layer: dashboards, ad hoc analysis, customer-facing analytics and agents.</p>
<h2>Help decide which region we start with</h2>
<p>We haven't picked our first Azure region yet, and we want <a href="https://motherduck.com/product/azure/">feedback</a> from customers and prospects to decide. Regions will open in order of demand, and early access within each region goes out in waitlist order. We'll email you when yours opens, and we'll share timing, pricing and what early access includes before then. Joining doesn't commit you to anything.</p>
<h2>In the meantime</h2>
<p>MotherDuck on AWS can already read Parquet and CSV files in Azure Blob Storage:</p>
<pre><code class="language-sql">CREATE SECRET IN MOTHERDUCK (TYPE azure, CONNECTION_STRING '&#x3C;your connection string>');

SELECT * FROM 'az://my-container/events/*.parquet' LIMIT 10;
</code></pre>
<p>The <a href="https://motherduck.com/docs/integrations/cloud-storage/azure-blob-storage/">Azure Blob Storage docs</a> have the details.</p>
<p><a href="https://motherduck.com/product/azure/">Join the waitlist</a> and tell us which Azure region you need.</p>
]]></content>
        <author>
            <name>Jacob Matson</name>
        </author>
    </entry>
    <entry>
        <title type="html"><![CDATA[A Chief of Staff's Guide to Context Layers]]></title>
        <id>https://motherduck.com/blog/chief-of-staff-guide-ai-agents-metrics</id>
        <link href="https://motherduck.com/blog/chief-of-staff-guide-ai-agents-metrics"/>
        <updated>2026-10-15T00:00:00.000Z</updated>
        <summary type="html"><![CDATA[Kaitlyn, MotherDuck’s Chief of Staff, on why self-serve analytics with AI agents fragments your metrics, and how non-technical leaders can get everyone on one definition of metrics.]]></summary>
        <content type="html"><![CDATA[
<p><em>“Everyone is entitled to his own opinion, but not to his own facts.”</em> - Daniel Patrick Moynihan (senator, sociologist, and a person who never once had to reconcile two different NRR numbers in a board meeting)</p>
<p>Self-serve analytics finally works. Hurray! Agents plus the <a href="https://motherduck.com/product/mcp-server/">MotherDuck MCP</a> mean anyone can query the warehouse without ever having written a lick of SQL in their life. And while that’s all incredibly exciting to me and to everyone else who feels this huge shift in velocity compared to 18 months ago, it’s also… a little terrifying.</p>
<p>As Chief of Staff at MotherDuck, I own our operating plan and all the reporting and rituals related to how we’re executing against that plan. My job is to <strong>help MotherDuck understand itself</strong>, and make sure everyone is on the same page so that we can make the right decisions for the future. The problem is that <strong>self-service analytics, when left to its own devices, doesn’t tend to converge on a single view of the truth.</strong> It fragments into a dozen private versions of it, all with a slight bend towards how the end user perceives the world.</p>
<p>We are LIVING this at MotherDuck right now. Everyone here is spinning up <a href="https://motherduck.com/product/dives/">Dives</a> and <a href="https://motherduck.com/product/flights/">Flights</a>. A salesperson who has never written a <code>SELECT</code> statement in their life can open the MotherDuck MCP server and build a view of net revenue retention (NRR) joined against external demographic data across their book of accounts, <a href="https://motherduck.com/videos/ai-for-sales-marketing-teams/">without ever talking to the data team</a>. <strong>That is incredible.</strong> It’s a world that people have been dreaming about for years, and there’s a graveyard of startups from the past two decades of people who have tried and failed to make it happen.</p>
<p>I think Ian Macomber from Ramp said it really well on a <a href="https://www.youtube.com/watch?v=L5uRd44eqX4&#x26;list=PL0QYlrC86xQm83Q9deiy4euEnbw8ceu3I&#x26;index=3">recent podcast</a>: In this brave new world, <strong>the scarce resource is no longer access to the data. It's consensus.</strong></p>
<h2>Alternative facts</h2>
<p>Here's the thing about that salesperson. If they don't compute NRR the way the rest of us agreed to compute it (same grain, same account exclusions, same treatment of partner revenue) they walk into our weekly business review with a number that doesn't match mine. Best case, two people who don’t know how to read or write SQL burn twenty minutes doing forensic accounting. Worse case, their dashboard looks <em>so cool</em> that three other reps clone it, and before anyone notices, the entire revenue org is running its book off the wrong definition of retention.</p>
<p>Now multiply that by every person and every metric in the company. Terrifying.</p>
<p>In the pre-AI world, the data team was the gatekeeper. You didn't make your own dashboard, you asked Kenan to make you one, and you complained to your boss about how slow it was. But, hidden in that bottleneck was doing something we all took for granted: it meant <strong>someone was full-time responsible for being right.</strong> The data team obsessed over modeling, freshness, and lineage, and the rest of us relaxed a little, knowing there was a single throat to choke when a number was wrong (and it wasn’t ours).</p>
<p>The self-serve revolution removed that gatekeeper overnight. Everyone is feeling the velocity gain, and getting totally addicted to it. <strong>Fewer people are noticing consensus degrading.</strong> People trust the dashboard they built more than the one someone handed them… which is human and reasonable and also exactly the problem. Left alone, self-serve doesn't drift toward the truth. It fragments into everyone privately trusting their own reality.</p>
<p>To be clear: I don't think that the state we’re in is a net-bad thing, and even if I did, it’s too late to put the genie back in the bottle. The question I’ve had to reoriented myself around is: <em>how do we get all these newly agent-empowered people to land on the same version of reality?</em></p>
<p>The answer is context.</p>
<h2>What's a human actually for?</h2>
<p>I felt this problem emerging almost immediately when we started duck-fooding the early version of Dives at MotherDuck. In a pre-AI world, I’m not sure I, a non-technical person, could have owned this on my own. In a post-AI world, this is entirely possible. Here’s how we approached it.</p>
<p>I started with getting a small tiger team together to agree on definitions for our most common metrics. We bootstrapped it the lazy way: we ran a pretty basic prompt on top of the warehouse and asked it to build a “big dumb document”, basically a data dictionary reverse-engineered from what the LLM could see. It did a decent job. An agent can introspect your schema: table and column names, types, foreign-key relationships, whatever comments you were disciplined enough to leave behind. From that it reconstructs the stuff everyone already agrees on. <em>What's the canonical revenue table? What does a contraction event look like?</em> I would say the big dumb document came back about 50% right.</p>
<p>The other 50% is the hard part, and where a human needs to get involved. No amount of column-name introspection tells you all of the nuances of your business.</p>
<p>Let’s take what counts as “churn” in a usage-based revenue business as an example. Is it a canceled contract? 30 consecutive days of zero compute? But what if they come back on day 31?</p>
<p>For the complicated or controversial metrics, write down all of the nuances and complexities onto paper, and lay out the different ways you could calculate the metric depending on what you care about. Go pressure test those with one or two people who interact with the inputs to that metric every day. For churn, that was customer success (affectionately called Hatchery at MotherDuck) and sales. Get them to poke holes in your assumptions and call out things you missed.</p>
<p>You probably have decent instincts about the churn patterns in your customer base, so overlay those on your actual data to see if the patterns you care about are getting captured in this definition. For something like churn, you can even go so far as to pull up the actual list of customers who counted as “churned” in the last week or month and ask yourself whether those are indeed churned customers in the spirit of the definition. If you see someone who actually is just experiencing some seasonality and doesn’t really feel like a lost customer, great, use that to tweak your definition. Do this 2-3 times max. You could get caught in the edge cases forever, and you don’t want perfect to get in the way of good enough.</p>
<p>Use what you learn to come to the table with a clear recommendation and a sample run of the data with the new definition. People tend to give better feedback when they have something concrete to react to vs. asked about a topic generally, with no guidelines.</p>
<p>This isn't a post on how to reach exec alignment (my quick tips: be discerning about which metrics you govern centrally, take input but understand the definition will not be decided democratically, and metrics trees with owners are a genuinely useful tool for figuring out what's worth fighting over). But, <strong>it’s a call to action for you, the non-technical human, to focus your time and energy on these sorts of things, and let the LLM handle everything downstream.</strong> Turning “here's how we define NRR, at monthly grain” into correct, performant SQL is precisely the kind of work LLMs are great at. The highest-leverage thing that a human (technical or not) contributes to this process is not writing the query. It's manufacturing the consensus that the query executes against. You are responsible for the <em>what</em>. The LLM handles the <em>how</em>.</p>
<h2>Where should context live</h2>
<p>A friend I used to work with at dbt is now on the data team at an AI company where everyone internally builds agents. His team did all the beautiful analytics engineering work that dbt pioneered, modeling every metric cleanly in their BI tool. They're confident that if your agent connects there, it comes out with the right answer. I’ve heard data teams at other companies say something similar, whether it’s the BI tool, a data catalog (or whatever we’re calling the <a href="https://motherduck.com/blog/context-layer-vs-semantic-layer-ontology/">third party context layer</a> these days), or something else.</p>
<p>The problem is that most people don't connect through some intermediary. LLMs want to take the path of least resistance, which means 9 times out of 10 it’s just going to query the data warehouse directly. It’s hard to enforce making a stop along the way, especially if not all people (or agents) know that stop exists. My friend knows this, and he says it’s one of the biggest things keeping him up at night.</p>
<p>This is why I, a non-technical human, have become deeply convinced that <strong><a href="https://motherduck.com/blog/context-belongs-in-the-warehouse/">context has to live as close to the raw data as possible</a>.</strong> If your definitions sit in a modeling layer up the stack, they only protect the agents that bother to route through that layer. And in an AI-native company, you cannot enforce that routing. A context layer that can be easily bypassed isn't actually a context layer. At that point, it’s just a museum artifact.</p>
<h2>Guides!</h2>
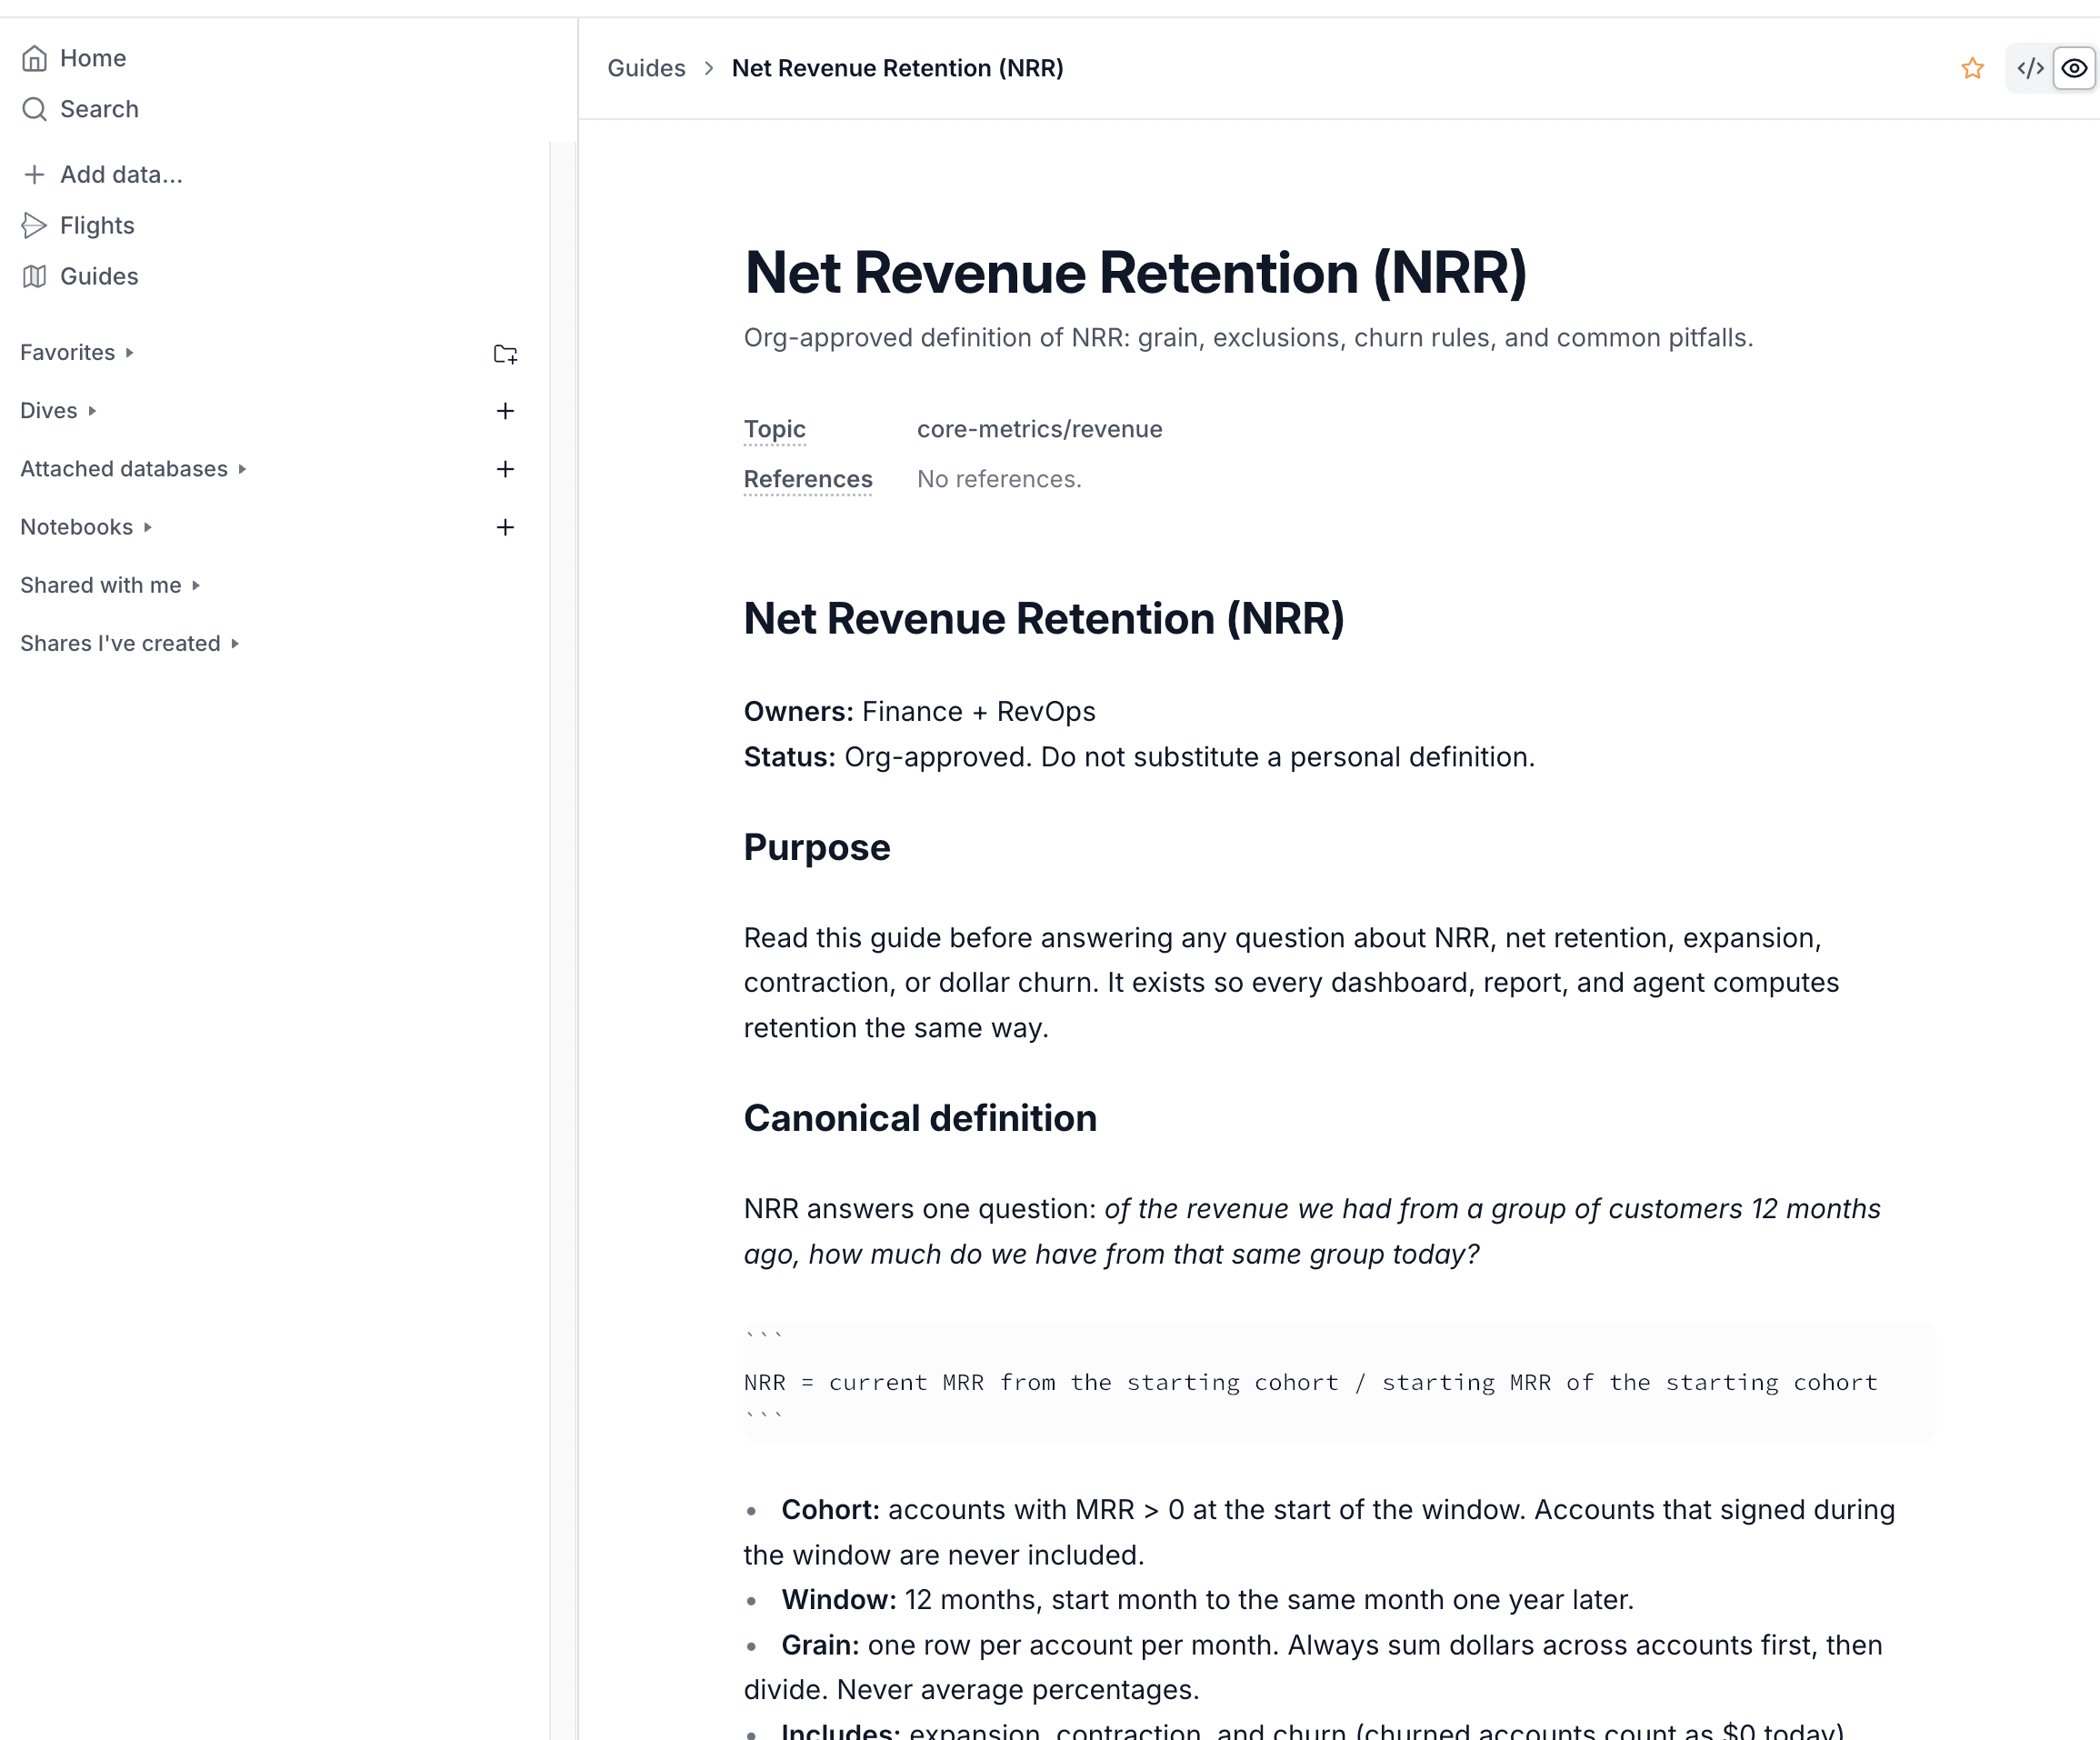
<p>All of this is why I'm SO excited about Guides. A Guide is a <a href="https://motherduck.com/docs/key-tasks/guides/">plain markdown document</a>, stored in the MotherDuck warehouse, that agents read before they write SQL. It captures everything your schema can't tell an agent on its own, like how you define a metric, which tables to join, which columns to exclude and why.</p>
<p>Some highlights that I’m especially excited about:</p>
<p><strong>It's agent-native.</strong> Guides <a href="https://motherduck.com/docs/key-tasks/guides/#how-agents-interact-with-guides">load automatically through the MotherDuck MCP</a>. On connect, the agent gets an index of guide <em>paths</em>. It sees that <code>core-metrics/revenue/revenue-retention.md</code> is the one it wants, reads that single file, and only then generates SQL. By the time it touches your data, it already knows to exclude the right accounts and compute at the right grain.</p>
<p><strong>You write it in plain markdown.</strong> Author it in the UI, dictate it from an agent chat, or <a href="https://github.com/motherduckdb/motherduck-blueprints">push it from your data repo in CI</a>. It reads like a short doc: purpose, key tables, the canonical definition, join patterns, known pitfalls. The workflow I'd recommend is what we did internally: <a href="https://motherduck.com/docs/key-tasks/guides/bootstrap-guides-with-an-ai-agent">let an agent bootstrap the V1 off your schema</a> to get something that’s 50% there, then spend your human time on the 50% that requires discernment and (dare I say it) taste.</p>
<p><strong><a href="https://motherduck.com/docs/key-tasks/guides/#manage-guide-visibility">Org-wide or personal.</a></strong> Admins publish the definitions everyone shares. A power user who wants their own spin can layer a personal Guide on top, but the org version supersedes it. You give people flexibility to define things that aren’t centrally governed (usually things that are very domain specific, or changing quickly) and enforce the most important metrics that everyone needs to have right.</p>
<p><strong>Versioned and auditable.</strong> Every save is a new version with a change comment. When a number moves next month and someone asks why, you can point at which definition was live when the query ran.</p>
<p>There's a real push-and-pull in AI-native circles about determinism versus letting an agent be free and creative. My current mental model is that you want to be deterministic about the <em>what</em> (the definition, the filters, the grain) and let the agent do its thing on the <em>how</em> (ex. whether it uses a CTE or a window function, how it orders the joins…even if you have no clue what all that means).</p>
<p><img src="https://motherduck-com-web-prod.s3.us-east-1.amazonaws.com/assets/img/Screenshot_2026_10_15_at_11_49_05_AM_3379ba082c.png" alt="Example Guide"></p>
<h2>Don’t be afraid of the fog bank</h2>
<p>Some people have described AI as a fog bank rolling in on a long stretch of highway: you used to be able to see for miles, and now you can't see more than a few feet ahead. As tempting as it is to slow down and wait for it to clear, I really don’t think that’s an option in this environment. Like I said, regardless of whether you find this new reality of self-serve analytics exciting or terrifying, you aren’t going to be able to put the genie back in the bottle. I think taking control of the context layer is one of the most high leverage things a non-technical domain expert can do right now. We’re in a moment where something that may have felt intimidating 18 months ago, is (1) totally possible for a nontechnical person to own, and (2) can actually be codified into workflows that allow everyone to function better.</p>
<p>My advice: <a href="https://motherduck.com/docs/key-tasks/guides/turn-a-session-into-a-guide">just try it</a>. You’ll be surprised at what you can accomplish with the tools we have today. And if you want a data infrastructure solution that brings this all together in one platform, check out MotherDuck! We’ve got a free trial you can sign up for <a href="https://motherduck.com/">here</a>.</p>
]]></content>
        <author>
            <name>Kaitlyn Henry</name>
        </author>
    </entry>
    <entry>
        <title type="html"><![CDATA[Data Engineering Is the Cache Invalidation Problem ft. Josh Wills]]></title>
        <id>https://motherduck.com/blog/cache-invalidation-problem-data-engineering-josh-wills</id>
        <link href="https://motherduck.com/blog/cache-invalidation-problem-data-engineering-josh-wills"/>
        <updated>2026-10-09T00:00:00.000Z</updated>
        <summary type="html"><![CDATA[Josh Wills, creator of dbt-duckdb and former head of data engineering at Slack, on why the model barely matters, why agents still write ugly and expensive data pipelines, and why data engineering is still the cache invalidation problem.]]></summary>
        <content type="html"><![CDATA[
<p>In this episode, we dive into how much models actually matter: more like a preference, like whether you use an iPhone or Android, than their capabilities. We talk about bare-metal disks when running Kubernetes, then move to agents and how data engineering becomes like being an emergency pilot in a plane, and how we automate away the boring work with no more database migrations or unit tests.</p>
<p>We go into spiritual territory, where he feels in his gut whether a pipeline will work. Then we finish with where every data engineer or software engineer eventually wants to end up, as the field is evolving so fast: on a farm with beautiful flowers and no screen. This is interview #5. I hope you enjoy it.</p>
<p>This article is structured into four parts: <strong>(1)</strong> how Kubernetes and disk abstractions are key for his work, <strong>(2)</strong> how he works with the models and agents, and how much the model actually matters, <strong>(3)</strong> what tooling he uses and how agents ease his life at work, and <strong>(4)</strong> whether data engineering is automated away with agents.</p>
<h2>Introducing the Guest: #5 Josh Wills</h2>
<p><a href="https://x.com/josh_wills">Josh Wills</a> is a software and data engineer with 25 years of experience. At Google, he worked on the ad auction system and led the analytics infrastructure behind Google+. As head of data science at Cloudera, he founded the Apache Crunch project and co-authored O'Reilly's <a href="https://www.oreilly.com/library/view/advanced-analytics-with/9781491912751/">Advanced Analytics with Spark</a>, and he went on to build and lead Slack's data engineering team. He's also the original creator of the <a href="https://github.com/duckdb/dbt-duckdb">dbt-duckdb adapter</a>.</p>
<p>Since 2024, Josh has been a Member of Technical Staff at DatologyAI, which helps teams train better models, faster and smaller. There he builds tools that automatically select the best data for training deep learning models, along with the distributed pipelines that process it at trillion-token pretraining scale. We go into more detail on what it takes to work with datasets that gigantic.</p>
<h2>DuckDB Yes, but also Kubernetes Disk Abstractions</h2>
<p>As many of you might know, Josh was the initial creator of dbt-duckdb, so I asked him if he still uses dbt and, more importantly, how much DuckDB.</p>
<p>His answer was that everyone uses it: "Everybody uses DuckDB in some capacity. I feel like anyone who knows about DuckDB uses DuckDB for something. Everyone has their own specific use case for it". He is using it less for his specific pipelines at work, as they have huge datasets, text data, not classical datasets: e.g., 30 TB is tiny. He uses Spark or Ray. He does much of the processing on text and multimodal data (time series, images, etc.), not much classical relational data in his day-to-day.</p>
<p>The use case for DuckDB he uses a lot is reading Parquet metadata that sits on S3, as the above data pipelines "throw off enormous amounts of Parquet metadata, which is still substantial but much smaller, on the order of 100 GBs". Information about runs, when a dataset was last used to train a model, how much he pays to store it in S3 for indefinite periods. He usually asks his agents to read that on his dev box on EC2, which he runs these commands on, to cut down on transfer times, just for speed.</p>
<h3>"We Lost a Whole Generation" of Data Infra People, Retired 2022, AI Pulled Him Back</h3>
<p>When talking about what has changed since he worked at Google as a staff engineer (2007–2011) and led data engineering at Slack (2015–2019), and how data engineering workloads differ today with AI, he said Snowflake is great. Still, we do <strong>not have many people anymore who know how the data is laid out on disk</strong>.</p>
<p>But not for his size of workload. Josh works with such big data that we normies can barely fathom, and that's why he uses lots of Kubernetes jobs and workloads. He likes <a href="https://github.com/apache/celeborn">Apache Celeborn</a> (Pronunciation: spelled Celeborn, pronounced "Keleborn"), which <strong>abstracts the disks</strong> (not needing to know where they physically come from), because in Kubernetes you still do that manually, as Kubernetes is not really cloud-abstracted, he says:</p>
<blockquote>
<p>Kubernetes is fantastic in that it's in theory abstracted away from an individual cloud, but in practice it's not, because where does your disk come from? If you're on AWS or GCP you can use an EBS-like service, but if you're running bare metal, that doesn't exist the same way.</p>
</blockquote>
<p>Celeborn has something called push-based shuffle write, where mapper nodes skip local disk storage, ideal for cloud-native architectures, which lets you separate storage and compute, so</p>
<blockquote>
<p>The <strong>Spark jobs don't need to worry about where their disk comes from anymore</strong>, from a shuffle perspective. There's the shuffle service, no matter how much data you're going to shuffle. You have your local disk, and then you have your shuffle service for all your other disk needs.</p>
</blockquote>
<h2>How Much Does the Model Matter to You?</h2>
<p>When asked about the models and how much they matter, Josh said for him it's like the iMessage blue bubbles vs. green bubbles. Android phones are fantastic, but he wants the blue bubbles. And Josh's prediction is that all the models will become competent, so the real question becomes:</p>
<blockquote>
<p>which one you like and enjoy hanging out with</p>
</blockquote>
<p><img src="https://motherduck-com-web-prod.s3.us-east-1.amazonaws.com/assets/img/articles/cache-invalidation-problem-data-engineering-josh-wills/images/1_josh_wills_opus5_tweet_964939e9b4.webp" alt="Josh Wills tweet: wtf did anthropic do to opus 5, this is like gpt 3.5-level stupid">
<em>Source: <a href="https://x.com/josh_wills/status/2082241682452672942">Josh's tweet</a></em></p>
<p>Above, Josh explains how he disliked the Opus 5 model, and <a href="https://x.com/josh_wills/status/2102536326558241104">continues to do so</a>. In this interview, he added that it's also the way it communicates. An interesting insight, he said, as someone who works on building models all day:</p>
<blockquote>
<p>the fact that Opus 5 is so bad, it deeply indicates to me that we literally have no idea what we're doing at all when it comes to training these models.</p>
</blockquote>
<p>The good thing: changing might be easier than ever1, and he disliked the previous 5.0 so much that he changed his workflow and switched to OpenAI. He commented that:</p>
<blockquote>
<p>with no drop in productivity, it's kind of insane.</p>
</blockquote>
<h3>How to Code with Agents These Days</h3>
<p>Next, we talked about working with agents. He jokingly came back to a <a href="https://x.com/josh_wills/status/2083290481921024222">Tweet</a> where he wants to start a reinforcement learning (RL) environments company, where he does the teaching:</p>
<p><img src="https://motherduck-com-web-prod.s3.us-east-1.amazonaws.com/assets/img/articles/cache-invalidation-problem-data-engineering-josh-wills/images/2_josh_wills_rl_environments_tweet_26688ab9da.webp" alt="Josh Wills tweet about an RL environments company teaching models to write data pipelines"></p>
<p>Josh says:</p>
<blockquote>
<p>[..] a joke that I want to start my own RL environments company where it's just me teaching the models how not to write absolutely garbage data pipelines. Because I use agents to write all of my code, with very, very few exceptions. And yet I still find myself deeply unhappy with the data pipelines it writes.</p>
</blockquote>
<h3>How to Get Fast Feedback Loops with Agents?</h3>
<p>Josh says AI wins <strong>where there's a large training model and fast responses</strong>, because if it's not in the training data, it's slow and it needs to do a lot of stuff. He says: "<em>Any sort of environment in which the models have highly reliable training data with fast feedback mechanisms, they're just going to <strong>dominate. Absolutely going to dominate</strong>. You see this with math, you see this with front-end engineering, any RL environment where there is a fast feedback mechanism.</em>"</p>
<p>And that's exactly what's missing in large-scale data pipelines today:</p>
<blockquote>
<p>What's tricky about data pipelines, at least at a large scale, is that <strong>you don't actually have that fast feedback mechanism available</strong> to you, because running a giant pipeline can take a long time and a lot of computers.</p>
</blockquote>
<p>Fast feedback loops are also what Josh was already <a href="https://youtu.be/9BXMWDXiugg?si=lhB3BnsroeU1znov">referring to almost four years</a> ago, before any of the AI hype. He liked <strong>fast feedback loops</strong>, and quoted Erik Bernhardsson:</p>
<p><img src="https://motherduck-com-web-prod.s3.us-east-1.amazonaws.com/assets/img/articles/cache-invalidation-problem-data-engineering-josh-wills/images/3_erik_bernhardsson_fast_feedback_loops_36e089923e.webp" alt="Erik Bernhardsson quote: make the feedback loops fast"></p>
<h3>Feeling the Tuples Flowing through the Pipelines, a Gut Feeling</h3>
<p>Josh, with his years of experience, has built a gut feeling:</p>
<blockquote>
<p>Through years and years of suffering and writing gigantic pipelines, I can look at a pipeline and it <strong>kind of feels like something to me</strong>. I can feel the tuples flowing through it, because I have a mental model of how this is going to go.</p>
</blockquote>
<p>He explains how SQL databases have a great <strong>fast feedback mechanism with their query explain plans</strong>. They tell you if it's a good or a bad query. But for a Spark job, it's not yet exactly that.2</p>
<p>Josh describes an aesthetic aspect of data pipelines:</p>
<blockquote>
<p>I have, weirdly, a kind of aesthetic sensibility when it comes to data pipelines. A data pipeline can be beautiful to me. It can be elegant, well designed, thoughtful. That makes me want to look, in the way other people would visit an art museum, or read math proofs because they find them beautiful.</p>
</blockquote>
<p>That's where he still sees a lot of "ugliness" in what the agents write. They were not yet beautiful when we talked a couple of weeks back. Josh said, "<em>Some of the best programmers I've worked with were musicians by training</em>". And he continues:</p>
<blockquote>
<p>One distinguished engineer at Google, his master's degree is in the violin, and he was the best coder I think I'd ever seen, because <strong>his code was just like music. It was beautiful</strong>.</p>
</blockquote>
<p>I have a similar affinity for writing text, and good writing has a musical quality to it that certain people can hear. You develop an ear for good writing after a while. It sounds like something in your head, like poetry or prose. Josh says that "This is something we have not figured out how to RL in any kind of way".</p>
<h3>The Cost Aspect, Literally Lighting Money on Fire</h3>
<p>When talking about cost, Josh says that:</p>
<blockquote>
<p>"the models might waste time on the most pedantic, stupid checks for errors that are simply not possible given my knowledge of the structure of the upstream data sources." "Literally lighting money on fire"</p>
</blockquote>
<p>He continues that the pipelines are huge and compute costs a lot. And models might write a pipeline for average-sized data, but not have the knowledge or the big training data on "gigantic pipelines": "It will work, it's correct. It's just stupidly cost inefficient".</p>
<p>He has seen this problem at companies getting rid of their data teams, as LLMs could vibe code a job in Databricks. He said it like this: "<em>You can easily vibe code a job in Databricks that costs like two hundred thousand dollars a day to run, that a competent data engineer, or at least one who supervised it, would never have written</em>."</p>
<p>And it's not the model's fault, but a function of the training data that has not investigated or run a lot of "<em>gigantic data pipelines for multiple hours across hundreds of machines</em>".</p>
<p>That's just not the way the reinforcement learning environments are structured right now:</p>
<blockquote>
<p>It's this fast feedback loop: tiny data, is it correct? Tiny front end, does it render the CSS correctly?</p>
</blockquote>
<p>Josh makes a great science analogy:</p>
<blockquote>
<p>People talk a lot about how science has the same problem. Labs, biology, physics, these are all real things where you <strong>literally have to wait for the culture to grow</strong>. <strong>Data engineering has a lightweight version of this</strong>. We are not as immediately amenable to this kind of feedback style right now.</p>
</blockquote>
<p>He found the models to be fantastic at SQL back when we held the interview. "They're really, really good," he said. But for his kind of work (the raw Ray pipeline, the Spark pipeline), <strong>there is no explain plan</strong>. You're still building the thing from scratch, as he said.</p>
<h3>The Job of 'Emergency Exception Handler'</h3>
<p>He mentions that in his job, because the models haven't learned everything yet, he is basically like a pilot who usually flies on autopilot, but <strong>in case of emergency, he is there to fix it or take over</strong>.</p>
<h2>What Is the Tooling He Uses &#x26; How Agents Ease His Life at Work</h2>
<p>As initially pointed out, he disliked Opus and switched to Codex, so now he is using Codex all the time, but he used Claude for a long time.</p>
<p>When asked how he works or reviews code, he said: mostly giving feedback, like a staff engineer does. His life as a senior technical IC has been trending towards that for a very long time, he says. He primarily gives feedback. That's his primary job. Interviewing people, reviewing design documents, and less hands-on, with very few exceptions.</p>
<p>He likes to work on high-demand, high-urgency work that forces him to create. This is back to the 'emergency exception handler':</p>
<blockquote>
<p>If there's a <strong>broken-ass data pipeline and it has to run right now</strong>, because a customer has a training job coming up and the data has to be ready for it. That's the <strong>primary value I provide</strong>.</p>
</blockquote>
<h3>What Josh Likes about Agents: No Feelings and the Caffeine Dial</h3>
<p>Josh also revealed that he likes working with agents because agents have no feelings. He can give agents feedback on demand, force things to be created, he says:</p>
<blockquote>
<p>I don't have to be very nice to the agents.</p>
</blockquote>
<p>He can just say things:</p>
<blockquote>
<p>I don't have to care about their feelings or their career development, because they're going to cease to exist when I'm done with this coding session. I can be like: this is bad and you should feel bad. Ctrl-C, you're dead, I'm going to start over with someone else.</p>
</blockquote>
<p>As someone who calls himself "a fairly mediocre manager, because I don't generally like caring about these things", this works well for him 3.</p>
<p>The other interesting thing he says:</p>
<blockquote>
<p><strong>I can dial up and down the work on demand</strong> as I see fit. If I'm in a moment where I need five agents going, I can do it. If it gets to be too much, I dial it back. In the same way that I try to maintain a certain level of caffeine at any given moment of the day, I can maintain a certain pace to match my energy, to match what I'm up to right now. Am I super excited, am I kind of bored? That's a virtue of this new world that was not true before.</p>
</blockquote>
<p>It's like the caffeine dose.</p>
<h3>No More Unit Tests!</h3>
<p>He also likes to <strong>automate most of the boring work</strong>. Who wants to do one more database migration? Or fix "flaky unit tests"? He likes to do the higher-level strategic stuff, which is how people end up <strong>becoming investors or product managers</strong>, he says.</p>
<p>Even more so:</p>
<blockquote>
<p>I have an agent whose whole job is just to watch for flaky tests and fix them. That's it, that's all it does. Database migrations? Absolutely not. I have an agent that does database migrations. I have automated away the shittiest, lowest-value, most unpleasant parts of my life, and I am here for it.</p>
</blockquote>
<p>For him, that's a massive quality increase. And he can focus very hard on things he likes, and where the leverage is high, to <strong>make hard decisions</strong>.</p>
<h3>Decisions Made Are What Is Left, and Communicating Why Is Key</h3>
<p>In regard to code review, one thing he is trying to be militant about in the world where agents do everything is:</p>
<blockquote>
<p>For every project, I'm <strong>focusing really hard on the decisions I am making</strong>.</p>
</blockquote>
<p>He mentions a concrete example from Datology where he's building an index over datasets to figure out which parts of a dataset are reusable, wholesale or partially, someplace else:</p>
<ul>
<li>Option A: query the metadata catalog at read time and figure out the useful assets.</li>
<li>Option B: write an explicit index up front: "this asset exists in this index and it is usable for this purpose"</li>
</ul>
<p>He says:</p>
<blockquote>
<p>Either choice is valid, there are pros and cons. I'm making an explicit trade-off here, and those are the decisions I need to communicate. The details of how the index works are much less important.</p>
</blockquote>
<p>He makes a great point that:</p>
<blockquote>
<p><strong>It's really the decisions we need to communicate</strong>. The decisions build the shared understanding, the choices we make, the trade-offs. That's still the meat of engineering work.</p>
</blockquote>
<p>I also think this very thing is the most important, and it can turn into a bad spiral if you are not careful, as someone vented in <a href="https://x.com/v0xium/status/2101526107128529120">this tweet</a>. Plus, in my opinion, agents <strong>force you to focus on architecture, and that's why they're handier for seniors</strong>.</p>
<h2>Is Data Engineering Automated Away with Agents?</h2>
<p>Josh says clearly that data engineering is <em>not</em> going away. For the same reason it hasn't gone away for so long: the fundamental problems won't go away. We're still solving the problem of <strong>materializing views and caching</strong>!</p>
<blockquote>
<p>I don't see data engineering going away in any way, shape or form, even in this world. Aside from the fact that the RL environment problem makes it unusually difficult for the agents to be good at running these very long pipelines, <strong>the fundamental problem of data engineering is the same problem it's been my whole career, and 25 years before I started working</strong>. It's the materialized view problem.</p>
</blockquote>
<p>The questions are: "What data should I pre-process and create now to make queries faster later on, and what stuff is not worth doing, what should I just do in the moment?" These are the fundamental problems.</p>
<p>He says it will be a "problem for the superintelligence", because:</p>
<blockquote>
<p>It's not a fixed thing, it's <strong>going to continuously move</strong>, and the right trade-off is going to change all the time.</p>
</blockquote>
<p>Josh says, aside from reinforcement learning:</p>
<blockquote>
<p>It's the <strong>two hard problems in computer science, right? Cache invalidation and naming things</strong>. And the agents still suck at them because they're legit hard.</p>
</blockquote>
<p>"Data engineering is fundamentally the cache invalidation problem", he continues, "just <strong>done in a batch-processing context</strong>".</p>
<h3>Humility and Burnout</h3>
<p>Lastly, we talked about humility and how not to get burned out.</p>
<p>It helps to stay humble, as he says he is very good at it, telling his family:</p>
<blockquote>
<p>I am simultaneously an idiot and also among the best in the world at what I do.</p>
</blockquote>
<p>I say that we all probably feel some kind of ambivalence, as the AI can do part of our job and we feel unneeded. That's where humility helps us. Josh also adds that he is kind of grateful that he can still be at the keyboard and program. It's "tremendous fun" for him, and he loves to be here for this moment in time.</p>
<p>I asked if he does not get <strong>burned out</strong> when agents do not generate code the way he does it. Or does he split into "code I don't mind" vs "code I want perfect"? He says that his advantage is having done it for a "really, really long time":</p>
<blockquote>
<p>Old me tolerates things that younger me would never, ever, ever tolerate at all. I am used to cycles of feedback with somewhat "stubborn" people.</p>
</blockquote>
<p>He said that once, the agent couldn't find a problem he was telling it about: "And I could not, for the life of me, get the agent to write the pipeline in the way it would do this". He was telling the agent "you cannot use caching this way", and it couldn't help itself. He had to take over.</p>
<p>This again is the perfect example of the exception handling situation. It's "kind of my job these days," Josh says, to "identify these situations where, for whatever reason, the model literally isn't capable of doing what I am asking". But he says that the models are getting better every day:</p>
<blockquote>
<p>The reality is, I don't encounter that many of these problems anymore.</p>
</blockquote>
<h2>Conclusion</h2>
<p>One main takeaway from this conversation is that data engineering is the cache invalidation problem, just done in a batch-processing context. That's important: when done right, agents dominate because of a fast feedback loop, like SQL with its explain plans or math. Gigantic Spark and Ray pipelines that run for hours across hundreds of machines don't have that cycle yet. That's why Josh still ends up as the emergency exception handler, and why others can vibe code a Databricks job that costs $200k a day.</p>
<p>What's interesting is how little the model itself matters to him. It's more about design and feel, e.g., blue bubbles vs. green bubbles: pick the one you enjoy hanging out with, switch when you don't like it anymore, or hand off the flaky tests and database migrations to an agent. What's left is what was always the hard part of data engineering: making the decisions and communicating the trade-offs.</p>
<p>We got a bit spiritual, with Josh feeling the tuples flow through a pipeline, and ended where many of us do as the field moves this fast: dreaming of a farm with beautiful flowers and no screen . Josh admits he periodically flirts with it too: "Maybe I'm just going to retire again and just go play chess. I'm not made of stone".</p>
<p>I hope you enjoyed this episode of the interview series. Check out the others, starting with <a href="https://motherduck.com/blog/specs-over-vibes-consistent-ai-results/">Mark Freeman</a>, <a href="https://motherduck.com/blog/cost-as-tokens-substrait-llm-chris-riccomini/">Chris Riccomini</a>, <a href="https://motherduck.com/blog/vibe-coding-dangerous-agentic-engineering-wes-mckinney/">Wes McKinney</a> and <a href="https://motherduck.com/blog/figma-for-agents-airflow-creator-maxime-beauchemin/">Maxime Beauchemin</a>.</p>
<hr>
<p>If you read this far and liked it, also check out the talk with Mehdi about the "<a href="https://motherduck.com/videos/duckdb-dbt-accelerating-the-developer-experience-with-local-power/">Coupling Problem in Data Engineering</a>" or check Josh's recent talk <a href="https://www.youtube.com/watch?v=zLfAkk91LIg">Josh Wills on the End of Coding</a> at Pebblebed.</p>
<p>He also has no shame about hopping back when the model changes. With the latest model, he went back to Opus 5.5.
The same impression someone had on Reddit: "agents are absolutely dogshit AI at optimizing Spark jobs (or any sort of high complexity pipeline). They are laughably bad, in my experience."
I haven't worked under him, but I'm sure that he is a great manager nonetheless!</p>
]]></content>
        <author>
            <name>Simon Späti</name>
        </author>
    </entry>
    <entry>
        <title type="html"><![CDATA[5 Jev use cases for analytics, with real queries and datasets]]></title>
        <id>https://motherduck.com/blog/jev-analytics-use-cases</id>
        <link href="https://motherduck.com/blog/jev-analytics-use-cases"/>
        <updated>2026-10-06T00:00:00.000Z</updated>
        <summary type="html"><![CDATA[Five prompt_jev() use cases on real data, with SQL you can rerun: AI agent traces, Hacker News sentiment, sales calls, cloud job postings and a regex replacement.]]></summary>
        <content type="html"><![CDATA[
<p>Classifying text 30 times faster than gpt-5-nano, for about 1% of a frontier model's bill? It sounds crazy, but that's what we showed in the <a href="https://motherduck.com/blog/jev-for-analytics/">first post about Jev for analytics</a>: 100,000 complaints classified in 82 seconds.</p>
<p>Jev is a new type of decision model. It picks its answer from a closed list you define (yes or no, a label, a score) and returns a typed column with a confidence, fast enough to run on every row. On MotherDuck, you call it directly from SQL with the <code>prompt_jev()</code> function.</p>
<p>In this post, I'll go through 5 practical use cases on real datasets, with real results and shares you can attach to play around yourself.</p>
<h2>1. AI agent logs: which turns worked, and which took the long way?</h2>
<p>If you run an agent, your trace logs already say what happened: every model step, tool call, token and dollar. What they don't say is whether the turn did what the user asked, or whether it took the long way to get there. Making that kind of judgment call is where <code>prompt_jev()</code> shines.</p>
<p><a href="https://motherduck.com/try">motherduck.com/try</a> lets anyone try MotherDuck by chatting with an agent that queries data, runs Flights and builds Dives through the MotherDuck MCP server. Every turn emits OpenTelemetry spans and writes them into a MotherDuck table.</p>
<p>Open a turn and you get its full history, step by step, with the judge's scores on top:</p>
<p>We run a daily pipeline (<a href="https://motherduck.com/docs/concepts/flights/">Flight</a>) which grades every production turn with a handful of questions, in SQL, next to the spans:</p>
<p>| question | asked on | Jev returns |
|---|---|---|
| <code>completed</code>: did the agent do what the visitor asked? | every turn | score: fails, partially, fully |
| <code>failure_mode</code>: why did it fall short? | turns that scored below 1.5 | choice: budget exhausted, tool or SQL error, wrong answer, ... |
| <code>error_cause</code>: what broke this tool call? | each failed tool call | choice: model wrote invalid SQL or Python, wrong guess about the data, platform error, tool bug |
| <code>efficiency</code>: how many tool calls were unnecessary? | turns with tool calls | score: many, a few, none wasted |
| <code>main_waste</code>: where did the waste come from? | turns that scored below 1.2 | choice: repeated failure, redundant read, polling, unneeded exploration, tool gap |</p>
<p><code>efficiency</code> is the tricky one. Some calls look useless but are required by the product (reading a guide before using its tools, for example), so the instructions list them as never waste. Jev reads the request, the timeline of what the model wrote and called, and the start of the final answer:</p>
<pre><code class="language-sql">prompt_jev(
  'USER REQUEST: ' || left(request, 1500) || chr(10) ||
  'TIMELINE (what the model wrote and the tool calls it made, in order):' || chr(10) || left(timeline, 8000) || chr(10) ||
  'FINAL ANSWER (start): ' || left(coalesce(answer, ''), 1200),
  questions := {
    efficiency: {
      type: 'score',
      instructions: 'How many tool calls in the TIMELINE were unnecessary to answer the USER REQUEST?
        These are required by the product and never waste:
        - reading each guide once before first using its tools
        - view_dive right after save_dive
        - one wait_for_flight_run after each run_flight
        A failed call followed by one corrected retry is not waste.',
      criteria: ['many wasted (4 or more)', 'a few wasted (1 to 3)', 'none wasted']
    }
  }
)
</code></pre>
<p>Two interesting design choices:</p>
<ul>
<li>A cheap score on every turn, and the "why" questions only on the turns that score low. That keeps the cost down.</li>
<li>Facts and judgments never mix: exact counts (repeated calls, extra waits) come from plain SQL on the spans. Jev only answers what needs judgment.</li>
</ul>
<p>The same <code>prompt_jev()</code> judge grades our eval runs, where every case has an expected behavior. On the latest run, with 12 cases per model:</p>
<p>| model | cases passed | judge score | cost per turn |
|---|---:|---:|---:|
| Claude Opus 5.5 | 10 of 12 | 0.90 | $0.21 |
| GPT-6 Luna | 12 of 12 | 0.88 | $0.005 |
| Claude Sonnet 5.5 | 12 of 12 | 0.87 | $0.12 |
| GPT-5.6 Luna | 9 of 12 | 0.86 | $0.011 |</p>
<p>12 cases per model is still small, so treat this as a reason to run a bigger eval before switching models ;) But that's the decision table you want: quality next to cost, graded the same way every time, in the same database as the traces.</p>
<h2>2. Social listening: what does Hacker News think of each AI lab?</h2>
<p>Sentiment analysis is another big use case for text. It's hard to get right because people say the same thing in a hundred ways (hello, sarcasm). With Jev, you ask a simple question, "is this comment negative about X?", and get a clean classification back.</p>
<p>Tech adds its own problem: a lot of product names are ambiguous. "Claude" is also Claude Shannon, and "Gemini" is also a zodiac sign, an internet protocol, a NASA program and a crypto exchange. Good news: a prompt solves this one too.</p>
<p>Let's take Hacker News. MotherDuck hosts all of it in a share, refreshed daily: about 50M stories and comments since 2006. Attach it and you can rerun everything below:</p>
<pre><code class="language-sql">ATTACH 'md:_share/hacker_news/daa0cc99-d20c-4f5c-abd5-f7b22a1a1da9' AS hacker_news;
</code></pre>
<p>I looked at four AI labs: OpenAI (ChatGPT and the GPT models), Anthropic (Claude), Google (Gemini, formerly Bard) and DeepSeek.</p>
<p>The first step is the one a regex would do: find every item that names one of them, with patterns like <code>\b(anthropic|claude)\b</code>. That's 488,483 mentions since 2019. Too many to classify for a blog post, so I took a stratified random sample: up to 1,000 mentions per lab per quarter, 65,635 in total, each weighted back to its quarter's full count. Every percentage below is weighted.</p>
<p>Then the prompt handles the name confusion. The date goes into the input, because Google's Gemini and Bard chatbots and Anthropic's Claude models didn't exist before 2023:</p>
<pre><code class="language-sql">-- input = 'DATE: 2020-06' || chr(10) || 'NAMED PRODUCT: Google Gemini (formerly Bard)' || chr(10) || 'TEXT: ' || comment
SELECT id, lab,
       prompt_jev(input,
         'Does the TEXT use that name to mean the NAMED PRODUCT, the AI company or its AI models or chatbot (even if only in passing)? Use the DATE: Google''s Gemini and Bard chatbots and Anthropic''s Claude models did not exist before 2023. Answer no when the name means something else, such as the Gemini internet protocol, the NASA Gemini program or the zodiac sign, Claude Shannon or another person named Claude, the anthropic principle, a bard as in a poet, or GPT disk partitions.') AS refers
FROM mentions;
</code></pre>
<p>So how often was the regex wrong? Here's the share of regex matches that Jev says are about something else (<code>refers</code> below 0.5):</p>
<p>| lab | regex matches 2019-22 | about something else | regex matches 2023-26 | about something else |
|---|---:|---:|---:|---:|
| OpenAI | 22,623 | 2.0% | 261,266 | 1.1% |
| Anthropic | 795 | 89% | 144,131 | 0.8% |
| Google | 3,085 | 76% | 40,788 | 3.6% |
| DeepSeek | (didn't exist yet) | | 15,795 | 1.0% |</p>
<p>So before 2023, 89% of the HN items matching <code>claude</code> or <code>anthropic</code> weren't about the AI lab at all, mostly Claude Shannon and the anthropic principle. Once the Claude models shipped, that dropped to 0.8%. Gemini is the messiest one: still 3.6% wrong since 2023, because the Gemini protocol, the NASA program and the crypto exchange keep showing up. Yes, that's a lot of Geminis out there.</p>
<p>The cool thing is that we can ask <strong>4 questions in one call per comment</strong>: the name check above, whether the comment is really about the lab, whether it's negative, and what it's about. The instructions of <code>prompt_jev()</code> must be constants, so the lab goes into the input:</p>
<pre><code class="language-sql">SELECT id, lab,
       prompt_jev(input, questions := {
         refers:   {type: 'noul', instructions: '...the name check above...'},
         relevant: {type: 'noul', instructions: 'Is the TEXT about the NAMED PRODUCT itself (the AI company, its models or its assistant), rather than only mentioning it in passing?'},
         negative: {type: 'noul', instructions: 'Does the author express a negative experience with, or a negative opinion of, the NAMED PRODUCT?'},
         topic:    {type: 'choice', instructions: 'What aspect of the NAMED PRODUCT is the TEXT mainly about?',
                    criteria: ['answer quality and hallucinations', 'coding and developer tools', 'pricing and usage limits', ..., 'not about the product']}
       }) AS r
FROM mentions;
</code></pre>
<p>Each comment goes through the four questions, and the answers decide where it ends up:</p>
<p>| comment (trimmed) | lab | r.refers | r.relevant | r.negative | r.topic.choice | counted as |
|---|---|---:|---:|---:|---|---|
| "Crypto exchange Gemini reveals lower revenue and wider loss in US IPO filing" | Google | 0.06 | 0.11 | 0.14 | not about the product | dropped: wrong Gemini |
| "Earthquake Scatter Plot Santorini (done with some help from ChatGPT)" | OpenAI | 0.94 | 0.11 | 0.07 | coding and developer tools | dropped: only in passing |
| "Tested out Gemini-2 Flash [...] It still hallucinates like crazy compared to GPT-4o." | Google | 0.97 | 0.97 | 0.97 | answer quality and hallucinations | negative |
| "A nice thing about Deepseek is that it is so cheap to run." | DeepSeek | 0.94 | 0.91 | 0.04 | pricing and usage limits | not negative |</p>
<p>Jev gives us a confidence score, so we can filter on it to make the output more reliable. For instance, "clearly negative" means <code>r.negative >= 0.8</code>, counted only on comments that are really about the lab (<code>refers >= 0.5</code>, <code>relevant >= 0.8</code>, and a topic other than "not about the product").</p>
<p>The usual caveats apply. Hacker News is a loud, developer-heavy crowd where coding tools loom large, so use your human judgment: don't read this as market share :)</p>
<p>Here's the full dive, also available on the <a href="https://motherduck.com/dive-gallery/dives/what-does-hacker-news-think-of-each-ai-lab">dive gallery</a>.</p>
<p>The sample and the Jev labels are in a public share if you want to run your own queries:</p>
<pre><code class="language-sql">ATTACH 'md:_share/hn_ai_labs_public/3b78bda2-5bf1-4e0f-9e4b-f4ecb168405b' AS hn_ai_labs;
</code></pre>
<h2>3. Sales calls: which conversations match the use cases we serve?</h2>
<p>It's never been easier to record a meeting and get the transcript: tons of tools do it natively. At MotherDuck, I use it to understand what our customers ask for and which walls they hit in their developer experience and onboarding.</p>
<p>For the demo here, though, I'll take a made-up sales case.</p>
<p>Typically, the CRM knows the account size and the contact's title. The call transcript knows what they're trying to do. Joining the two is where lead scoring gets interesting (and that is how sales decides which leads to call first).</p>
<p>Say <code>sales_calls</code> has <code>call_id</code>, <code>account_id</code> and <code>transcript</code>, and <code>accounts</code> holds your firmographic enrichment. Ask a narrow yes/no question about a documented product fit, for example whether the prospect needs to analyze lots of customer conversations or reviews. Then use the answer as one signal in a review queue:</p>
<pre><code class="language-sql">-- Illustrative schema and product-fit question.
WITH calls AS (
  SELECT call_id, account_id,
         prompt_jev(transcript,
           'Does the prospect describe a need to analyze many customer conversations or reviews?')
           AS text_analytics_fit
  FROM sales_calls
)
SELECT c.call_id, a.segment, a.contact_role, c.text_analytics_fit
FROM calls c
JOIN accounts a USING (account_id)
WHERE c.text_analytics_fit >= 0.8;
</code></pre>
<p>A sample of the shortlist (illustrative):</p>
<p>| call_id | segment | contact_role | transcript snippet | text_analytics_fit |
|---|---|---|---|---:|
| 4812 | mid-market | Head of Data | "we have 2M support chats a year and nobody reads them" | 0.94 |
| 4830 | enterprise | Analytics Engineer | "our NPS comments sit in a varchar column in Snowflake" | 0.88 |</p>
<p>Again, treat the output as a shortlist for a human to check. A high score doesn't make anyone a "good lead". If title or seniority matters, use the CRM field you already have instead of asking a model to guess it from the transcript. And if your product covers several use cases, ask one well-defined question per use case and validate the thresholds on labelled calls.</p>
<h2>4. Job postings: which cloud does each market actually run on?</h2>
<p>Which cloud provider is the best?</p>
<p>OK, wrong question. What I actually want to know is which cloud provider wins, and where.</p>
<p>Job postings are a decent proxy: a company hiring Azure data engineers is betting on Azure for the next few years. Five years ago, I wrote a <a href="https://medium.com/datadriveninvestor/what-are-the-most-requested-technical-skills-in-the-data-job-market-insights-from-35k-datajobs-ads-d8642555f89e">blog</a> about the most requested skills in 35k data job postings I scraped. Parsing them was hard work: I had to train a small model just to classify a few things in each posting.</p>
<p>The catch is that titles don't say which cloud, and keyword counts lie. Plenty of postings list "AWS, Azure or GCP" as a nice-to-have, and "AWS is a plus" doesn't mean the stack runs on AWS. So instead of counting keywords, I asked Jev one question per posting.</p>
<p>The data is 650k data job postings that mention at least one cloud. Most are Google Jobs postings for 21 European countries and the US, from <a href="https://datanerd.tech">Luke Barousse's Data Nerds</a> dataset, plus 2025 LinkedIn postings for eight cities from my colleague Dumky's <a href="https://motherduck.com/docs/getting-started/sample-data-queries/job-postings/"><code>data_jobs_2025</code> sample dataset</a>. To keep tokens low, I didn't send the full description: the input is the job title plus only the sentences that name a cloud, about 750 characters instead of 4,200.</p>
<pre><code class="language-sql">SELECT source, job_id, country_code,
       prompt_jev(snippet,
         'Which cloud platform is this data job''s stack primarily built on?',
         choice := ['aws', 'azure', 'gcp', 'ovhcloud', 'scaleway', 'ionos', 'stackit',
                    'hetzner', 'open telekom cloud', 'oracle cloud', 'ibm cloud',
                    'alibaba cloud', 'multi-cloud, no clear primary',
                    'cloud only mentioned in passing']) AS r
FROM jev_candidates;
</code></pre>
<p>Watch the last two labels. They're the escape hatches: without them, Jev is forced to pick a cloud even when the posting doesn't really have one.</p>
<p>| title | excerpt sent to Jev | r.choice | confidence |
|---|---|---|---:|
| Data Engineer (DE) | "Du verwaltest und optimierst Datenpipelines in MS Azure Data Factory ... Datenmodelle ... in Synapse Analytics" | azure | 1.00 |
| AI Data Engineer (DE) | "General knowledge of AWS cloud services like AWS Batch, ECS Fargate, S3, RDS" | aws | 1.00 |
| Alternance - Data Engineer (FR) | "Google Cloud (BigQuery, Cloud Storage, ...)" | gcp | 1.00 |
| Sr Data Engineer (US) | "Leverage cloud platforms like AWS, GCP, or Azure to build and manage data solutions" | multi-cloud, no clear primary | 0.95 |
| Senior Data Engineer (US) | "AWS cloud experience is a plus" | cloud only mentioned in passing | 0.50 |
| Data Scientist (US) | "Cloud Certification (AWS/Azure preferred)" | multi-cloud, no clear primary | 0.57 |</p>
<p>Also cool: I didn't translate anything first. The question is in English, and the postings are in German, French, Italian and more (welcome to Europe!).</p>
<p>For the map, I only count a posting when all of these are true:</p>
<ul>
<li>it wasn't posted by a cloud vendor (AWS hiring for AWS says nothing about the market)</li>
<li>it names a single cloud</li>
<li>Jev picked a real cloud, not an escape hatch, with a confidence of at least 0.8</li>
</ul>
<pre><code class="language-sql">SELECT country_code, r.choice AS cloud, count(*) AS postings
FROM classified
WHERE posted_by_provider IS NULL          -- drop postings by the cloud vendors
  AND n_clouds_mentioned = 1              -- one cloud named in the posting
  AND r.confidence >= 0.8
  AND r.choice NOT IN ('multi-cloud, no clear primary', 'cloud only mentioned in passing')
GROUP BY ALL;
</code></pre>
<p>Of 396k postings from 2024-25, 213k survive these filters. And the answer: Europe runs on Azure, which leads in 18 of 21 countries. The US is split: Azure leads more states (25 against 22 for AWS), but the AWS states carry three times more postings.</p>
<p>Play with it yourself: switch between Europe and the US, focus on a single cloud, and hover any country or state for the full split.</p>
<p>The full Dive is also on the <a href="https://motherduck.com/dive-gallery/dives/cloud-is-regional-which-cloud-do-data-job-ads-ask-for">dive gallery</a>. The aggregates behind the map are public too:</p>
<pre><code class="language-sql">ATTACH 'md:_share/cloud_regionality_public/10d8fd77-a5f7-42e5-95d5-6cd999bf8535' AS cloud_regionality;
</code></pre>
<h2>5. Skip the hand-written parser: is this job remote?</h2>
<p>This one is more technical, but it pays off in maintenance and speed. To turn a text column into a category, you write a parser. Usually that's a <code>CASE WHEN</code> (or worse, a custom UDF) with a few regexes that someone wrote once and keeps patching.</p>
<p>So let's take a sample of the job postings above and ask: is the job remote, hybrid, on-site, or doesn't the posting say?</p>
<p>You can follow along by attaching this database:</p>
<pre><code class="language-sql">ATTACH 'md:_share/jev_use_cases/6a306d41-76e6-4cca-828b-84f412a28009' AS jev_use_cases;
</code></pre>
<p>The classic regex version typically looks like this:</p>
<pre><code class="language-sql">CASE
  WHEN description ILIKE '%hybrid%' THEN 'hybrid'
  WHEN description ILIKE '%remote%' THEN 'remote'
  WHEN regexp_matches(description, '(?i)\bon-?site\b|\bin[- ]office\b') THEN 'on-site'
  ELSE 'not stated'
END
</code></pre>
<p>Then you hit the obvious false positives, like "remote sensing" or "hybrid cloud". You keep patching and end up with something that kind of works, but is hard to maintain (my version two has 22 hand-tuned alternatives and exclusion lists).</p>
<p>The Jev version is one question, with the definitions written down:</p>
<pre><code class="language-sql">SELECT job_id,
       prompt_jev('TITLE: ' || title || chr(10) || 'LOCATION: ' || location || chr(10) ||
                  'DESCRIPTION: ' || left(description, 8000),
         'Where does this job expect the person to work?',
         choice := [
           {label: 'remote',     description: 'Fully remote: work from home or anywhere all the time, possibly limited to a country or time zone'},
           {label: 'hybrid',     description: 'A mix of home and office: some days a week in the office, or remote work, home office or télétravail offered as a regular option or benefit'},
           {label: 'on-site',    description: 'The posting says the work is at the office, a site or a client site, with no regular remote work'},
           {label: 'not stated', description: 'The posting does not say whether the work is remote, hybrid or in the office'}
         ]) AS work_mode
FROM jev_use_cases.job_postings_sample;
</code></pre>
<p>How does it compare with the regex and a standard LLM call (<code>prompt()</code>)? On the same 2,000 postings:</p>
<p>| approach | time on 2,000 postings | what you have to maintain |
|---|---:|---|
| regex, version two | 0.2 s | 22 hand-tuned alternatives and exclusion lists |
| <code>prompt()</code> with an ENUM return type | 37.0 s | the prompt |
| <code>prompt_jev()</code> | 1.7 s | the label definitions |</p>
<p><code>prompt_jev()</code> is again about 20 times faster than the LLM call, and asking the LLM for JSON didn't help much (31.1 s, before the cleanup). The regex is still the fastest, but Jev is fast enough to replace it without the fragility, and it skips the slow LLM detour.</p>
<p>So should you use Jev everywhere you have text?</p>
<p>Well, a regex is still nice for structure: things that have a format (IDs, emails, URLs, dates, a known product code). Use Jev for meaning: is this about X, is it negative, which one is the main one. And use both together: a cheap <code>ILIKE</code> or regex to build the shortlist, then <code>prompt_jev()</code> to decide.</p>
<h2>A good first experiment</h2>
<p>Pick a text column you already have and a business question you couldn't answer from it (or only the hard way). Write down the answers you'd accept. Label a small sample by hand (or with <code>prompt()</code> on MotherDuck or with a standard LLM call), run <code>prompt_jev()</code> on it, and look at both the winners and the uncertain rows. Once the question holds up, materialize the result so your dashboard doesn't pay to classify the same text twice.</p>
<p>Keep the limits in mind: Jev gives you a bounded choice, a yes/no probability or an ordered score. It won't write a summary or invent a new category. Test your confidence threshold on your own data, and check your data-handling rules before sending customer text to an AI function. The <a href="https://motherduck.com/docs/key-tasks/ai-and-motherduck/classify-text-with-prompt-jev/">MotherDuck guide</a> and the <a href="https://motherduck.com/docs/sql-reference/motherduck-sql-reference/ai-functions/prompt-jev/"><code>prompt_jev()</code> reference</a> cover the syntax and availability.</p>
<p>For now, the duck-sized test is simple: what question is hiding in a text column you already own?</p>
]]></content>
        <author>
            <name>Mehdi Ouazza</name>
        </author>
    </entry>
    <entry>
        <title type="html"><![CDATA[Build It Yourself: What You'll Make at the Data Outpost Workshops]]></title>
        <id>https://motherduck.com/blog/data-outpost-2026-workshops</id>
        <link href="https://motherduck.com/blog/data-outpost-2026-workshops"/>
        <updated>2026-10-05T00:00:00.000Z</updated>
        <summary type="html"><![CDATA[Data Outpost kicks off on November 4, 2026 in San Francisco with 11 hands-on workshops from MotherDuck, Vercel, Sigma, Prefect, Estuary, Airbyte, Reducto, Braintrust, and Together AI. Here's what you'll build in each one: your own agents, the data pipelines they need, and the skills to run them in production.]]></summary>
        <content type="html"><![CDATA[
<p><img src="https://motherduck-com-web-prod.s3.us-east-1.amazonaws.com/assets/img/articles/data-outpost-2026-agenda/data_outpost_hero_e4e9be7ab8.png" alt="Data Outpost: 2 days, November 4-5, 2026, San Francisco"></p>
<p>Reading about agents is fun. Building one with your own hands is better! On <strong>Wednesday, November 4</strong>, <a href="https://www.dataoutpost.ai">Data Outpost</a> kicks off with a full day of <a href="https://www.dataoutpost.ai/#agenda-nov-4">hands-on workshops</a> in San Francisco. You'll build agents, wire up the data they need, and learn what it takes to run them in production. Bring a laptop, because most of these sessions end with something running on it.</p>
<p>There are 11 workshops across 3 time slots (9:15 AM, 11:00 AM, and 2:30 PM), and they run in parallel, so you'll pick 1 per slot. They're at Convene 100 Stockton, the same venue as the main day of talks and panels on <strong>Thursday, November 5</strong>. (Here's <a href="https://motherduck.com/blog/data-outpost-2026-agenda/">what you'll learn on day 2</a>.)</p>
<p><strong>Sound good? <a href="https://tickets.dataoutpost.ai/data-outpost/rsvp/register?e=data-outpost">Register for Data Outpost here!</a> Need help choosing? Read on!</strong></p>
<p>Here's what you'll build in each workshop, plus my take on each one.</p>
<h2>Build Your Own Agent</h2>
<p>4 workshops where you walk out with an agent of your own: one you can message on Slack, one that builds a whole data stack, one that lives in your BI tool, and an MCP server that reserves you a gift.</p>
<h3>Build a Data Agent with eve</h3>
<p>Colton will walk through the fundamentals of the <a href="https://eve.dev">eve framework</a> and some popular use cases, then help you build your own personal data analytics agent. You'll connect it to the context sources in your enterprise (such as MotherDuck) and talk to it wherever you already work: Slack, iMessage, or embedded in your website.</p>
<blockquote>
<p>My take: I love that this is open source! They have thought through the tough problems in the space: durable execution, sandboxing, and more.</p>
</blockquote>
<h3>The Next Data Stack Has No UI: Building End-to-End Analytics with Agents and Ducks</h3>
<p>What if your next data platform is a conversation instead of a pile of dashboards and config screens? You bring an agent (Claude Code or similar), Mehdi will bring some raw data and coach you through the process. You'll point your agent at those files with DuckDB, then let it profile the data, design a schema, ingest it, write the transformations (complete with data quality checks), and publish to MotherDuck.</p>
<p>Along the way you'll break the data on purpose to see how to build a resilient system, and talk through where the DuckDB ecosystem shines for agents and where it falls apart: state, context, reproducibility, permissions, and observability. You'll leave with a working end-to-end stack, a repo of prompts and guardrails, and the experience of building a modern platform from scratch.</p>
<blockquote>
<p>My take: If you use AI to speed up just 1 small part of a process, you don't see much benefit. This is all about applying AI to the entire process end to end, and it will speed things up dramatically. In my experience, finding and ingesting data takes the longest, and this will help!</p>
</blockquote>
<h3>See it live: a hands-on Sigma + MotherDuck lab</h3>
<p><strong>Workshop:</strong> Zalak Trivedi (Product Leader, Sigma) and Tyler Johnson (RVP, Solutions Manager, Sigma) · 2:30 to 4:30 PM. <a href="https://www.dataoutpost.ai/#see-it-live-a-hands-on-sigma-motherduck-lab">On the agenda</a></p>
<p>Most BI demos show you a finished dashboard. In this lab you build one, with Sigma connected directly to a live MotherDuck warehouse. The first half is classic analysis: drag fields into tables and build a pivot table from scratch.</p>
<p>In the second half you'll put Sigma's AI to work. Ask Sigma Assistant questions in plain language, then build your own Sigma agent and watch it take action on your behalf.</p>
<p>You'll leave with a working workbook connected to MotherDuck and a clear sense of what your team could build in an afternoon.</p>
<blockquote>
<p>My take: My favorite part of this is the "take action" piece. That's where the benefits of agents really compound.</p>
</blockquote>
<h3>Build an MCP Server and Unwrap a Mystery Gift with FastMCP and Horizon</h3>
<p><strong>Workshop:</strong> Edward Park (Engineering Director, Prefect) and Radhika Gulati (Product Marketer, Prefect) · 2:30 to 4:30 PM. <a href="https://www.dataoutpost.ai/#build-an-mcp-server-and-unwrap-a-mystery-gift-with-fastmcp-and-horizon">On the agenda</a></p>
<p>Yes, there is an actual mystery gift! You'll use FastMCP and Horizon (Prefect's MCP hosting platform) to build an MCP server, expose tools and resources, and take it from local development to a hosted deployment. Then you'll connect it to a shared gift service, so an agent can check which numbered gifts are still available and reserve one for you.</p>
<p>You'll leave with a working hosted MCP server, hands-on experience connecting agents to a shared service, and a gift to take home.</p>
<blockquote>
<p>My take: Building an MCP is a great way to scale your expertise across the company.</p>
</blockquote>
<h2>Get Data Agent-Ready</h2>
<p>An agent is only as good as the data it can reach. These 5 workshops get your data in shape: migrated from your current warehouse, stored in an open lakehouse, streamed fresh from a live database, synced from a custom source, and pulled out of messy documents.</p>
<h3>What to move, what to fix, what to leave behind: migrating to MotherDuck</h3>
<p>Thinking about moving to MotherDuck, but dreading peeling back the duct tape on your current setup? Dumky will help you build your own system for migrating data: an inventory built from query history, logs, and access patterns, the right strategy for each workload, and the data movement, transformations, and consumption layers to match.</p>
<p>It applies whether you're coming from Snowflake, BigQuery, Postgres, or something else, and whether your data feeds dbt, Hex, Power BI, or a customer-facing web app. You'll leave with the runbook to migrate with confidence.</p>
<blockquote>
<p>My take: The hardest part of a migration is always in the details. Making sure you handle all workloads and can validate that the data is correct will really speed things up!</p>
</blockquote>
<h3>Lakehouses for Robots: Scaling DuckLake and Iceberg for Agent Workloads</h3>
<p><strong>Workshop:</strong> Alex Monahan (MotherDuck) and Matt Martin (Staff Engineer, State Farm) · 9:15 to 11:00 AM. <a href="https://www.dataoutpost.ai/#lakehouses-for-robots-scaling-ducklake-and-iceberg-for-agent-workloads">On the agenda</a></p>
<p>Data lakehouses are open, scalable, and interoperable, but most are not ready for agents. We’ll show you how to query Iceberg and DuckLake using both DuckDB and MotherDuck with the agent of your choice. You’ll also learn how to take full advantage of your local laptop so you can build even faster.</p>
<p>Whether you are new to lakehouses or a seasoned expert, you’ll end the session with a working lakehouse example ready for the flood of agents.</p>
<blockquote>
<p>My take: I'm a bit biased - I'll be leading this one with Matt! I really like the lakehouse architecture, so we'll build one that's agent ready.</p>
</blockquote>
<h3>From Scheduled Syncs to Real Time Data Using Change Data Capture: A Hands-On Lab</h3>
<p>Stale data used to be tolerable, because the person reading the dashboard knew it was a few hours behind. Agents query constantly and act on what they find, and a partially arrived transaction looks exactly like an arrived one. That makes stale data a correctness problem - your agent will draw the wrong conclusion!</p>
<p>In this guided lab you'll capture updates from a live source database as they happen, materialize them into your warehouse in a transactionally safe way, and answer how current your data actually is.</p>
<blockquote>
<p>My take: Nobody wants to point agents at their production database. Replicating your data to a safer and faster environment for agents is a great plan, and Estuary can help make that seamless!</p>
</blockquote>
<h3>Turning Your Data Into AI Context, Powered by Airbyte</h3>
<p>Go from a raw source to an agent that answers questions about your data. You'll build a custom source in the Airbyte Cloud connector builder, use the Airbyte MCP to sync it into MotherDuck, then build an agent on top that explores the data in natural language and puts a dashboard on it.</p>
<p>Then comes the important part: structuring the agent's context so its answers are consistently correct. You'll leave with a working connection, a dashboard on your synced data, and an agent whose accuracy you've actually measured.</p>
<blockquote>
<p>My take: I've pulled data out of all kinds of legacy data systems (in a past role), so it is really valuable to be able to customize your data ingestion. I'm certain Airbyte + agents make this way more fun than it used to be!</p>
</blockquote>
<h3>From Unstructured Documents to Agent-Ready Data</h3>
<p><strong>Workshop:</strong> Palak Agarwal (DevRel Lead, Reducto) and Josh Nkoy (Founding Solutions Engineer, Reducto) · 2:30 to 4:30 PM. <a href="https://www.dataoutpost.ai/#from-unstructured-documents-to-agent-ready-data">On the agenda</a></p>
<p>PDFs, scans, images, and all kinds of messy documents go in, and a structured, searchable archive comes out. You'll use Reducto's MCP to build a curator, then pick your own collection and create a mini-exhibition: a poetry show made from drafts and annotations, a moment in history told through letters and newspapers, or a championship season rebuilt from box scores and scouting reports.</p>
<p>You'll leave with a working document pipeline and an exhibition you can share.</p>
<blockquote>
<p>My take: A scanned in PDF is the final boss of messy data, but sometimes that's where the core nuggets of organizational context live.</p>
</blockquote>
<h2>Run Agents in Production</h2>
<p>Shipping an agent is the start. These 2 workshops cover what comes after: finding out what your agent actually does in production, and what it takes to serve lots of long-running agents at once.</p>
<h3>The Agent Loop: From Traces to Patterns to Better Agents</h3>
<p><strong>Workshop:</strong> Izzy Hurley (Eval Engineer, Braintrust) and Spencer Seale (Solutions Engineer, Braintrust) · 11:00 AM to 1:00 PM. <a href="https://www.dataoutpost.ai/#the-agent-loop-from-traces-to-patterns-to-better-agents">On the agenda</a></p>
<p>Your agent is in production. Now you need to understand what keeps going wrong. Agents rarely fail in obvious ways, and no team can manually review every production trace.</p>
<p>You'll run the full evaluation loop twice: first with a physical building challenge that makes the ambiguity tangible, then with a real AI agent. You'll explore production traces, uncover recurring patterns, build an evaluation dataset and scorer, and test an improvement.</p>
<p>You'll leave with a repeatable workflow for turning real agent behavior into more reliable AI.</p>
<blockquote>
<p>My take: If you want your company to trust AI, you need evals. The folks at Braintrust have a ton of expertise here!</p>
</blockquote>
<h3>LLM Inference for the World of Agents</h3>
<p>Learn how your agent works, down to the details, so you can build or customize your own.</p>
<p>An agent might run for minutes, make 100 tool calls, and generate tens of thousands of tokens before it's done. That's a very different workload from the single prompt and response that most examples describe.</p>
<p>Zain will take apart a coding agent (think Claude Code, Codex, or Cursor) into its model, harness, context, tools, and memory, then follow the tokens into the inference engine: tokenization, continuous batching, prefill and decode, KV-cache management, prefix caching, and more.</p>
<p>You'll leave with one continuous mental model of the entire agent stack.</p>
<blockquote>
<p>My take: We used to design software, but I think that we will increasingly be designing the systems we use to build software. This is a great way to get comfortable with the agent-centric future we're headed to.</p>
</blockquote>
<h2>See You at the Outpost!</h2>
<p>Every workshop on this list ends with something you can keep using: an agent, a pipeline, a runbook, or a mental model. And they share the big idea from the main day: agents get better when the data underneath them is done well.</p>
<p>A quick heads up: workshops run in parallel, so pick 1 per time slot. Then stick around for Thursday, November 5, for <a href="https://motherduck.com/blog/data-outpost-2026-agenda/">a full day of talks and panels</a> on the data stack after agents, AI at scale, semantic layers, and more.</p>
<p><strong><a href="https://tickets.dataoutpost.ai/data-outpost/rsvp/register?e=data-outpost">Register for Data Outpost</a></strong> and bring your laptop.</p>
<p>See you in San Francisco!</p>
]]></content>
        <author>
            <name>Alex Monahan</name>
        </author>
    </entry>
    <entry>
        <title type="html"><![CDATA[AI Needs Data, Data Needs AI: What You'll Learn at Data Outpost]]></title>
        <id>https://motherduck.com/blog/data-outpost-2026-agenda</id>
        <link href="https://motherduck.com/blog/data-outpost-2026-agenda"/>
        <updated>2026-10-01T00:00:00.000Z</updated>
        <summary type="html"><![CDATA[Data Outpost is an AI and data conference in San Francisco. Its main day, November 5, 2026, has 13 talks and panels from teams at Canva, Stripe, DoorDash, Posit, dbt and more. Here's what each session covers, from agents that write back to context layers, SQL harnesses, and AI for regulated data, and what you'll walk away with.]]></summary>
        <content type="html"><![CDATA[
<p><img src="https://motherduck-com-web-prod.s3.us-east-1.amazonaws.com/assets/img/articles/data-outpost-2026-agenda/data_outpost_hero_e4e9be7ab8.png" alt="Data Outpost: 2 days, November 4-5, 2026, San Francisco"></p>
<p>AI is rebuilding how companies work, but we all know that slapping a chatbot on top won't cut it. Data systems are the way that even the most powerful frontier model knows anything about your business. The intersection of the two is filled with complexity: what does it mean when agents are "part of the team"? What does it take for an AI system to be trustworthy? How can we build insight-generating systems that scale?</p>
<p><a href="https://www.dataoutpost.ai">Data Outpost</a> is an AI and data conference where you'll learn from down-to-earth experts and visionaries alike. It's a small format event, so you get to actually talk to these folks and collaborate with them.</p>
<p><a href="https://www.dataoutpost.ai/#agenda-nov-4">Workshops</a> are on <strong>Wednesday, November 4th</strong>, and the main day of talks and panels is <strong>Thursday, November 5, 2026</strong>, both at Convene 100 Stockton in San Francisco.</p>
<p><strong>Sound good? <a href="https://tickets.dataoutpost.ai/data-outpost/rsvp/register?e=data-outpost">Register for Data Outpost here!</a> Need more convincing? Read on!</strong></p>
<p>We'll cover a quick tour of what you'll learn from our sessions plus my take about what I'm most excited about for each!</p>
<h2>Read-Only Was Nice While It Lasted</h2>
<p>Agents used to read your data and hand back answers. Now they act on it, and once they do, someone has to decide what they're trusted with.</p>
<h3>Data + AI Product Leadership: The Data Stack After Agents</h3>
<p><strong>Panel:</strong> Tristan Handy (President &#x26; Co-Founder, Fivetran + dbt Labs, moderator), Stefanie Tignor (Head of Data, Clay), Jake Hannan (VP, Data &#x26; Revenue Engineering, Sigma), Leanne Fretz (Head of Data, Mercury), and Alexis Weill (Head of Data Science, Perplexity). <a href="https://www.dataoutpost.ai/#data-ai-product-leadership-the-data-stack-after-agents">On the agenda</a></p>
<p>dbt, Clay, Sigma, Mercury, and Perplexity take on what a data stack looks like when agents write, respond, and assemble their own context at a pace far faster than we humans do. If your agents are starting to do more than read, you'll hear how 5 companies are tackling that challenge and the benefits they are seeing from it.</p>
<blockquote>
<p>My take: Data and AI are linked together now, just like software and AI. Agents writing data makes a lot of sense as the next step to me.</p>
</blockquote>
<h3>Finding a Seat at the Table for Your Agent</h3>
<p>Michael's team built a capable data engineering agent, but found that creating it was only half the challenge. They wanted to make the agent a "real" team member.</p>
<p>Fitting an agent into their workflows raised harder questions around trust and accountability. You'll leave with the framework his team uses for agent oversight.</p>
<blockquote>
<p>My take: If you have questions about the details, so do I! This approach is definitely at the frontier and I want to know more.</p>
</blockquote>
<h2>Getting It to Work Is the Easy Part</h2>
<p>This is the most AI-flavored theme of the day. Even here, the hard problems show up after the demo.</p>
<h3>AI at Scale Inside Real Companies</h3>
<p><strong>Panel:</strong> Tomasz Tunguz (General Partner, Theory Ventures, moderator), Sudeep Das (Head of New Verticals AI, DoorDash), and Tosh Rayadhurgam (Head of Advanced AI, Stripe). <a href="https://www.dataoutpost.ai/#ai-at-scale-inside-real-companies">On the agenda</a></p>
<p>Getting an AI feature to work is the easy part. Keeping it working for millions of users, under real latency and cost constraints, is decidedly harder.</p>
<p>The heads of AI at Stripe and DoorDash will share how they evaluate models, decide what to build versus buy, and structure teams around systems that are never quite finished. If you have a working prototype and a roadmap that says "production," this is your panel.</p>
<blockquote>
<p>My take: Scaling AI systems is absolutely an in-demand skillset. Demos are one thing, but it's a lot tougher to actually build a full platform.</p>
</blockquote>
<h2>What Does "Active Customer" Mean, Anyway?</h2>
<p>If you want AI to give people the right answers, it first needs to understand what the business means. Both talks here are about getting that meaning in front of the AI.</p>
<h3>Automating the creation of the semantic layer</h3>
<p>Do you have 3 definitions of "active customer" and just one expert who knows the difference? You are not alone.</p>
<p>Sam at Canva tackled this problem with <strong>semantic leaking</strong>, a novel technique that uses LLMs to deliberately leak context between technical artifacts and the language of the business. It surfaces the terms people actually use, generates realistic questions for each domain, and finds the concepts and relationships your models need to support.</p>
<p>Then Sam turns that same context against the system. Ambiguous, adversarial, and deliberately unanswerable questions test whether the AI answers what it can, refuses what it can't, and explains the difference.</p>
<blockquote>
<p>My take: Agents should answer most questions, but sometimes the agents really ought to escalate to the data folks! Teaching them how to decide is powerful.</p>
</blockquote>
<h3>Delivering Self-Serve Intelligence in a Composable System of Record</h3>
<p>Picture an operator asking why an order is late. The answer is in the ERP somewhere, but getting to it means knowing the data model, stitching together reports, and asking a technical team for help.</p>
<p>Doss is building a system of record whose schema reflects how each customer actually runs their business, with interfaces and agents on top. Arnav will show how they connect operational data, business context, permissions, and agent-driven exploration, where that flexibility helps, and how to make a system of record actually useful.</p>
<blockquote>
<p>My take: I'm a self-service-maximalist, so a talk about serving customers who know their business better than their data is right up my alley!</p>
</blockquote>
<h2>The Harness Around the Model</h2>
<p>Which matters more for AI-written SQL: the model, or everything around it? Julia's talk has a clear answer.</p>
<h3>The SQL Agent Harness We Didn’t Mean to Build</h3>
<p>Natural language to SQL rests on an appealing assumption: the model is what makes the query correct. Julia argues the result depends far less on the model than on the harness around it, meaning what the model can see, verify, and run.</p>
<p>Her team built SQL tools in Positron (a data science IDE from the team behind RStudio) for people: schema browsing, completions, an interactive console, and a data explorer. Then they pointed an AI assistant at that same environment and realized they had already built the harness.</p>
<p>You'll learn what a good SQL authoring harness requires, and why bolting on an "AI mode" is so often the wrong shape for this kind of work.</p>
<blockquote>
<p>My take: For SQL, a more advanced harness beats a more expensive LLM any day. Learning what a good harness needs is a very valuable skill!</p>
</blockquote>
<h2>Understand (and Own) Your Data First</h2>
<p>AI can turn documents into tables faster than ever. These 2 talks cover what has to be true about your data for that speed to pay off.</p>
<h3>Understanding comes before modeling: a data engineer's philosophy for the age of AI extraction</h3>
<p>Thanks to agents, regulatory documents, insurance claims, and bills can become tables in a heartbeat. By itself, that won't amplify your team.</p>
<p>Lucie built the data platform at Opto Investments on 1 principle: you don't model what you don't understand yet. You keep the data, study it, and let it show you what it is before you impose structure. That is how you reach scale.</p>
<p>When AI extraction lands on a well-understood data model, every new document and source compounds. Skip that work, and every new thing breaks something.</p>
<p>You'll see the infrastructure behind that approach, including what it looks like when the data keeps surprising you and there's no playbook.</p>
<blockquote>
<p>My take: Documents are the final boss of unstructured data. Lucie is getting real value out of them, and it takes both data and AI expertise.</p>
</blockquote>
<h3>Your Compliance Team Was Right: Why Regulated Firms Must Own Their Data+AI Stack</h3>
<p>For banks, insurers, healthcare organizations, and law firms, sending sensitive data to third-party AI tools can be more than risky - it can be illegal. But sitting out AI isn't an option.</p>
<p>Upal has deployed document intelligence pipelines inside regulated Fortune 500 environments. He'll cover the rules driving this (privilege, HIPAA, GLBA, and data residency) and the architecture patterns that make it feasible for lean data teams.</p>
<p>He'll also show where to draw the line between building and buying self-hosted components, so compliance, legal, and engineering all sign off. You'll leave with a concrete framework for bringing AI to your data instead of shipping your data to AI.</p>
<blockquote>
<p>My take: For something as critical as security but as new as AI, you want to learn from someone who has been there.</p>
</blockquote>
<h2>See You at the Outpost!</h2>
<p>AI gets better when the data work underneath it is done well, whether that's a context layer, a SQL harness, or a data model that fits the domain. And that data work gets more valuable once agents can use it.</p>
<p>Stay tuned, because a few more sessions are still landing! Jordan Tigani (Co-Founder &#x26; CEO, MotherDuck) kicks off the day with the opening keynote. Joe Reis (co-author of O'Reilly's <em>Fundamentals of Data Engineering</em>), Ameya Bhatawdekar (VP, Field CTO, Braintrust), and Benn Stancil (former Co-founder and Chief Analytics Officer at Mode) are on the agenda too, with topics coming soon. Plus, Ben Holtzman (Head of Data, AheadComputing) will share real life stories of building an AI-centered self-service data platform. Keep an eye on <a href="https://www.dataoutpost.ai/#agenda-nov-5">the agenda</a> for the details.</p>
<p>Want to get your hands dirty first? The day before, November 4, has <a href="https://www.dataoutpost.ai/#agenda-nov-4">11 hands-on workshops</a> where you can build a data agent, scale DuckLake and Iceberg for agent workloads, stream real-time data with change data capture, and even build an MCP server that reserves a real mystery gift!</p>
<p>If these abstracts read like your team's whiteboard, come ask your questions in person. <strong><a href="https://tickets.dataoutpost.ai/data-outpost/rsvp/register?e=data-outpost">Register for Data Outpost</a></strong>, and come a day early for the workshops if you want to get hands-on.</p>
<p>See you in San Francisco!</p>
]]></content>
        <author>
            <name>Alex Monahan</name>
        </author>
    </entry>
    <entry>
        <title type="html"><![CDATA[Jev for analytics: turn text columns into gold, in plain SQL]]></title>
        <id>https://motherduck.com/blog/jev-for-analytics</id>
        <link href="https://motherduck.com/blog/jev-for-analytics"/>
        <updated>2026-09-29T00:00:00.000Z</updated>
        <summary type="html"><![CDATA[Turn a free-text column into typed SQL columns with prompt_jev(): 100,000 consumer complaints classified in 82 seconds, at about 1% of a frontier LLM's cost, plus how to check the labels before you trust them.]]></summary>
        <content type="html"><![CDATA[
<p>Every now and then, we all end up with a table that has a big text column. A comment, some customer feedback, or worse, an address nobody parsed upstream. There are insights in that column, but they're hard to get out. And sometimes it's plain extra compute you keep paying for: the address never got parsed into typed columns, so every query parses text again, and parsing text is <code>$$$</code>.</p>
<p>Let's take a dataset with 100,000 complaints. Each row has a narrative (someone explaining what went wrong with a bank, a lender, or their credit report) and how the company responded. The column I actually want is missing: what was the person asking for?</p>
<p>It sounds like a job for an LLM. But running an LLM over every row just to pick one of seven known answers is like using a cannon to kill a fly. It's slow on a big table, so it scales badly, or it just burns your credit card.</p>
<p><code>prompt_jev()</code> classified the 100,000 rows in 82.2 seconds, with no LLM generating the per-row answers. On the same complaints, gpt-5-nano through <code>prompt()</code> needed 6 minutes 9 seconds for only 10,000 rows (Jev: 12.5 seconds). On cost, the <a href="https://motherduck.com/blog/motherduck-supports-jev/">launch benchmark</a> put Jev at $0.50 per 100,000 rows, against $1.58 for gpt-5-nano and $37.58 for GPT-5.6 Terra (API prices). That's about 1% of the frontier model's bill.</p>
<p>Faster and cheaper? Let's look at what Jev does, run it on the dataset, and see where I would (and wouldn't) trust the result.</p>
<p>Already convinced and looking for ideas for your own data? I wrote a follow-up with <a href="https://motherduck.com/blog/jev-analytics-use-cases/">5 Jev use cases on real datasets</a>, from AI agent logs to Hacker News and job postings, with shares you can attach.</p>
<h2>What Jev does</h2>
<p>TypeSafe calls Jev a <a href="https://typesafe.ai/blog/introducing-system-one-models-and-jev">"System One" model</a>, borrowing from Kahneman's <a href="https://en.wikipedia.org/wiki/Thinking,_Fast_and_Slow">Thinking, Fast and Slow</a>. System 1 is the quick, intuitive answer. System 2 is the slow, deliberate one. A classic LLM is System 2: it reasons and writes its answer token by token. Jev is System 1: it reads the text once and scores the answers you allowed.</p>
<p>| | System 2: a classic LLM | System 1: Jev |
| --- | --- | --- |
| How it answers | Writes text, token by token | Scores a fixed list of answers in one pass |
| What you get back | Free text (you parse it, or force a schema) | A typed label, probability, or score |
| Can invent a new answer | Yes | No, only the options you give it |
| Tells you how sure it is | Not directly | A probability per option, plus a confidence |
| 100k rows benchmark | 18 to 32 minutes, $1.58 to $37.58 | 40 seconds, $0.50 |
| Good at | New taxonomies, summaries, explanations | The same bounded decision over many rows |
| Example: customer request: "Please refund the two fees you charged me." | Answer is something like "The customer is asking for a refund of the two fees..." (a sentence to parse) | <code>{choice: 'refund', confidence: 1.0}</code> (real output, 3 labels) |</p>
<p>For SQL, think of it as a smart decision function: you give it one row of text, a question, and the allowed answers. You get back a typed decision, plus a number that tells you how sure it is.</p>
<p>There are three question shapes. Here they are on the same real complaint (10306039, someone charged low balance fees on an account they had closed):</p>
<p>| Shape | You ask | You get back | Real answer | SQL use |
|---|---|---|---|---|
| Choice | "What outcome is the consumer asking for?" + 7 labels | one label + confidence | <code>refund_or_charge_reversal</code>, 0.95 | <code>GROUP BY</code> |
| Noul | "The complaint is about fees the bank charged." | a probability, 0 to 1 | 0.97 (and 0.02 for "reports identity theft") | <code>WHERE</code> |
| Score | "How urgent is this?" on low / medium / high | a position on the scale + confidence | 1.62 (0 = low, 2 = high), 0.43 | <code>ORDER BY</code> |</p>
<p>This walkthrough uses Choice, since each complaint should land in one request category.</p>
<p>How does that compare to what you already use?</p>
<ul>
<li>An LLM is the right tool for a new taxonomy, a summary, or an explanation. A schema can hold it to your labels, but it still writes each one out token by token. Jev picks from your list, so you always get back one of your strings.</li>
<li><code>CASE WHEN</code> or a regex only works when the rule is literal. People write "reverse the charge" instead of "refund", and mentioning money isn't always asking for it.</li>
<li>A trained classifier scales well but is painful to run (labelled examples, a model to maintain). With Jev, you describe the categories in the query and try them right away.</li>
<li>Parsing rules (JSON paths, address parsers) are static and break when the format changes. Jev works from what the text says, so messy input hurts it less.</li>
</ul>
<p>Jev can only return one of the options you gave it, so poor options get you a neatly typed poor answer. Garbage in, garbage out.</p>
<h3>About the dataset: complaints from CFPB</h3>
<p>The complaints come from the U.S. Consumer Financial Protection Bureau (<a href="https://www.consumerfinance.gov/foia-requests/foia-electronic-reading-room/cfpb-consumer-complaint-database-narratives-archive/">CFPB's archive</a>), the agency that collects complaints about banks, lenders, credit bureaus, and other financial services.</p>
<p>My table <code>complaints_100k</code> has (spoiler alert) 100,000 rows with <code>complaint_id</code>, <code>narrative</code>, <code>company_response</code>, and a few other fields. Here's what four rows look like:</p>
<p>| complaint_id | product | narrative (trimmed) | company_response |
|---|---|---|---|
| 9906201 | credit reporting | "This account is incorrectly being reported as a charged off account with a balance due. Please provide proof of the charge off and update the balance to {$0.00}..." | Closed with explanation |
| 10306039 | bank account | "I closed my Chase checking account in XXXX by sending Chase a letter via mail. Chase conveniently ignored the account closure request so they can charge low balance fees..." | Closed with monetary relief |
| 6084737 | debt collection | "I have no outstanding debts owed that I am aware of. Americollect has called numerous times almost daily..." | Closed with explanation |
| 2042216 | credit card | "I paid my credit card with a money order. They did not apply the payment to my account..." | Closed with monetary relief |</p>
<p>Let's get the gold out of that narrative column.</p>
<pre><code class="language-sql">ATTACH 'md:_share/jev_complaints/24f0bb33-43ef-4fe3-b41c-f37f3882995c' AS jev_complaints;
USE jev_complaints;
</code></pre>
<p><code>complaints_100k</code> is the before: the raw complaints, ready for <code>prompt_jev()</code>. <code>complaint_requests</code> is the after: the Jev labels for all 100,000 rows, so you can jump straight to the <code>GROUP BY</code>. Tip: try <code>prompt_jev()</code> on a <code>LIMIT 1000</code> first, since every call uses AI units.
</p>
<h2>Step 1: define the labels, then classify</h2>
<p>Before classifying 100,000 rows, we need the categories. I sampled 40 narratives and asked MotherDuck's <code>prompt()</code> function, running gpt-5-mini, to suggest seven requested-outcome categories. That took 7.6 seconds. How you sample matters (and you can take a bigger one), but that's a business question more than a technical one.</p>
<p>Then Jev classifies every row against these categories, in less than 2 minutes:</p>
<p>.dd20-sim{width:100%;height:auto;margin:32px 0}design the labels once · apply them to every rowonce · 40 sampled rowsPlease note the above referenced accounts were...I paid my credit card with a money order. They...I just understand how my scores went from 840s...+ 37 more narrativesprompt()gpt-5-mini7.6 sFix credit reportIdentity theftRefund / reversalOtherExplain decisionStop contactTransaction error7 labels + a description eachevery row · 100,000 of themsame 7 labels, as constantsThis account is incorrectly being reported as a...I closed my Chase checking account in XXXX by s...I have no outstanding debts owed that I am awar...+ 99,997 moreprompt_jev()scores 7 labels82.2 s totalFix credit report1.00Refund / reversal0.95Stop contact1.00request.choice · confidence</p>
<p>Jev requires the question and the choices to be constants, so the simplest way is to paste the taxonomy straight into <code>choice :=</code>. Here's the classification step, with the same labels and descriptions as the measured run:</p>
<pre><code class="language-sql">CREATE TABLE complaint_requests AS
SELECT complaint_id, company_response,
       prompt_jev(
         narrative,
         'What outcome is the consumer asking for?',
         choice := [
           {label: 'refund_or_charge_reversal',
            description: 'Consumer requests money returned, reversal of fees/charges, or reimbursement.'},
           {label: 'correct_or_remove_credit_report_entry',
            description: 'Consumer asks to fix, update, or remove inaccurate items on their credit report.'},
           {label: 'investigate_and_credit_transaction_error',
            description: 'Consumer requests investigation and correction of a transaction or deposit error and credit to their account.'},
           {label: 'stop_harassment_or_contact',
            description: 'Consumer asks for communications or collection calls/texts/emails to stop or follow rules.'},
           {label: 'address_identity_theft_or_fraud',
            description: 'Consumer requests action to resolve identity theft, fraudulent accounts, or unauthorized inquiries.'},
           {label: 'explain_decision_or_account_status',
            description: 'Consumer asks for clarification or explanation of a decision, account action, or why charges occurred.'},
           {label: 'other',
            description: 'Any requested outcome that does not fit the categories above.'}
         ]
       ) AS request
FROM complaints_100k;
</code></pre>
<p>.dd20-sim{width:100%;height:auto;margin:32px 0}prompt_jev() · one label per complaintMotherDuckbatches the rowsTypeSafe · Jevwaitingscoring 7 labelsdone · no text outnarratives · 1 qnarrativeproductrequest.choiceconfidenceThis account is incorrectly being reported as a charged...This account is incorrectly being reported as a charged off account with a balance due. Please provide proof of the charge off and update the balance to {$0.00} or delete the negative payment status on this account.credit reportingFix credit report1.00I closed my Chase checking account in XXXX by sending C...I closed my Chase checking account in XXXX by sending Chase a letter via mail. Chase conveniently ignored the account closure request so they can charge low balance fees. They have twice charged me low balance fees on an account that should be closed.bank accountRefund / reversal0.95I have no outstanding debts owed that I am aware of. Am...I have no outstanding debts owed that I am aware of. Americollect has called numerous times almost daily and has now begun calling me outside of the legal time frame before XXXX and after XXXX.debt collectionStop contact1.00Please note the above referenced accounts were opened F...Please note the above referenced accounts were opened FRAUDULENTLY ; as a result of Identity Theft. My information was compromised &#x26; fraudulently used without my permission.credit reportingIdentity theft0.96I paid my credit card with a money order. They did not...I paid my credit card with a money order. They did not apply the payment to my account. I sent conformation/copies from the money order company that the money order had been cashed by the credit card company.credit cardTransaction error0.99I just understand how my scores went from 840s to the 7...I just understand how my scores went from 840s to the 770s with NO ACTIVITY on my reports??????? I am very clueless and I need an explanation from each of the Creditors.credit reportingExplain decision0.98</p>
<p><code>request</code> is a struct. <code>request.choice</code> is the picked label, and <code>request.confidence</code> and <code>request.probabilities</code> help you inspect the decision. Here's what came back for the Chase fees complaint (10306039):</p>
<pre><code class="language-sql">{
  choice: 'refund_or_charge_reversal',
  confidence: 0.95,
  probabilities: [
    {value: 'refund_or_charge_reversal', probability: 0.96},
    {value: 'other', probability: 0.03},
    {value: 'explain_decision_or_account_status', probability: 0.01},
    ... -- the other 4 labels at 0.00
  ]
}
</code></pre>
<h3>Bonus: keep the labels in a table</h3>
<p>Pasting 7 labels into a query is fine once. If the taxonomy sticks around (versioned, shared across queries, edited by the business), you'd rather keep it in a table. A subquery in <code>choice :=</code> doesn't work (<code>"choice" parameter must be a constant value</code>), but a DuckDB variable does, because it's resolved before the query runs:</p>
<pre><code class="language-sql">SET VARIABLE request_labels = (
  SELECT list({label: label, description: description} ORDER BY label)
  FROM request_taxonomy
);

SELECT complaint_id,
       prompt_jev(narrative, 'What outcome is the consumer asking for?',
                  choice := getvariable('request_labels')) AS request
FROM complaints_100k;
</code></pre>
<p>Why bother: one source of truth for the labels, easy to version (add a <code>taxonomy_version</code> column), and the business can review the labels without reading SQL.</p>
<h2>Step 2: don't trust Jev blindly</h2>
<p>Jev can't invent a label, but it can still pick the wrong one.</p>
<p>The first thing to look at is <code>confidence</code>. Jev scores every label, and <code>confidence</code> says how concentrated those scores are: 1.0 when one label takes everything, low when two or three labels share the probability.
Across the 100,000 rows, the mean confidence is 0.83, 65.8% of rows are at 0.8 or above, and 10.9% are below 0.5.</p>
<p>SQL gives you the review queue:</p>
<pre><code class="language-sql">SELECT complaint_id, request.choice, request.confidence
FROM complaint_requests
WHERE request.confidence &#x3C; 0.8
ORDER BY request.confidence;
</code></pre>
<p>.dd20-sim{width:100%;height:auto;margin:32px 0}request.confidence · keep it or review itcomplaint 10306039"I closed my Chase checking account in XXXX bysending Chase a letter via mail. Chaseconveniently ignored the account closure request ..."request.probabilitiesRefund / reversal0.96Other0.03Explain decision0.01request.confidence0.950.8keepcomplaint 8834942"I urge you to act swiftly in removing theseunauthorized inquiries from my credit report. Theyare causing significant distress, and I have ..."request.probabilitiesIdentity theft0.60Fix credit report0.40Other0.00request.confidence0.530.8review queue</p>
<p>0.8 is an example, and a row above it can still be wrong. Send uncertain rows to a human or a bigger model, and keep the rest in the analytics table once you've validated that cut on your data.</p>
<p>The second check is to compare against another model on a sample. On 300 rows, I labelled them twice: with GPT-5 through <code>prompt()</code> (the newest model MotherDuck's <code>prompt()</code> offers today) and with Claude Opus 5.5, which read each narrative blind, without seeing any other label. Here's what came out:</p>
<p>| Comparison on 300 rows | Agreement |
|---|---:|
| GPT-5 vs Claude Opus 5.5 | 72.7% |
| Jev vs GPT-5 | 77.3% |
| Jev vs Claude Opus 5.5 | 74.0% |
| Jev, on the 218 rows where GPT-5 and Opus agree | 90.4% |
| Jev, on those rows with confidence >= 0.8 (161 rows) | 96.9% |</p>
<p>The two big LLMs agree with each other less often than Jev agrees with either of them. So the task itself is fuzzy: most disagreements sit on the boundaries we already saw (identity theft vs credit-report fix, "other" vs a specific label).</p>
<h2>Step 3: ask the question (the good boring part)</h2>
<p>Once the requested outcome is a typed column, it's plain SQL:</p>
<pre><code class="language-sql">SELECT request.choice AS requested_outcome,
       count(*) AS complaints,
       round(100.0 * avg(
         (company_response = 'Closed with monetary relief')::INT
       ), 1) AS pct_monetary_relief
FROM complaint_requests
GROUP BY 1
ORDER BY complaints DESC;
</code></pre>
<p>It runs in 0.9 seconds on MotherDuck. The 82.2 seconds of classification happen once, and every question after that costs what any other <code>GROUP BY</code> costs.</p>
<p>.dd20-sim{width:100%;height:auto;margin:32px 0}GROUP BY request.choice · 100,000 complaintscomplaintsgot money backFix credit reportFix credit report: 59,098 complaints59,098Fix credit report: 0.2% got money back0.2%Identity theftIdentity theft: 16,149 complaints16,149Identity theft: 1.5% got money back1.5%Refund / reversalRefund / reversal: 7,140 complaints7,140Refund / reversal: 19.9% got money back19.9%OtherOther: 6,878 complaints6,878Other: 2.5% got money back2.5%Explain decisionExplain decision: 5,173 complaints5,173Explain decision: 4% got money back4.0%Stop contactStop contact: 3,116 complaints3,116Stop contact: 0.8% got money back0.8%Transaction errorTransaction error: 2,446 complaints2,446Transaction error: 13.6% got money back13.6%</p>
<h2>When I would use this pattern</h2>
<p>Use <code>prompt_jev()</code> when the same decision repeats across many rows and you can write the possible answers down: complaint intent, product family, "did they ask for a refund?", a severity rubric. Use an LLM when you need new categories, generated text, or an explanation a human will read. Or use both, like here: the LLM helps design the question, Jev applies it at scale.</p>
<p>The <a href="https://motherduck.com/blog/motherduck-supports-jev/">MotherDuck launch benchmark</a> classified 100,000 short news articles in 40 seconds. My 82.2-second complaint run is a different task (longer narratives, seven described choices), so I wouldn't promise either number on your table. Test on a sample first :)</p>
<p><code>prompt_jev()</code> is available on MotherDuck paid plans. The text is sent to TypeSafe for inference, so check your data-handling requirements before passing sensitive customer data. The <a href="https://motherduck.com/docs/key-tasks/ai-and-motherduck/classify-text-with-prompt-jev/">guide</a> and <a href="https://motherduck.com/docs/sql-reference/motherduck-sql-reference/ai-functions/prompt-jev/">function reference</a> have the full syntax.</p>
]]></content>
        <author>
            <name>Mehdi Ouazza</name>
        </author>
    </entry>
    <entry>
        <title type="html"><![CDATA[Querying the entire internet (100 billion rows!) with MotherDuck]]></title>
        <id>https://motherduck.com/blog/querying-the-entire-internet-100-billion-rows-with-motherduck</id>
        <link href="https://motherduck.com/blog/querying-the-entire-internet-100-billion-rows-with-motherduck"/>
        <updated>2026-09-22T00:00:00.000Z</updated>
        <summary type="html"><![CDATA[Common Crawl publishes petabytes of web crawl data on S3. With DuckDB and MotherDuck you can query the Common Crawl dataset directly, no cluster and no download, and measure how fast the vibe-coded web is growing.]]></summary>
        <content type="html"><![CDATA[
<p><img src="https://motherduck-com-web-prod.s3.us-east-1.amazonaws.com/assets/img/fishing_duck_40b80b6dd5.jpg" alt=""></p>
<p>DuckDB is small. The data it queries doesn't have to be. So let's try something big. <a href="https://commoncrawl.org/">Common Crawl</a> has been crawling and publishing web pages since 2008, and every crawl lands on S3 for anyone to read. Coding agents have turned a lot of people into web developers, so here is the internet-sized question for today: how much has personal, platform-hosted publishing actually grown?</p>
<p>GitHub, Vercel, Lovable and the rest all hand you a subdomain for whatever you just built, a dating app for ducks included. The obvious guess is that those subdomains are multiplying fast. Let's check. First some history before we get our hands on those 100 billion rows, so cue the old man yelling at the cloud.</p>
<h2>Common Crawl, HTTP Archive, Wayback Machine: same same, but different?</h2>
<p>If you've ever wanted to see the history of a page or find a site that has since been deleted, you may be familiar with the Wayback Machine, part of the Internet Archive. It is a great database of internet history, and while it is perfect for finding historical artefacts it doesn't lend itself well to analysis across sites. The HTTP Archive is a Google-backed project that cares less about the content than about the <em>technology</em> of the web, and it even loads JavaScript, partially, when it crawls. The downside is that it mostly captures the homepage of a site and nothing else.</p>
<p>Our dataset of choice, Common Crawl, does not load JavaScript, so it might miss parts of a JavaScript-powered single-page application, but it does go wide and deep, following all the links it finds. That makes it perfect to find, for example, <code>github.io</code> pages, which usually have the structure <code>&#x3C;github-username>.github.io/&#x3C;repo-name></code>.</p>
<p>In short: Common Crawl is a broad net for all page content, HTTP Archive is a lab measurement of a fixed number of sites, and the Wayback Machine is a time series of individual URLs.</p>
<p>|  | Common Crawl | HTTP Archive | Wayback Machine |
| --- | --- | --- | --- |
| <strong>Size / scope</strong> | ~2.2B pages and ~150 TiB per monthly crawl since 2008 | ~16.2M websites per crawl (15.4M mobile, 12.2M desktop), sourced from Chrome UX Report (<a href="https://almanac.httparchive.org/en/2025/methodology">2025 methodology</a>), since 2010 | >1 trillion URL captures, ~99 PB unique, ~150 TB/day (<a href="https://blog.archive.org/trillion/">blog.archive.org/trillion</a>). Internet Archive since 1996, Wayback Machine launched 2001 |
| <strong>Home page vs. paths</strong> | Link-following crawl, so <code>/v2/category/...</code> style URLs are there, though coverage per site is a <em>sample</em>, not exhaustive | Home pages primarily, plus some secondary pages in recent years | Whatever anyone or any crawler ever requested |
| <strong>What's stored</strong> | Raw WARC (headers + HTML), plus WAT (metadata) and WET (plain text), plus a columnar Parquet index and a hyperlink/PageRank graph | HAR files, Lighthouse audits, technology detection | Full WARC captures of the original bytes, replayable in a browser |
| <strong>Access</strong> | <code>s3://commoncrawl</code> + <code>data.commoncrawl.org</code>, CDX API, Parquet index, queryable straight from DuckDB | BigQuery (<code>httparchive.crawl.*</code>), monthly partitions | CDX API + <code>web.archive.org/web/&#x3C;timestamp>/&#x3C;url></code>; no bulk dump |
| <strong>Best for</strong> | Text corpora (LLM training), link graphs, domain inventories | Web-performance, Core Web Vitals, framework/tracker share over time | Point lookups and history of a specific page |</p>
<h2>How much of the Common Crawl dataset do you actually need?</h2>
<p>Common Crawl collects about 150 TiB per crawl. Every crawl is a sample, so I want several crawls per year and a few years of history. That sounds like querying 15 petabytes. It isn't. Most of the time "Big Data" just means a poorly designed dataset. This one is designed well, and it all sits on S3 for us to query and slice as we need.</p>
<p>So let's look at what's in the dataset and what we actually need. Common Crawl looks roughly like this.</p>
<ul>
<li>Each crawl is a folder, e.g. <a href="https://data.commoncrawl.org/crawl-data/CC-MAIN-2026-34/index.html"><code>https://data.commoncrawl.org/crawl-data/CC-MAIN-2026-34/</code></a></li>
<li>The folder contains both the data in different formats and pointers to the data
<ul>
<li>WARC contains the full payload</li>
<li>WAT contains the metadata: HTTP headers, meta tags, outbound links, etc.</li>
<li>WET only contains the plain text</li>
<li>CDX URL index: the 300 or so files with just the index to point you to the right WARC file. You can try it out directly with e.g. <code>https://index.commoncrawl.org/CC-MAIN-2026-34-index?url=motherduck.com&#x26;output=json</code></li>
<li>Columnar URL index: 900 Hive-partitioned Parquet files.</li>
</ul>
</li>
<li>Every 3 months crawls are combined into <a href="https://data.commoncrawl.org/projects/hyperlinkgraph/cc-main-2026-jun-jul-aug/index.html">a web graph</a>. This dataset records how domains connect to each other and ranks them with several algorithms. It produces a list for both domains (e.g. <code>github.io</code>) and hostnames (<code>duckfan67.github.io</code>). For each of these there is:
<ul>
<li>A list of all nodes, that is the host or domain name with their IDs.</li>
<li>A list of all edges, that is which ID connects to which ID.</li>
<li>A ranking based on harmonic centrality and PageRank.</li>
</ul>
</li>
</ul>
<p>So we can take a shortcut and query the web graph's hostname list instead of the crawls it was built from. One release of that list is between 4.6GB and 11GB gzipped and holds every hostname the crawl saw across three months: 247 million of them in June 2026, spread over 121 million registered domains. Sixteen releases, one per quarter back to 2021, comes to 103GB of gzip. That drops us from 15 petabytes to 103 gigabytes without giving up a single hostname. And I do want the hostnames, because a count you can't drill into is a count you can't check.</p>
<p>The hostname list isn't quite enough, though. Remember the shape of a <code>github.io</code> URL. The hostname tells you who published, and how many repositories they published lives on the <em>path</em>. So we'll read both: the hostname list for breadth, the columnar URL index for paths.</p>
<h2>Two ways to query Common Crawl with DuckDB</h2>
<p>First we need to know what to query.</p>
<h3>1. Query Common Crawl on S3</h3>
<p>All Common Crawl data sits in S3, free to read, and it is Hive partitioned, so querying several crawls at once costs you one glob.</p>
<pre><code class="language-sql">from read_parquet('s3://commoncrawl/cc-index/table/cc-main/warc/crawl=CC-MAIN-2026-*/subset=warc/*.parquet', union_by_name = true)
where url_surtkey like 'com,motherduck)%'
limit 10000
</code></pre>
<p>That returns every MotherDuck page in the 2026 crawls in about 7 seconds. <code>url_surtkey</code> is the sort key, so DuckDB reads the Parquet row-group statistics and skips nearly every file. No cluster to start, no pool of servers, just a small DuckDB instance. The full scan back to 2008 takes three to four minutes.</p>
<p>Note that you will need a (free) AWS account with an <a href="https://motherduck.com/docs/integrations/cloud-storage/amazon-s3/">S3 access key</a> to make this work. If you don't want to do that you can also query directly over HTTP. For the rest of the article I'll use S3.</p>
<h3>2. Query Common Crawl over HTTP</h3>
<p>If you don't want to use S3, you can still query Common Crawl. DuckDB uses HTTP range headers to download only the parts of the Parquet file it needs. With HTTP you cannot glob using the <code>*</code> as you would with S3, so you have to get all the actual paths of the Parquet files first.</p>
<pre><code class="language-sql">-- store all Parquet files as a list
set variable index_files = (
  select list('https://data.commoncrawl.org/' || path)
  from read_csv([
      'https://data.commoncrawl.org/crawl-data/CC-MAIN-2025-38/cc-index-table.paths.gz',
      'https://data.commoncrawl.org/crawl-data/CC-MAIN-2026-34/cc-index-table.paths.gz'
    ],
    header = false,
    columns = {'path': 'STRING'})
  where path like '%subset=warc%'
);

-- access all Parquet files in the list
from read_parquet(getvariable('index_files'), union_by_name = true)
where url_surtkey like 'com,motherduck)%'
limit 10000;
</code></pre>
<h2>The extraction: pulling hostnames out of the web graph</h2>
<p>First, the list of platforms to look for. Swap in any you like. I picked the ones I could name off the top of my head, plus a reference group I'll come back to in the analysis.</p>
<pre><code class="language-sql">create or replace table your_db.commoncrawl.platforms as
select * from (values
  ('base44.app',      'app.base44',      'Base44',                      'platform'),
  ('bolt.host',       'host.bolt',       'Bolt',                        'platform'),
  ('deno.dev',        'dev.deno',        'Deno Deploy',                 'platform'),
  ('firebaseapp.com', 'com.firebaseapp', 'Google Firebase',             'platform'),
  ('web.app',         'app.web',         'Google Firebase',             'platform'),
  ('fly.dev',         'dev.fly',         'Fly.io',                      'platform'),
  ('framer.app',      'app.framer',      'Framer',                      'platform'),
  ('framer.website',  'website.framer',  'Framer',                      'platform'),
  ('github.io',       'io.github',       'GitHub Pages',                'platform'),
  ('gitlab.io',       'io.gitlab',       'GitLab Pages',                'platform'),
  ('glitch.me',       'me.glitch',       'Glitch',                      'platform'),
  ('herokuapp.com',   'com.herokuapp',   'Heroku',                      'platform'),
  ('lovable.app',     'app.lovable',     'Lovable',                     'platform'),
  ('neocities.org',   'org.neocities',   'Neocities',                   'platform'),
  ('netlify.app',     'app.netlify',     'Netlify',                     'platform'),
  ('onrender.com',    'com.onrender',    'Render',                      'platform'),
  ('pages.dev',       'dev.pages',       'Cloudflare',                  'platform'),
  ('workers.dev',     'dev.workers',     'Cloudflare',                  'platform'),
  ('railway.app',     'app.railway',     'Railway',                     'platform'),
  ('replit.app',      'app.replit',      'Replit',                      'platform'),
  ('replit.dev',      'dev.replit',      'Replit',                      'platform'),
  ('streamlit.app',   'app.streamlit',   'Streamlit',                   'platform'),
  ('surge.sh',        'sh.surge',        'Surge',                       'platform'),
  ('v0.app',          'app.v0',          'Vercel (v0)',                 'platform'),
  ('v0.dev',          'dev.v0',          'Vercel (v0)',                 'platform'),
  ('vercel.app',      'app.vercel',      'Vercel',                      'platform'),
  ('webflow.io',      'io.webflow',      'Webflow',                     'platform'),

  -- the old guard, as a sanity check that the crawl itself isn't just growing
  ('blogspot.com',    'com.blogspot',    'Blogspot',                    'reference'),
  ('medium.com',      'com.medium',      'Medium',                      'reference'),
  ('myshopify.com',   'com.myshopify',   'Shopify',                     'reference'),
  ('shopify.com',     'com.shopify',     'Shopify',                     'reference'),
  ('squarespace.com', 'com.squarespace', 'Squarespace',                 'reference'),
  ('substack.com',    'com.substack',    'Substack',                    'reference'),
  ('tumblr.com',      'com.tumblr',      'Tumblr',                      'reference'),
  ('weebly.com',      'com.weebly',      'Weebly',                      'reference'),
  ('wixsite.com',     'com.wixsite',     'Wix',                         'reference'),
  ('wordpress.com',   'com.wordpress',   'WordPress.com',               'reference')
) as t(domain, domain_rev, platform, kind);
</code></pre>
<p>Note the middle column. The web graph stores every name <em>reversed</em>, so <code>github.io</code> becomes <code>io.github</code> and <code>duckfan67.github.io</code> becomes <code>io.github.duckfan67</code>. Everything under one platform therefore sorts together, and the platform a hostname belongs to is its first two labels. That is the join key we'll build in a moment. But first: the actual data. We'll create the table, then go through each release one by one and insert them into the created table.</p>
<pre><code class="language-sql">create or replace table your_db.commoncrawl.platform_hosts (
  release           varchar,
  release_end_date  date,
  domain_rev        varchar,
  host_rev          varchar,
  harmonicc_pos     bigint,
  harmonicc_val     double,
  pr_pos            bigint,
  pr_val            double
);

insert into your_db.commoncrawl.platform_hosts
with hosts as (
  select
    -- io.github.duckfan67 -> io.github, the reversed registered domain
    split_part(host_rev, '.', 1) || '.' || split_part(host_rev, '.', 2) as domain_rev,
    host_rev, harmonicc_pos, harmonicc_val, pr_pos, pr_val
  from read_csv(
    's3://commoncrawl/projects/hyperlinkgraph/cc-main-2026-apr-may-jun/host/cc-main-2026-apr-may-jun-host-ranks.txt.gz',
    delim = '\t',
    header = true,
    columns = {
      'harmonicc_pos' : 'bigint',
      'harmonicc_val' : 'double',
      'pr_pos'        : 'bigint',
      'pr_val'        : 'double',
      'host_rev'      : 'varchar'})
)
select
  'cc-main-2026-apr-may-jun', date '2026-06-30',
  domain_rev, host_rev, harmonicc_pos, harmonicc_val, pr_pos, pr_val
from hosts
where domain_rev in (select domain_rev from your_db.commoncrawl.platforms);
</code></pre>
<p>The join key has to be <em>derived</em>, which is the one bit of thinking in that query. Every platform on the list is a two-label domain, so the first two labels of a reversed hostname are the reversed domain, and DuckDB can hash-join that against the platform list instead of testing 37 patterns per row.</p>
<p>One release takes three to six minutes and lands 10 to 14 million rows, scaling with the size of the gzip. Sixteen of them, run one after another: 103GB read, 64 minutes wall clock, 190,685,102 rows kept. That is the entire compute bill for this post, because the actual analysis queries in MotherDuck are counted in milliseconds rather than minutes.</p>
<h3>Backfilling the web graph with a MotherDuck Flight</h3>
<p>Now that we have the model for backfilling the 3-month spanning web graphs, we won't be running 16 separate queries ourselves. Because the same job runs once per release, this is a natural fit for a <a href="https://motherduck.com/docs/key-tasks/flights/">Flight</a>, a small Python job that runs on MotherDuck compute on a schedule. The <code>where release not in (select release from ...)</code> guard makes it idempotent, so you can re-run it and it only fetches what's missing. The full flight code is in the <a href="https://motherduck.com/docs/cookbook/">MotherDuck cookbook</a>.</p>
<p><code>cc-main-202*</code> seems like an easy one-liner to get all releases, but since 2024 Common Crawl publishes the web graph as a <em>rolling</em> three-month window, released monthly. <code>cc-main-2025-jul-aug-sep</code>, <code>cc-main-2025-aug-sep-oct</code> and <code>cc-main-2025-sep-oct-nov</code> share two thirds of their input. Glob them all and you download 40 files, 250GB of gzip, for maybe 13 independent data points.</p>
<p>We'll pick one release per quarter and pin the names to make our backfill consistent. Some sets leap over into the next year (<code>cc-main-2022-23-sep-nov-jan</code>, for example); we'll take those as a good enough representation of the underlying quarter.</p>
<pre><code>cc-main-2021-feb-apr-may     cc-main-2024-apr-may-jun   cc-main-2025-jul-aug-sep
cc-main-2021-jun-jul-sep     cc-main-2024-jul-aug-sep   cc-main-2025-oct-nov-dec
cc-main-2021-22-oct-nov-jan  cc-main-2024-oct-nov-dec   cc-main-2026-jan-feb-mar
cc-main-2022-may-jun-aug     cc-main-2025-jan-feb-mar   cc-main-2026-apr-may-jun
cc-main-2022-23-sep-nov-jan  cc-main-2025-apr-may-jun
cc-main-2023-mar-may-oct
cc-main-2023-24-sep-nov-feb
</code></pre>
<p>If you'd rather not fetch all sixteen releases yourself, attach the share I prepared:</p>
<pre><code class="language-sql">ATTACH 'md:_share/commoncrawl_platforms_public/96fe0b63-45b0-4775-be4e-9bfcff677311' AS commoncrawl_platforms;
from commoncrawl_platforms.main.platform_hosts limit 10;
</code></pre>
<h2>The analysis: growth relative to the old free-hosting web</h2>
<p>We cannot assume that every crawl covers the exact same parts of the internet. Even though the web graph already covers 3 months of crawls, we'll have to account for the fact that there is still sampling. Instead of looking at absolute numbers, then, we can analyse the <em>relative</em> presence of the tools. That is what the <code>reference</code> rows in the platform list are for. WordPress, Blogspot, Wix and friends are the boring, established part of the free-hosting web. If the crawl gets bigger, they get bigger too. If a platform grows <em>relative to them</em>, something real is happening.</p>
<p>The SQL for our analysis is relatively simple:</p>
<ul>
<li>take all the different platforms</li>
<li>group by platform and crawl date</li>
<li>count the number of hosts</li>
<li>compare the reference platforms to the 'new' platforms</li>
</ul>
<pre><code class="language-sql">with ranked as (
  select
    p.platform,
    p.kind,
    r.release_end_date,
    count(*) as hosts
  from your_db.commoncrawl.platform_hosts r
  join your_db.commoncrawl.platforms p using (domain_rev)
  group by all
),
baseline as (
  select release_end_date, sum(hosts) as reference_hosts
  from ranked where kind = 'reference'
  group by all
)
select
  platform,
  release_end_date,
  hosts,
  round(1000.0 * hosts / reference_hosts, 2) as hosts_per_1k_reference,
  round(100.0 * hosts / first_value(hosts) over (
    partition by platform order by release_end_date), 1) as indexed_to_first
from ranked
join baseline using (release_end_date)
where kind = 'platform'
order by platform, release_end_date;
</code></pre>
<h2>The first findings: how fast the vibe-coded web is growing</h2>
<p>To make our analysis a bit easier, I've built <a href="https://motherduck.com/dive-gallery/dives/the-vibe-coded-web-measured-common-crawl">a MotherDuck Dive</a> that compares the old free-hosting web (WordPress.com, Blogspot, and the rest of the gang) to the new platforms. I've grouped them into four categories.</p>
<ul>
<li>Visual site builders like Webflow or Framer</li>
<li>The full AI experience: Lovable, Replit, v0, Base44, Bolt</li>
<li>Frontend and edge hosting: Cloudflare, Vercel, Netlify</li>
<li>Developer-focused platforms: GitHub Pages, GitLab Pages, Streamlit, Heroku</li>
</ul>
<p>Every category is up and to the right, and the visual site builders lead, at 55.6 hostnames per 1,000 reference hostnames in June 2026. Webflow is most of that. The more recent vibe-coding trend shows up in frontend and edge hosting, which went from 2.6 to 47.3 over the same five years, and the AI app builders are the newest line on the chart: flat at zero until 2025, then 4.7 by mid-2026.</p>
<p>Common Crawl data has its downsides: it only counts crawled pages and pages with <em>inbound</em> links, not total sites built. It also doesn't crawl domains that deny access to bots, which more of them have done over the last few years. That explains the dip in crawled WordPress.com hostnames, for example. Even so, I think it's a reasonable proxy for how fast these platforms are growing.</p>
<p>Deselect the categories and pick individual platforms, and the story sharpens. Webflow is the line at the top. GitHub Pages grows steadily as you'd expect from the default answer of the last decade. Vercel grows steadily too, but Cloudflare Pages is the one nobody wrote about: from roughly nothing in 2023 to a peak above Vercel in late 2025, before settling back. Lovable barely registers on this scale, which is the sober version of the AI-builder story: plenty of new hostnames, none of them linked to by much yet.</p>
<p>Now switch the Dive to <strong>Absolute (hostnames)</strong> and add the established platforms back in, because in absolute numbers these platforms still pale compared to the big names.</p>
<p>WordPress.com alone fell from 6.0M crawled hostnames to under 2.0M over the five years, which is a bigger move in absolute terms than everything the new platforms added put together. Most of the relative growth in the first chart is the old web shrinking. What do you make of the difference in growth and decline? You now have the numbers and tools to answer your own questions.</p>
<h2>One user, many projects: querying 100 billion rows of URL index</h2>
<p>We have forgotten one thing though. <code>github.io</code> pages are not one user, one project. You can have many different projects based on different repositories in your GitHub account. I've written before about <a href="https://www.dumky.net/posts/youre-right-to-be-anxious-about-ai-this-is-how-much-we-are-building/">what the growth of GitHub and package registries looks like</a> during the AI boom. But we're not here to be lazy, we're here to query the internet. So let's query some paths.</p>
<p>We'll scan 100 billion rows in a couple of minutes, but did you know that for a long time, the fastest way to transfer 100 petabytes of data was <a href="https://aws.amazon.com/blogs/aws/aws-snowmobile-move-exabytes-of-data-to-the-cloud-in-weeks/">with an actual truck</a>?</p>
<p>So let's drop the web graph dataset and go back to the columnar URL index, because that is the only place where the actual path of a page is captured. And let me tell you, this is what we call going out with a banger. We are querying:</p>
<ul>
<li>5 years of data (2022-2026)</li>
<li>12,300 Parquet files</li>
<li>109,431,785,857 rows. That is MORE THAN 100 BILLION ROWS!</li>
</ul>
<p>Those two numbers come straight out of the Parquet footers, which is why counting 109 billion rows takes half a minute rather than half a day:</p>
<p><img src="https://motherduck-com-web-prod.s3.us-east-1.amazonaws.com/assets/img/cc_parquet_file_metadata_109_billion_rows_8216cd2e7b.png" alt="cc-parquet-file-metadata-109-billion-rows.png"></p>
<p>Of course reading all of it would take forever, but <code>url_surtkey</code> is the sort key of the index, so DuckDB reads the Parquet row-group statistics and skips almost every file without opening it. Parquet lets us cut the other way too: we only ask for ten of the index's columns, and a columnar format can skip the rest without reading a byte of them (as opposed to, say, Postgres or MySQL). This is also the reason why friends don't let friends <code>select *</code>.</p>
<pre><code class="language-sql">create or replace table your_db.commoncrawl.crawl_githubio as
select
  url,
  url_host_name,
  url_host_name_reversed,
  url_path,
  fetch_time,
  fetch_status,
  content_digest,
  content_mime_type,
  content_languages,
  crawl
from read_parquet([
    's3://commoncrawl/cc-index/table/cc-main/warc/crawl=CC-MAIN-2022-*/subset=warc/*.parquet',
    's3://commoncrawl/cc-index/table/cc-main/warc/crawl=CC-MAIN-2023-*/subset=warc/*.parquet',
    's3://commoncrawl/cc-index/table/cc-main/warc/crawl=CC-MAIN-2024-*/subset=warc/*.parquet',
    's3://commoncrawl/cc-index/table/cc-main/warc/crawl=CC-MAIN-2025-*/subset=warc/*.parquet',
    's3://commoncrawl/cc-index/table/cc-main/warc/crawl=CC-MAIN-2026-*/subset=warc/*.parquet'
  ], hive_partitioning = true, union_by_name = true)
where url_surtkey like 'io,github,%';
</code></pre>
<p>That is 16,353,324 rows kept out of 109 billion, across 41 crawls, and it takes a couple of minutes. The first path segment is the repository, and everything under it is one project no matter how deep the crawler went:</p>
<pre><code class="language-sql">create or replace view your_db.commoncrawl.githubio_projects as
select
  crawl,
  url_host_name,
  case
    -- /myrepo/docs/api.html -> myrepo; /about.html -> the user site itself
    when url_path = '/' or url_path not like '/%/%'
      then '(user site root)'
    else split_part(url_path, '/', 2)
  end as project
from your_db.commoncrawl.crawl_githubio
where fetch_status = 200;
</code></pre>
<p>Absolute counts still can't be compared across crawls, because the crawls themselves differ in size. But we can take the total row count per crawl as a reference point, and that one is cheap for the same reason: it only reads the metadata in the footer of each Parquet file, not the file itself.</p>
<pre><code class="language-sql">create or replace table your_db.commoncrawl.crawl_sizes as
select crawl, count(*) as total_pages
from read_parquet(
    's3://commoncrawl/cc-index/table/cc-main/warc/crawl=CC-MAIN-2025-*/subset=warc/*.parquet',
    hive_partitioning = true)
group by all;
</code></pre>
<p>One year of footers comes back in a few seconds. Run it five times, once per year, and you have the size of all 41 crawls. They sum to 109,431,785,857, which is the cheapest possible check that you globbed what you meant to glob. The crawls shrink as they go, from 2,986,392,030 pages in <code>CC-MAIN-2022-05</code> to 2,139,617,681 in <code>CC-MAIN-2026-34</code>.</p>
<h3>Two crawls per quarter, and always two</h3>
<p>One crawl is one sample, and for this question it is a thin one. Common Crawl ran two crawls in the third quarter of 2026. Each of them found about 47,179 distinct <code>user.github.io/repo</code> pairs. Pool the two and you get 79,976, a factor of 1.70. Two crawls three weeks apart overlap far less than you would guess, so a second crawl buys most of a second crawl's worth of projects rather than a rounding error. That is the whole argument for pooling: a quarter sees more of the web than any crawl in it.</p>
<p>The catch is the release schedule. Common Crawl ran six crawls in 2022, five in 2023 but twelve in 2025. A quarter pooled from one crawl and a quarter pooled from three is a different type of measurement. We're not doing double blind testing here, but we do want some semblance of a meaningful statistic. So to accommodate we take exactly the two earliest crawls of every quarter that has two.</p>
<pre><code class="language-sql">create or replace view your_db.commoncrawl.crawl_pairs as
select
  crawl,
  total_pages,
  -- CC-MAIN-2026-34 means ISO week 34 of 2026
  year(crawl_start) || '-Q' || quarter(crawl_start) as quarter
from (
  select *,
    date_trunc('week', make_date(cast(split_part(crawl, '-', 3) as int), 1, 4))
      + to_days((cast(split_part(crawl, '-', 4) as int) - 1) * 7) as crawl_start
  from your_db.commoncrawl.crawl_sizes
)
qualify count(*) over (partition by quarter) >= 2
   and row_number() over (partition by quarter order by crawl) &#x3C;= 2;
</code></pre>
<p>That leaves 14 quarters, 2022-Q3 to 2026-Q3. 2022-Q1, 2022-Q2, 2023-Q1 and 2024-Q1 drop out with a single crawl each, and Common Crawl ran nothing at all in the third quarter of 2023. Now pool:</p>
<pre><code class="language-sql">with per_user as (
  select
    c.quarter,
    p.url_host_name,
    count(*)                                                             as urls,
    count(distinct project) filter (where project &#x3C;> '(user site root)') as n_projects
  from your_db.commoncrawl.githubio_projects p
  join your_db.commoncrawl.crawl_pairs c using (crawl)
  group by all
),

effort as (
  select quarter, sum(total_pages) as pages_crawled
  from your_db.commoncrawl.crawl_pairs
  group by all
)

select
  quarter,
  pages_crawled,
  count(*)                                        as user_sites,
  round(1e6 * count(*) / pages_crawled, 2)        as sites_per_million,
  round(1e6 * sum(n_projects) / pages_crawled, 1) as project_sites_per_million,
  round(1.0 * sum(n_projects) / count(*), 2)      as projects_per_user_site
from per_user join effort using (quarter)
group by quarter, pages_crawled   -- not `group by all`: pages_crawled sits inside an aggregate
order by quarter;
</code></pre>
<p>Weeks below are the two ISO weeks pooled into that quarter, so 2022-Q3 is <code>CC-MAIN-2022-27</code> plus <code>CC-MAIN-2022-33</code>. Every row is two crawls, so every row is the same instrument, and only the per-million columns are comparable down the table.</p>
<p>| Quarter | Weeks | Pages crawled | User sites | User sites per million | Project sites per million |
| --- | --- | ---: | ---: | ---: | ---: |
| 2022-Q3 | 27 + 33 | 5,698,299,922 | 40,008 | 7.02 | 20.9 |
| 2022-Q4 | 40 + 49 | 6,558,375,936 | 42,559 | 6.49 | 16.7 |
| 2023-Q2 | 14 + 23 | 6,259,207,381 | 45,369 | 7.25 | 16.8 |
| 2023-Q4 | 40 + 50 | 6,799,057,161 | 52,894 | 7.78 | 17.3 |
| 2024-Q2 | 18 + 22 | 5,496,678,032 | 44,185 | 8.04 | 18.5 |
| 2024-Q3 | 30 + 33 | 4,862,556,811 | 43,336 | 8.91 | 16.2 |
| 2024-Q4 | 42 + 46 | 5,183,002,501 | 47,030 | 9.07 | 17.7 |
| 2025-Q1 | 05 + 08 | 5,710,984,393 | 44,117 | 7.72 | 14.7 |
| 2025-Q2 | 18 + 21 | 5,224,501,712 | 43,087 | 8.25 | 13.9 |
| 2025-Q3 | 30 + 33 | 4,865,073,985 | 38,163 | 7.84 | 12.1 |
| 2025-Q4 | 43 + 47 | 4,911,269,769 | 40,645 | 8.28 | 12.9 |
| 2026-Q1 | 04 + 08 | 4,496,622,477 | 41,410 | 9.21 | 14.2 |
| 2026-Q2 | 17 + 21 | 4,356,077,177 | 54,850 | 12.59 | 20.6 |
| 2026-Q3 | 30 + 34 | 4,288,619,137 | 52,573 | 12.26 | 18.6 |</p>
<p><img src="https://motherduck-com-web-prod.s3.us-east-1.amazonaws.com/assets/img/cc_githubio_accounts_repos_per_million_f2538db667.png" alt="cc-githubio-accounts-repos-per-million.png"></p>
<p>Normalised for crawl size, distinct <code>github.io</code> user sites are up <strong>75%</strong> over the four years, 7.02 per million crawled pages to 12.26, and about half of that arrives in the last two quarters. Distinct <em>project</em> sites per million barely move, 20.9 to 18.6. More people, the same amount of stuff. Which points straight at the number in the last column of the pooled query, and that one needs a much harder look.</p>
<p>Note that the actual sites crawled on Github Pages is much lower than the total number of Github Pages sites in the web graph. The web graph also takes into account links, but not every link is crawled every time.</p>
<h2>Final results</h2>
<p>The platform web went from <strong>28 hostnames per 1,000 of the old free-hosting web in mid-2021 to 177 per 1,000 in mid-2026</strong>. 6.3x in five years and it keeps rising quarter-over-quarter including the quarters where the absolute platform count fell, because the crawl shrank faster than the platforms did. Normalised for crawl size, distinct <code>github.io</code> user sites are up <strong>75% in four years</strong>. The drop in projects per user is the crawler taking fewer URLs per host, not people publishing less: hold the crawler's effort constant and the number is flat.</p>
<p>More people are putting things on the internet. Whether that is the AI boom or just what happens when publishing gets cheap enough is a question for a different post, but the trend itself is unambiguous and all it took was a few SQL queries.</p>
<p>The part you should take away though is that you can build your own billion row analysis in no time. Common Crawl publishes roughly 15 petabytes across the crawls in this analysis, but the answer came out in gigabytes. The power of partitioned Parquet files and DuckDB means that you can do this analysis on your laptop instead of a cluster of servers.</p>
<h2>Reproduce it yourself</h2>
<p>Everything above is four tables, a few SQL queries and <em>a lot</em> of Parquet files.</p>
<ol>
<li><code>platforms</code>, the hand-written list of 27 platforms and 10 reference domains.</li>
<li><code>platform_hosts</code>, one <code>insert</code> per pinned web-graph release, three to six minutes each. The <a href="https://motherduck.com/docs/cookbook/">Flight in the cookbook</a> runs all sixteen and skips the ones you already have.</li>
<li><code>crawl_githubio</code>, one <code>read_parquet</code> over 12,300 Parquet files of the columnar URL index.</li>
<li><code>crawl_sizes</code>, one metadata-only <code>count(*)</code> per year, seconds each, and the denominator for everything normalised.</li>
</ol>
<p>The charts are the <a href="https://motherduck.com/dive-gallery/dives/the-vibe-coded-web-measured-common-crawl">Dive embedded above</a>, so you can switch between relative and absolute, pick your own platforms, and watch the numbers change when a new web-graph release lands.</p>
<p>If you want the numbers without the wait, attach the share. All four tables are in it, with <code>crawl_githubio</code> published as <code>githubio_pages</code>:</p>
<pre><code class="language-sql">ATTACH 'md:_share/commoncrawl_platforms_public/96fe0b63-45b0-4775-be4e-9bfcff677311' AS commoncrawl_platforms;
from commoncrawl_platforms.main.githubio_pages limit 10;
</code></pre>
<p>And if you want it to keep updating itself as new web-graph releases land, take the Flight from the cookbook and give it a monthly cron. Swap my platform list for yours, point the surtkey filter at a different domain, and the same two queries answer a different question about the internet.</p>
]]></content>
        <author>
            <name>Dumky de Wilde</name>
        </author>
    </entry>
    <entry>
        <title type="html"><![CDATA[dbt Charts on MotherDuck: Declarative Dashboards]]></title>
        <id>https://motherduck.com/blog/dbt-Charts-on-MotherDuck-Declarative-Dashboards</id>
        <link href="https://motherduck.com/blog/dbt-Charts-on-MotherDuck-Declarative-Dashboards"/>
        <updated>2026-09-21T00:00:00.000Z</updated>
        <summary type="html"><![CDATA[Define your dashboards in YAML with dbt Charts, then the same dbt build that runs your pipeline deploys them to MotherDuck Dives. Just 2 config changes! Your Dives will refresh live whenever your stakeholders take a look. See how we constructed the dbt package as well.]]></summary>
        <content type="html"><![CDATA[
<p>Last week at dbt Summit, dbt Labs launched <a href="https://github.com/dbt-labs/dbt-charts">Charts</a>. One week later and now you can publish those Charts to MotherDuck! Your dashboard definitions can live in git right next to your dbt pipelines. On MotherDuck, the dashboard experience is even better: your Charts become <a href="https://motherduck.com/product/dives/">Dives</a> that refresh live! Setting it up is incredibly simple and takes just 2 config changes.</p>
<p>So why dbt Charts? Charts provide a declarative syntax for dashboards. Sure those are fun words (SQL is declarative too after all!), but why does that help? It makes it easy for agents to write and humans to interpret at a glance. You can manage your dashboards in git just like your SQL, so you can update your visuals in the same PR that your data changes to keep things nicely in sync. Plus even though they are declarative, they still provide powerful interactivity.</p>
<p>How did we build this so quickly? In a word: Claude. In a few more words: the MotherDuck platform is so flexible, you can build just about anything. MotherDuck Dives are full React apps. We automatically host them for you in a sandbox with direct access to your MotherDuck data. That means they support a superset of what dbt Charts can provide and give you a blank canvas to build on. Customers create full apps in Dives, but they still work great for dashboards too.</p>
<p>As an example of a dbt board running on MotherDuck, have a look at this Dive:</p>
<blockquote>
<p>I apologize for the pie chart - avert your eyes! This was one of their examples…</p>
</blockquote>
<h2>Deploying in your projects</h2>
<p>Want to give it a <code>dbt build</code>? First, <a href="https://motherduck.com/docs/integrations/transformation/dbt/">connect your dbt project up to MotherDuck</a>. Then add a link to this <a href="https://github.com/motherduckdb/labs/tree/main/projects/dbt-charts-dives">git repo</a> in your <code>packages.yml</code> file and set <code>save_charts_as_dives: true</code> in <code>dbt_project.yml</code>.</p>
<p><img src="https://motherduck-com-web-prod.s3.us-east-1.amazonaws.com/assets/img/setting_the_dbt_package_up_6758a39a98.png" alt="setting-the-dbt-package-up.png"></p>
<blockquote>
<p>That’s it!</p>
</blockquote>
<p>The next time you build your project, your Charts will be published as MotherDuck Dives.</p>
<h2>How does the dbt package work?</h2>
<p>All of the complexity is nicely abstracted away thanks to dbt’s extensible package approach, but here is a bit of detail about what is going on under the hood.</p>
<h3>Three core components across SQL, Python, and TypeScript</h3>
<p><img src="https://motherduck-com-web-prod.s3.us-east-1.amazonaws.com/assets/img/three_parts_52bfd407ea.png" alt="three-parts.png"></p>
<p>There are 3 main pieces to the puzzle: SQL to kick things off in an <code>on-run-end</code> hook, Python that runs in MotherDuck’s <a href="https://motherduck.com/product/flights/">serverless Flights runtime</a>, and the TypeScript that powers the Dive visualization. There are a few other files in the package, but all are helpers for these 3 core tasks. For example, the Vega Lite plotting library needs to be bundled up before it is loaded into the TypeScript powering the Dive. All of that is nicely abstracted away by the dbt package.</p>
<p>This architecture mirrors MotherDuck’s architecture as well and is part of why this was straightforward to implement. Core data processing in MotherDuck tends to happen in SQL on our compute ducklings. Orchestration and integrating data from a variety of sources (including running dbt!) happens in Python with <a href="https://motherduck.com/product/flights/">Flights</a>. Visualization is TypeScript territory, and Dives use React to make that incredibly simple yet flexible. In an AI era where converting between languages is easier than ever, you can pick the right tool for the job all within the MotherDuck platform.</p>
<p>Let’s dig (Dive?) a little deeper into the flow of what happens when you kick off a <code>dbt build</code>.</p>
<h3>What happens at runtime?</h3>
<p><img src="https://motherduck-com-web-prod.s3.us-east-1.amazonaws.com/assets/img/runtime_lanes_00c2b62eec.png" alt="runtime-lanes.png"></p>
<p>First, your dbt DAG runs to update your data. When that run is about to complete, dbt kicks off an <code>on-run-end</code> hook to start the rest of this process.</p>
<p>That hook runs a SQL statement that ships in the dbt package. It loads your chart configurations into a MotherDuck table, along with the logic that is needed to transform those charts into Dives. That allows all of the logic to be encapsulated within the dbt package to make it easy to set up. Once the configurations are in MotherDuck, the <code>on-run-end</code> hook uses several other SQL statements to create and run a MotherDuck Flight. A Flight is a Python script that is run in a serverless fashion.</p>
<p>That Flight uses the Python logic within dbt-charts itself to convert your YAML configs into Vega Lite configs. The Flight then creates one Dive for each dashboard and publishes them to MotherDuck using our Dive management SQL functions.</p>
<p>Once the Flight is finished, the dbt job detects its completion and ends.</p>
<p>Then, any authorized user can visit each Dive in their browser and see your dashboards, freshly populated with the latest data.</p>
<p>The beauty of this approach is that it reuses the good work done by the fine folks behind dbt Charts - especially the compilation from YAML to a full dashboard.</p>
<h2>dbt Charts  MotherDuck Dives</h2>
<p>So if you want a dbt-governed approach to charts, we’ve got you covered! Your dashboard configuration can be as simple as a YAML file and can be version controlled in git alongside your dbt models. The same <code>dbt build</code> command that runs your pipeline will update your MotherDuck Dive visualizations as well. You can run those dbt models anywhere, including right on MotherDuck with a Python Flight. Thanks to Dives, you get the added benefit of live data refreshes.</p>
<p>Quack on! Jaffles look good on a dashboard too…</p>
]]></content>
        <author>
            <name>Alex Monahan</name>
        </author>
    </entry>
    <entry>
        <title type="html"><![CDATA[Introducing prompt_jev(): bringing Jev to Motherduck SQL]]></title>
        <id>https://motherduck.com/blog/motherduck-supports-jev</id>
        <link href="https://motherduck.com/blog/motherduck-supports-jev"/>
        <updated>2026-09-21T00:00:00.000Z</updated>
        <summary type="html"><![CDATA[Classify text in SQL with prompt_jev(), powered by TypeSafe's Jev. 100,000 rows labeled in 40 seconds for $0.50 at frontier-LLM accuracy. Live on paid plans.]]></summary>
        <content type="html"><![CDATA[
<p>Text classification in MotherDuck just got about 50x faster at about 1% of the cost. Today we're shipping an integration with <a href="https://typesafe.ai/blog/introducing-system-one-models-and-jev">Jev</a>, a new kind of AI model from TypeSafe AI. On a 100,000-row benchmark it matched frontier LLM accuracy in 40 seconds for fifty cents. The comparable LLM took more than half an hour and cost $37. When price gets that low and performance is this good, entire tables that were too expensive to handle are easily within reach.</p>
<p>TypeSafe describes the state of AI today as "databases before SQL”, where we first need to understand the database before we can build the universal language on top. Their pitch for Jev is a frontier-intelligence function call: unstructured state goes in, typed probabilistic decisions come out. We read that and thought, well, this fits right into the universal language of SQL. It can be framed as a function that takes a text column and hands back a label, a score, or a yes/no with a confidence score - exactly how scalar functions today. There is no need to parse the response, and so it's immediately ready to filter, join, and aggregate in the same statement.</p>
<p>This combination of speed, accuracy, and cost together is what makes new workloads viable. LLMs can already classify text, but running it across a million rows is slow enough and expensive enough it is hard to see the value. The alternative, training an encoder like BERT, means collecting labeled examples and maintaining your own model. This is a big bet for something that may not work until it’s close to prod ready. <code>prompt_jev()</code> is configured with a few sentences, runs at analytics speed, and is extremely cost effective for the rows it labels. Below, it pulls the main complaint out of a table of support transcripts:</p>
<pre><code class="language-sql">SELECT
    conversation_id,
    prompt_jev(
        transcript,
        'Identify the customer''s main complaint',
        choice := [
{label: 'billing', description: 'Payments, invoices, and refunds'},
{label: 'technical', description: 'Errors, outages, and integrations'},
{label: 'sales', description: 'Pricing and upgrades'},
{label: 'account', description: 'Cancellations and account administration'}
	  ]
    ) AS classification
FROM customer_conversations;
</code></pre>
<p>We think this is a very big deal for analytics. A database is, after all, an excellent place to store your million customer conversations. But it’s still really hard to figure out what your customers are complaining about. Before you can track which problems are getting worse, someone or something has to read those conversations and label them. Encoder models like BERT can efficiently classify over a large dataset, but first you have to collect labeled examples, fine-tune the model, and improve the model as new data comes in. This takes patience and expertise. On the other hand, LLMs enable you to just prompt for what you want instead, but running one across a meaningfully large dataset is slow, expensive, and error-prone.</p>
<p><code>prompt_jev()</code> gives you LLM-style ergonomics with encoder-style efficiency, all at analytics scale. Here are some comparisons that made us excited:</p>
<p>| model | rows/s | accuracy | Retail cost/100k | wall time at 100k rows |
| :---- | ----: | ----: | ----: | ----: |
| <strong>Jev</strong> | <strong>2,484</strong> | <strong>89%</strong> | <strong>$0.50</strong> | <strong>40s</strong> |
| gpt-4o-mini | 84 | 80% | $1.93 | 19m 45s |
| gpt-5-nano | 94 | 83% | $1.58 | 17m 49s |
| gpt-5.6-luna | 61 | 84% | $3.53 | 27m 25s |
| gpt-5.6-terra | 52 | 88% | $37.58 | 31m 59s |</p>
<p><em>We benchmarked on 100,000 articles sampled from the training split of <a href="https://huggingface.co/datasets/fancyzhx/ag_news">AG News</a>, the four-class news topic dataset introduced by <a href="https://arxiv.org/abs/1509.01626">Zhang, Zhao &#x26; LeCun (2015)</a>, scoring each model against the ground truth.</em></p>
<p>What really excited us was that it exceed existing models by >25x across cost, accuracy, and speed dimensions. Furthermore, tests at 1m and 10m rows yielded similar performance (and in some cases even faster than our baseline presented above).</p>
<blockquote>
</blockquote>
<p><code>prompt_jev()</code> is available on all paid MotherDuck plans. Pick a question you’ve been putting off and try it on your own data!</p>
<h2>Dive into Jev</h2>
<p>Use <a href="https://motherduck.com/docs/key-tasks/ai-and-motherduck/classify-text-with-prompt-jev/">our guide to learn how to use MotherDuck and Jev together</a> for classifying text. Or play around with the Dive below to see what is possible.</p>
<p></p>
<h2>Further Reading</h2>
<ul>
<li><a href="http://motherduck.com/docs/sql-reference/motherduck-sql-reference/ai-functions/prompt-jev/">MotherDuck docs on <code>prompt_jev</code></a></li>
<li><a href="https://motherduck.com/docs/key-tasks/ai-and-motherduck/classify-text-with-prompt-jev/">Guide: Classifying text with Jev on MotherDuck</a></li>
</ul>
<pre><code class="language-sql">-- 1) Load AG News (train split) straight from Hugging Face and draw the 100k sample
CREATE TABLE ag_train AS
SELECT row_number() OVER () AS id, text, label
FROM 'hf://datasets/fancyzhx/ag_news/data/train-00000-of-00001.parquet';

CREATE TABLE sample_100k AS
SELECT * FROM ag_train USING SAMPLE 100000 ROWS (reservoir, 43);

-- 2) Classify every row with prompt_jev
CREATE TABLE preds AS
SELECT id, label,
       prompt_jev(text,
                  'Classify the topic of this news article.',
                  choice := ['World', 'Sports', 'Business', 'Sci/Tech']) AS result
FROM sample_100k;

-- 3) Score against the dataset labels
CREATE MACRO ag_name(l) AS ['World', 'Sports', 'Business', 'Sci/Tech'][l + 1];

-- overall accuracy (NULLs reported separately, never scored as wrong)
SELECT count(*)                                              AS n,
       count(*) FILTER (WHERE result.choice IS NULL)         AS nulls,
       round(avg((result.choice = ag_name(label))::INT), 4)  AS accuracy,
       round(avg(result.confidence), 3)                      AS mean_confidence
FROM preds;

-- per-class precision, recall, F1
WITH c AS (
  SELECT ag_name(label) AS truth, result.choice AS pred FROM preds WHERE result.choice IS NOT NULL
), k AS (SELECT unnest(['World', 'Sports', 'Business', 'Sci/Tech']) AS class)
SELECT class,
       count(*) FILTER (WHERE truth = class AND pred = class) AS tp,
       count(*) FILTER (WHERE truth &#x3C;> class AND pred = class) AS fp,
       count(*) FILTER (WHERE truth = class AND pred &#x3C;> class) AS fn,
       round(tp / (tp + fp), 4) AS "precision",
       round(tp / (tp + fn), 4) AS recall,
       round(2 * tp / (2 * tp + fp + fn), 4) AS f1
FROM k CROSS JOIN c GROUP BY class ORDER BY class;

-- confusion matrix
PIVOT (SELECT ag_name(label) AS truth, result.choice AS pred FROM preds)
ON pred USING count(*) GROUP BY truth ORDER BY truth;
</code></pre>
]]></content>
        <author>
            <name>Hamilton Ulmer</name>
        </author>
    </entry>
    <entry>
        <title type="html"><![CDATA[DuckDB Ecosystem Newsletter : September 2026]]></title>
        <id>https://motherduck.com/blog/duckdb-ecosystem-newsletter-september-2026</id>
        <link href="https://motherduck.com/blog/duckdb-ecosystem-newsletter-september-2026"/>
        <updated>2026-09-16T00:00:00.000Z</updated>
        <summary type="html"><![CDATA[The September 2026 DuckDB Ecosystem Newsletter: DuckLabs joins AWS and MotherDuck acquires Tower, DuckDB v2.0-alpha lands, table functions in pure Java, bulk loads into SQL Server, Zarr stores as SQL tables, an infinite canvas for your data, plus a community spotlight on Vladimir Gribanov.]]></summary>
        <content type="html"><![CDATA[
<h2>HEY, FRIEND </h2>
<p>I hope you're doing well. I'm <a href="https://www.ssp.sh/">Simon</a>, and I am happy to share another monthly newsletter with highlights and the latest updates about DuckDB, delivered straight to your inbox.</p>
<p>In this September issue, I gathered the usual 10 updates, with the big two being the acquisitions (DuckLabs joins AWS, MotherDuck acquires Tower) and the upcoming 2.0 release, plus gains across the ecosystem, including table functions in pure Java, bulk loads into SQL Server, and Zarr for n-dimensional arrays, and the usual fun side project, such as an infinite canvas for your data.</p>
<h3>Acquisitions: <a href="https://ducklabs.com/news/2026/08/26/ducklabs-to-join-aws">DuckLabs to Join AWS</a>; <a href="https://motherduck.com/blog/motherduck-acquires-tower/">MotherDuck Acquires Tower</a></h3>
<p><strong>TL;DR</strong>: The two biggest ones first: AWS acquires DuckLabs, and MotherDuck acquires Tower.</p>
<p><strong>MotherDuck <a href="https://motherduck.com/blog/motherduck-acquires-tower/">acquired Tower.dev</a></strong> to integrate its runtime infrastructure into MotherDuck Flights, enabling AI agents to perform data engineering tasks and expose data as APIs. <a href="https://ducklabs.com/news/2026/08/26/ducklabs-to-join-aws"><strong>DuckLabs</strong></a><strong>, the company behind DuckDB, joins Amazon Web Services (AWS)</strong>, with its core open-source projects (DuckDB, DuckLake, Quack) remaining under the MIT license and stewarded by the DuckDB Foundation.</p>
<p>The <a href="https://news.ycombinator.com/item?id=49448321">HN consensus</a> is a mix of concern and cautious optimism, given the independent foundation and MIT-licensed code. Read <a href="https://motherduck.com/blog/duckdb-amazon/">Jordan's comment</a> on how MotherDuck thinks about it.</p>
<h3><a href="https://duckdb.org/2026/09/02/try-duckdb-20-alpha">Try DuckDB v2.0-alpha</a>, and Upcoming Features</h3>
<p><strong>TL;DR</strong>: DuckDB v2.0-alpha (code-named Cyanoptera) is available, featuring a feature freeze, bug fixing, and preparation for an October release.</p>
<p>Key updates include the <strong>quack extension moving to v1.0</strong>, promising higher throughput for both server-to-client and client-to-server communication. The CLI and Python library have alpha releases available.</p>
<p>As a recap, the <a href="https://duckdb.org/2026/08/17/duckdb-20-highlights">Preview of DuckDB v2.0</a> introduces a client/server mode via Quack and <code>CONNECT</code>, a new PEG-based SQL parser, a revised C API for extensions, and a new default storage format. Check out Mehdi's take on <a href="https://motherduck.com/blog/why-duckdb-20-is-faster/">Why DuckDB 2.0 is faster</a> (or <a href="https://www.youtube.com/watch?v=9s4n_j-Uv1k">video</a>): async I/O for S3, a rewritten recursive CTE engine, and a more efficient VARIANT data type.</p>
<h3><a href="https://github.com/immannino/sql.garden">sql.garden: An infinite canvas for your data</a></h3>
<p><strong>TL;DR</strong>: sql.garden is an open-source, Wails-based infinite canvas for data exploration that leverages an in-process DuckDB instance and the Model Context Protocol (MCP) for autonomous AI interaction.</p>
<p>Tony built it with a Go backend and Vue 3 frontend, querying Parquet, CSV, and JSON files at native speed alongside Postgres and MySQL connections. It imports data directly via <code>s3://</code> URIs, offers a WebAssembly build for browser-based sandboxing, and ships an embedded MCP server. Try the <a href="https://sql.garden/sandbox/">demo in the browser</a>.</p>
<h3><a href="https://duckdb.org/2026/08/25/table-functions-in-java">DuckDB Table Functions in Java</a></h3>
<p><strong>TL;DR</strong>: The DuckDB Java client now supports registering table functions in pure Java, allowing developers to query any JVM-accessible data source directly via SQL without native C++ extensions.</p>
<p>Geertjan and Alex show heterogeneous joins between remote systems like MongoDB and local files using the <code>DuckDBFunctions.tableFunction()</code> builder. The implementation follows a vectorized lifecycle: <code>bind</code> defines the output schema, <code>init</code> establishes the connection state, and <code>apply</code> streams data into a <code>DuckDBDataChunkWriter</code> in 2048-row batches. Source-side <strong>predicate pushdown</strong> works by passing <strong>native filters</strong>, such as <code>FROM mongo_query('coll', '{ "status": "shipped" }', ...)</code>, directly to vendor SDKs. Because functions run in-process, they eliminate intermediate export steps, giving engineers a high-performance path to integrate proprietary data sources or SOAP/REST services.</p>
<h3><a href="https://sh.reddit.com/r/DuckDB/comments/1wbh7mn/i_put_duckdb_behind_the_file_viewer_in_my_ide_a/">I put DuckDB behind the file viewer in my IDE: a 1B row, 29 GB Parquet opens in about a second</a></h3>
<p><strong>TL;DR</strong>: A new JetBrains IDE plugin leverages DuckDB's engine to provide near-instant visualization of billion-row Parquet, Avro, and ORC files with full schema support.</p>
<p>Less-Entertainer on Reddit built the <strong>Parquet, Avro &#x26; ORC Viewer</strong> because existing viewers render nested types or string columns as raw byte arrays. A 29 GB Parquet file with 1B rows opens in about 1039ms, and paging to the end takes roughly 800ms. Version 0.1.1 added cell editing, but an edit rewrites the whole file, 17 minutes on that 29 GB one. A not-yet-shipped branch has DuckDB rebuild only the affected row group and splice it back in, bringing that down to 1.8 seconds. JetBrains user? Check out the <a href="https://plugins.jetbrains.com/plugin/33899-parquet-avro--orc-viewer">plugin</a>.</p>
<h3><a href="https://medium.com/@gribanov.vladimir/the-plp-tax-and-seven-other-levers-optimizing-bulk-loads-into-sql-server-with-duckdb-da549a338f3e">Optimizing Bulk Loads into SQL Server with DuckDB</a></h3>
<p><strong>TL;DR</strong>: The DuckDB MSSQL extension v0.2.3 optimizes bulk loading into SQL Server through parallel writers and schema-aware target shaping, reducing ingestion times for 38M rows from 933s to 96s.</p>
<p>Vladimir's (our featured member this month) primary bottleneck is the "PLP tax": unsized strings default to <code>NVARCHAR(MAX)</code>, forcing data through a slower LOB path. Explicitly casting to <code>MSSQL_NVARCHAR(200)</code> gives a 2.45× speedup. <code>SET mssql_copy_parallel_writers = 8</code> scales ingest across sessions, and the <code>mssql_copy_flush_rows</code> default of 102,400 lets rows bypass the delta store for direct compressed rowgroup entry. Raising <code>mssql_tds_packet_size</code> to 16,384 reduces client CPU usage by 27%.</p>
<h3><a href="https://streambed.dev/blog/ducklake-target-support/">The small-file problem gets worse with CDC</a></h3>
<p><strong>TL;DR</strong>: Vignesh describes Streambed's shift from Apache Iceberg to DuckLake to solve the small-file problem in Postgres-to-DuckDB CDC pipelines.</p>
<p>Frequent small commits from the Postgres WAL create metadata overhead and high object counts in Iceberg. DuckLake stores catalog metadata in a database like DuckDB or SQLite rather than in object-store files, which slims down the <code>Postgres WAL → Streambed → DuckDB</code> write path. <a href="https://github.com/viggy28/streambed/blob/main/docs/benchmarks/ducklake-vs-iceberg.md">Benchmarks</a> for 1M rows with 100k updates at <code>flush=1,000</code> showed DuckLake with DuckDB finishing in 6,576 ms (405 objects) versus Iceberg COW's 269,344 ms (806 objects). Less commit work per batch means fresher analytical replicas.</p>
<h3><a href="https://github.com/xqlsystems/duckdb-zarr">duckdb-zarr: Query Zarr stores with SQL directly from DuckDB</a></h3>
<p><strong>TL;DR</strong>: duckdb-zarr is a Rust-based extension enabling DuckDB to query Zarr stores (an open format for chunked, compressed, N-dimensional arrays) directly using SQL, supporting both local files and remote object storage like S3 and GCS.</p>
<p>Alex and Dave implemented <code>read_zarr()</code>, <code>read_zarr_metadata()</code>, and <code>read_zarr_groups()</code>. Users can select specific arrays with <code>array_path='0'</code> or define dimensions with <code>dims=['time','lat','lon']</code>, and S3/GCS credentials come from DuckDB's secrets manager. Multi-dimensional scientific datasets become relational tables without an external query engine, which simplifies spatial and climate data analysis.</p>
<h3><a href="https://lakeops.dev/blog/duckdb-iceberg-lakehouse-guide">DuckDB for Apache Iceberg</a></h3>
<p><strong>TL;DR</strong>: Rob explains how DuckDB v1.5.3 enables full read/write lifecycle management for Apache Iceberg tables through REST catalogs and native V3 support without requiring a distributed cluster.</p>
<p>The release unlocks <code>MERGE INTO</code>, <code>ALTER TABLE</code>, and Iceberg V3 features like <code>VARIANT</code> types and <code>TIMESTAMP_NS</code> precision. Integration goes through <code>ATTACH 'uri' AS my_lake (TYPE ICEBERG)</code>, supporting REST, Glue, and S3 Tables. Performance relies on vectorized execution and metadata-driven pruning, but merge-on-read introduces "delete-file debt" and small-file I/O bottlenecks that degrade latency. DuckDB starts in milliseconds, yet query speed is dictated by table layout, so compaction and table maintenance still have to run outside DuckDB.</p>
<h3><a href="https://tracewayapp.com/blog/sqlite-vs-duckdb">SQLite vs DuckDB on the same $16 box: every cliff moved 100x</a></h3>
<p><strong>TL;DR</strong>: Jovan benchmarked DuckDB against SQLite for observability data, finding that DuckDB moves "read cliffs" 100x further while increasing write throughput on identical $16 hardware.</p>
<p>As Traceway's embedded storage engine, DuckDB reached 254,242 metrics/sec (4x) and 75,225 logs/sec (15x). DuckDB's columnar engine served metrics dashboards at 100M rows with a 3.0s median latency, while spans and logs hit their "cliff" at 10M rows. The benchmark ran with a 4 GB <code>DUCKDB_MEMORY_LIMIT</code>, while the compose file ships 2 GB. The takeaway: for single-node self-hosting, DuckDB is the better choice for high-volume logs and metrics.</p>
<h3><a href="https://www.bigdataldn.com/">Big Data London</a></h3>
<p><strong>2026-09-23. h: 09:00. Olympia, London, UK</strong></p>
<h3><a href="https://luma.com/mother-bdl">Duck In, Duck Out: London Edition</a></h3>
<p><strong>2026-09-23. h: 19:00. London, UK</strong></p>
<h3><a href="https://luma.com/mother-x5x8">Virtual Workshop: Build a Data Agent in 60 Minutes</a></h3>
<p><strong>2026-10-01. h: 09:00 PT. Online</strong></p>
<h3><a href="https://partiful.com/e/ZVpoCf7Cu8AZyRSGekcv?c=xzOjlvTr">Ship, Scale, Sail - #SFTechWeek</a></h3>
<p><strong>2026-10-05. h: 18:15. San Francisco Bay, CA</strong></p>
<h3><a href="https://www.dataoutpost.ai/">Data Outpost 2026</a></h3>
<p><strong>2026-11-05. h: 08:30. Convene 100 Stockton, San Francisco, CA</strong></p>
]]></content>
        <author>
            <name>Simon Späti</name>
        </author>
    </entry>
</feed>