---
title: "Build a dashboard to monitor your python package usage with DuckDB & MotherDuck"
canonical: "https://motherduck.com/blog/duckdb-dashboard-e2e-data-engineering-project-part-3/"
related:
  - title: "DuckDB & dataviz | End-To-End Data Engineering Project (3/3) | MotherDuck"
    url: "https://motherduck.com/videos/duckdb-dataviz-end-to-end-data-engineering-project-33/"
  - title: "DuckDB & Python : end-to-end data engineering project"
    url: "https://motherduck.com/blog/duckdb-python-e2e-data-engineering-project-part-1/"
  - title: "PyPi Data | MotherDuck Docs"
    url: "https://motherduck.com/docs/getting-started/sample-data-queries/pypi/"
---

# Build a dashboard to monitor your python package usage with DuckDB & MotherDuck

<style type="text/css">
.smaller-image img {
  width: 200px !important;
  max-width: 100%;
}
.smaller-animation img {
  width: 500px !important;
  max-width: 100%;
}
</style>

When building open-source projects, it's essential to be able to track usage metrics.
While GitHub stars are rather vanity metrics, there are other ways to measure how people use what you've built. 

Specifically, when building a Python library and pushing it to [PyPI](https://pypi.org/), you can actually get a ton of information about the download usage and your users' setup (version, architecture, and so on).

In this blog, we'll build a dashboard that helps you do that. We'll use DuckDB and MotherDuck to process and store the data and a Business Intelligence (BI) as a code tool called [Evidence](https://evidence.dev/) for the data visualization.
We'll focus on getting insights about the `duckdb` Python package, but the entire code is available and flexible so that you can run your own pipelines on any given package you would like to monitor.

The full code source is on [GitHub](https://github.com/mehd-io/pypi-duck-flow) and you can check the [live demo ](http://duckdbstats.com/)of what we are going to build.

<div class="smaller-animation">
<img src="https://motherduck-com-web-prod.s3.amazonaws.com/assets/img/demo_dashboard_12_0ec579e713.gif" alt="demo-animation" width="500">
</div>

If you prefer watching over reading, I've got also a video for you.

<iframe width="560" height="315" src="https://www.youtube.com/embed/ta_Pzc2EEEo" title="YouTube video player" frameborder="0" allow="accelerometer; autoplay; clipboard-write; encrypted-media; gyroscope; picture-in-picture; web-share" allowfullscreen style="margin-bottom: 15px"></iframe>

## Architecture and recap

This blog is part of a series, and to help you understand the context, we'll do a quick recap of parts 1 and 2.

[In the first blog](https://motherduck.com/blog/duckdb-python-e2e-data-engineering-project-part-1/), we covered the ingestion of raw PyPI data. This was using Python pipelines and ingesting data through DuckDB to easily process and write results to either an object storage like AWS S3 or directly into MotherDuck.

[In the second part](https://motherduck.com/blog/duckdb-dbt-e2e-data-engineering-project-part-2/), we used [dbt](https://www.getdbt.com/) to define a simple model and transform our raw data into an actionable dataset that would be used for our dashboard.

![arch](https://motherduck-com-web-prod.s3.amazonaws.com/assets/img/etl_architecture_938c31d577.png)

We assume that you already have the data needed to start building the dashboard, as we'll only focus on this, not ingesting or pre-processing the data. 
But don't worry if you didn't do the first parts; the data will be ready for you to query!

## Prerequisite
When building an analytical dashboard, you typically need to have two things : 
* The data
* A query engine, typically an OLAP database

Why the latter one? An interactive dashboard will often create behind-the-scenes queries. For instance, when you change a filter to display results, these queries need to be performed somewhere. As they are typically analytical queries involving `group by`, `sum`, etc., OLAP databases like BigQuery, Snowflake, or MotherDuck fit the best for these use cases.

Note that this is not specific to the BI tool we'll be using. Others, like Tableau and PowerBI, all rely on an external query engine to display the data.

## Store and share data in MotherDuck
MotherDuck is a serverless analytics platform powered by DuckDB. It means that anywhere you can run DuckDB, you can run MotherDuck and leverage the power of the cloud.

To build this dashboard, we[ created a share in Motherduck named `duckdb_stats`](https://motherduck.com/docs/getting-started/sample-data-queries/pypi) that you can use directly. 

A *share* is a database that you can easily share, or rather `ATTACH`, to use the appropriate DuckDB term, from any DuckDB client.
To access the shared database we prepared for you, you need to have 
1) A MotherDuck account: we have a free tier that you can use, so go ahead and [sign up](https://app.motherduck.com/?auth_flow=signup).
2) The shared URL (see below)

Once you are connected, you can attach the share with the following command: 

```
ATTACH 'md:_share/duckdb_stats/507a3c5f-e611-4899-b858-043ce733b57c' AS duckdb_stats;
```

Of course, you can query the shared database from any DuckDB client, which would be Python, Node.JS, and [many more](https://duckdb.org/docs/api/overview)!

Let's take a quick look at how this would work using the DuckDB CLI.

Assuming I have my MotherDuck account and the shared URL, the only extra thing I need is the MotherDuck token to authenticate to MotherDuck. You can find this one in the MotherDuck UI. In the top left, click on the organization name and then `Settings`.

![token_settings](https://motherduck-com-web-prod.s3.amazonaws.com/assets/img/creating_access_token_2fc85d2312ac20a5b88cd0a48b527839_2_1f2fcfbda7.jpg)

Tip: put your `motherduck_token` as an environment variable so that you can connect directly to MotherDuck using the `ATTACH 'md:'` when using the DuckDB CLI.

<video width="600" height="600" loop autoplay muted playsinline style="border: 2px solid rgb(56, 56, 56); margin-bottom: 24px;max-width: 100%; height: auto">
  <source src="https://motherduck-com-web-prod.s3.amazonaws.com/assets/img/demo_share_cli_463830eb3c.mp4" type="video/mp4">
  Your browser does not support the video tag.
</video>

I can then query my cloud databases directly in MotherDuck 🎉

Note that the Bi as code tool we are going to use, Evidence, uses the same mechanism to authenticate to MotherDuck. DuckDB in Node.js will connect to MotherDuck, and the only thing we'll need to configure in Evidence is the MotherDuck token.

Let's now draw some charts.
## Building the dashboard.

MotherDuck supports multiple other dashboarding tools, you can check the full list on our [documentation website](https://motherduck.com/docs/category/business-intelligence-tools/). 

#### About Evidence

Evidence is an open-source framework for building dashboards using Markdown and SQL. In the end, you get a Node.js Javascript app you can deploy anywhere or through Evidence Cloud.
It's great because it helps you enforce software engineering best practices. Our dashboard will be versioned. We will have a clear view of the source's queries, and we could deploy it to multiple environments, mainly development and production.

To build the dashboard, you can start from a [MotherDuck template](https://github.com/evidence-dev/evidence-motherduck-template) provided by Evidence.
A typical Evidence folder structure will look like this : 

* `pages` : where you'll build your dashboard using SQL & Markdown.
* `sources`
	* connection : where settings of your connection (here MotherDuck token) will be stored.
	* source query : you'll write your source query that will feed your dashboard
* `evidence.plugins.yaml` : specifying plugins like source connector

To run the template, you will need to : 
* `npm install` to install the Node.js dependencies
* `npm run dev` to start a local server

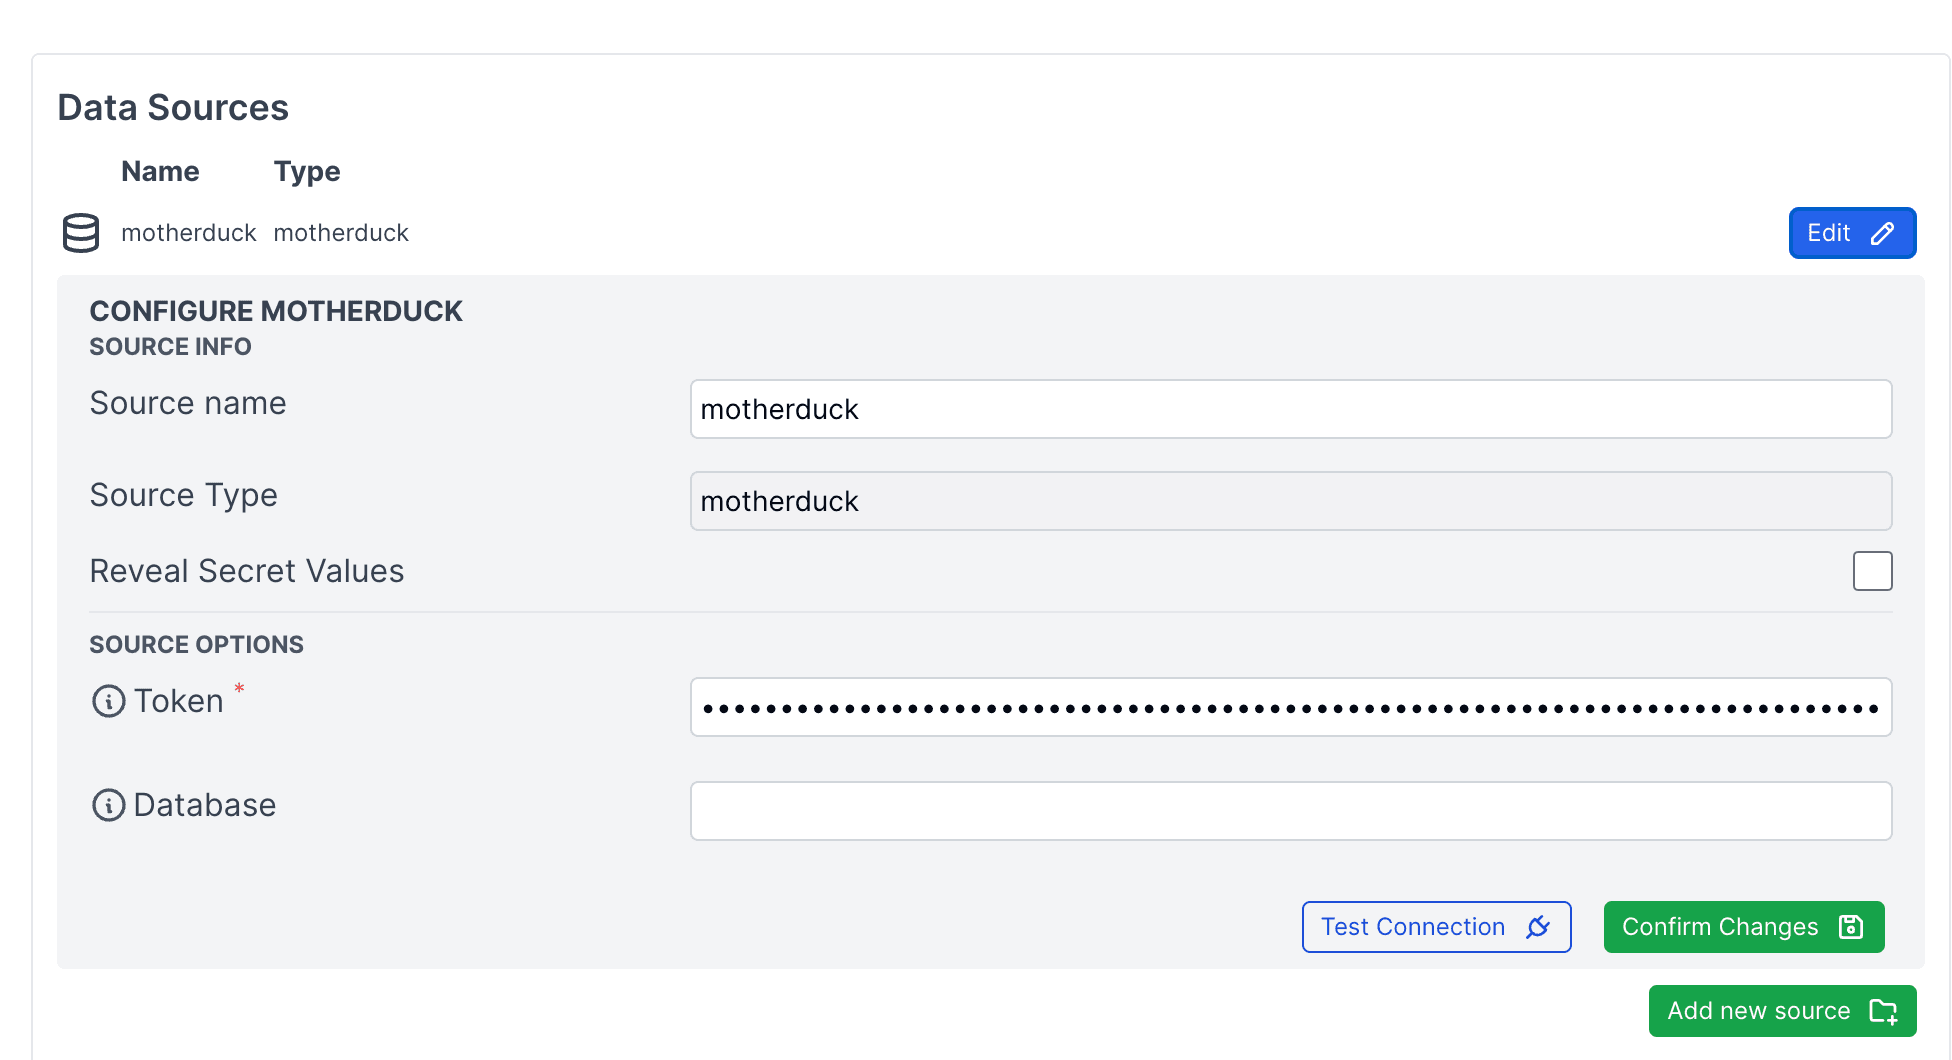
Once the server is started, head over to the settings page (usually at `localhost:3000/settings`)

<img src="https://motherduck-com-web-prod.s3.amazonaws.com/assets/img/settings_9706b7d755.png" />

Save your MotherDuck token there, and you'll see some charts already there.
This example uses a MotherDuck share, which is available by default for all users under the `sample_database` database.

For our dashboard, we'll use a dedicated share called `duckdb_stats`.

### Building a PyPI dashboard

Now that we understand how the basic template works and we are connected to MotherDuck, let's create some basic charts based on the data on the `duckdb` Python package.
I'll walk you through 2 examples :  A big value component and a line chart.
Note that Evidence provides much more charts component on their [documentation website](https://docs.evidence.dev/components/all-components/).

#### Defining the source query

We'll define a source query that will feed our charts.
This needs to be located under `sources/motherduck/`. We'll compute weekly downloads as the source table gives us daily downloads but we don't need that level of granularity, so we'll aggregated it to fetch less data and have better performance in general on our dashboard.
The file name will be the table name that we point to in our `.md` file.

Here's the content of `sources/motherduck/weekly_download.sql`
```
SELECT 
    DATE_TRUNC('week', download_date) AS week_start_date,
    version,
    country_code,
    python_version,
    SUM(daily_download_sum) AS weekly_download_sum 
FROM 
   duckdb_stats.main.pypi_daily_stats 
GROUP BY 
    ALL
ORDER BY 
    week_start_date
```

Few comments : 
* The `DATE_TRUNC` function simplifies handling dates by returning the start date of the week. This makes it easier to read and understand than just a week number. Additionally, it allows for straightforward grouping by week.
* `GROUP BY ALL` is a handy feature in DuckDB that makes SQL queries easier. You don't have to list each column you want to group by—this feature does it for you. It also makes your queries easier to change later. Other databases [have started to implement this function too.](https://www.linkedin.com/posts/mehd-io_sql-activity-7168265860292280320-F_0l?utm_source=share&utm_medium=member_desktop)

#### Adding the charts in the markdown file
Building a chart is a 2 steps processes, everything in Markdown.: 
* Defining the SQL query
* Using the chart component

We'll have one page, the markdown file is located at `/pages/index.md`.

**Big Value chart**

The query will look like this : 

![sqlsum](https://motherduck-com-web-prod.s3.amazonaws.com/assets/img/Screenshot_2024_07_15_at_12_20_03_71fade5814.png)

Each query is wrapped with the `sql <query_name>`. The query name is then used in the component :
```
<BigValue 
    title='Total download'
    data={total_download} 
    value='total' 
    fmt='#,##0.00,,"M"'	
/>
```

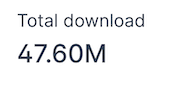
If you have your local server running (`npm run dev`), you should see your big value chart when visiting `localhost:3000`

<div  class="smaller-image">
<img src="https://motherduck-com-web-prod.s3.amazonaws.com/assets/img/big_value_8cbba87335.png" width="200" style="max-width: 200px;" alt="big value2">
</p>

### Line chart

We want a weekly download view for the line chart, so it's simple as a group by on the `week_start_date` we calculated from our source query

```
SELECT 
    week_start_date,
    SUM(weekly_download_sum) AS weekly_downloads
FROM 
    weekly_download
GROUP BY 
    week_start_date
ORDER BY 
    week_start_date DESC
```

The component is then : 
```
<LineChart data = {download_week} y=weekly_downloads x=week_start_date  />
```

And you should see a nice hockey stick : 

![hockey](https://motherduck-com-web-prod.s3.amazonaws.com/assets/img/Screenshot_2024_07_12_at_20_48_03_1008e4faba.png)

Another interesting feature is that you can chain SQL queries.
For instance, computing the last 4 weeks : 
```
```sql last_4_weeks
SELECT DISTINCT week_start_date
FROM 
    weekly_download
WHERE 
    week_start_date >= DATE_TRUNC('week', CURRENT_DATE - INTERVAL '4 weeks')
ORDER BY 
    week_start_date DESC
```

You can then refer to it in any query using the `${<name_of_the_query}`. Given this, if we want to compute over the last 4 weeks, we could do : 

```
SELECT 
	SUM(weekly_download_sum) as weekly_download_sum
FROM 
    weekly_download
WHERE 
    week_start_date IN (SELECT week_start_date FROM ${last_4_weeks})
```

Other features we didn't cover worth mentioning are the ability to use [filters](https://docs.evidence.dev/core-concepts/filters/) or[ if/else](https://docs.evidence.dev/core-concepts/if-else/) conditions, which are handy.

## Conclusion

In this last part of the end-to-end data engineering project using DuckDB, we built a dashboard using a BI-as-code tool and leveraged MotherDuck as our central data repository.

The series may be finished, but we could cover many other things. How do we orchestrate the pipelines? How do we do data observability and data quality?

Let me know what you would like to see and in the meantime, keep coding, keep quacking.