Watch Flight run progress with the Flight Explainer
The Flight Explainer is a live progress view of a Flight run: each step in your pipeline lights up as it runs, with its status, row count, duration, the tables or endpoints it touched, and any error. Use it when a Flight has several steps and you want to know which one failed or where the time went, without reading the raw log.
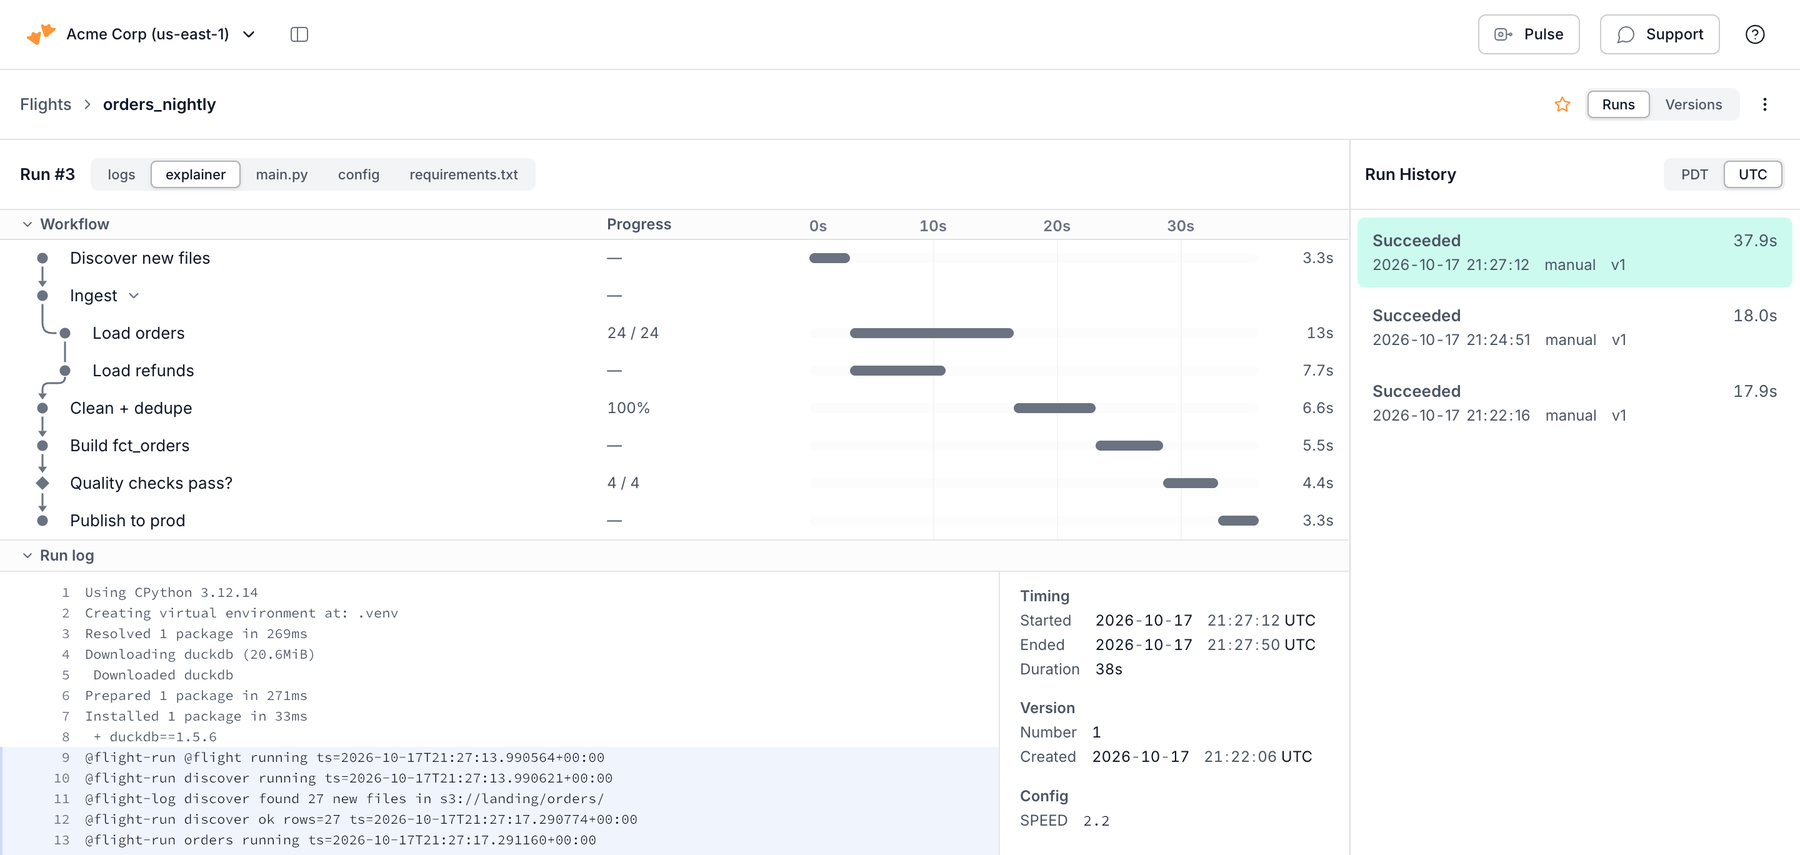
You instrument a Flight once, in two parts:
- A chart that declares the Flight's steps, as a Mermaid
flowchart. - Progress lines the Flight prints while it runs, one
@flight-runline each time a step changes state.
MotherDuck joins the two by step ID, so every node in the chart needs an explicit ID that its log lines repeat exactly. Every run of an instrumented Flight then renders in the Flight Explainer in the MotherDuck UI, through motherduck flight explain, and in your AI agent through the view_flight_run MCP tool.
Prerequisites
- A Flight you own. See Running Python with Flights to create one.
- For the CLI steps, the MotherDuck CLI.
- For the agent steps, an AI agent connected to the MotherDuck MCP Server.
The Flight Explainer reads the log the run already printed. Add the chart and the progress lines, then start a new run. A finished run keeps the chart from the version it executed, and it cannot grow progress lines after it ends.
Add a chart and progress lines with an AI agent
The fastest way to instrument an existing Flight is to have an AI agent do it. The agent reads the Flight's source, writes a chart that matches its steps, adds the @flight-run lines, and saves the result as a new version.
- MotherDuck UI
- MCP / AI agent
- Open the Flight from the Flights page and select a run.
- Select the explainer tab in the run pane. A Flight without a chart shows Your Flight doesn't support Explainer yet.
- Click Add Flight Explainer support with AI. The dialog contains a prompt that names the Flight and tells the agent to load the Flight Explainer guide and save the chart with
update_flight. Copy it into an AI agent connected to the MotherDuck MCP Server. - When the agent saves the new version, run the Flight again and open the explainer tab on the new run.
Ask your AI agent:
"Add a Flight Explainer to the
orders_nightlyFlight without changing what it does, save it as a new version, then run it and show me the run."
The agent calls get_flight_viz_guide to load the convention, reads the source with get_flight, saves the chart and progress lines with update_flight, triggers a run with run_flight, and opens it with view_flight_run. Coding agents with a terminal can read the same convention with motherduck flight guide --explainer.
Add a chart and progress lines by hand
Step 1: Write the chart
Declare one node per step, each with an explicit ID, a label, and a kind class that says what the step does:
flowchart TD
  extract[Pull orders from API]:::extract --> normalise[Flatten and cast]:::transform
  normalise --> load[Write to warehouse]:::load
  load --> verify{Row counts match?}:::check
  verify -->|ok| publish[Promote to prod]:::load
  verify -->|mismatch| quarantine(Park in staging)
| Construct | Form | Meaning |
|---|---|---|
| Box node | id[label] | A step labeled label. |
| Decision node | id{label} | A step that routes, marked with a diamond. |
| Edge | a --> b | b follows a. |
| Labeled edge | a -->|label| b | b follows a on the branch named label. |
| Inline class | id:::name | Applies one class to the node. |
| Class statement | class a,b name | Applies a class to several nodes. Use it to give a node both a kind and a meter. |
IDs start with a letter, contain letters, digits, _, or -, and are case-sensitive. Rounded id(label) and bare id nodes also work. classDef, style, and inline HTML are ignored with a warning.
Kind classes set each step's icon and are checked against what the run reports:
| Class | The step… |
|---|---|
:::query | Runs SQL against MotherDuck. |
:::extract | Reads from an external source, such as an API, a file, or another database. |
:::load | Writes rows into a table. |
:::transform | Computes in-process, with no I/O. |
:::check | Validates data. A check that catches bad data reports ok and routes with branch=. Report failed only when the check itself can't complete. |
:::switch | Picks one outgoing path. A failed switch is a real error. |
:::wait | Blocks on an external condition, such as a poll, a sleep, or an approval. |
:::flight | Runs another Flight. Name the child run on its lines, for example flight=daily_dims run=142. |
A node without a kind class is a generic step.
Meter classes control how a step's progress reads: :::fraction shows 812 / 1k from done= and total= (counts of 1000 and up are shortened), :::percent shows 81% from progress=, and :::fanout shows a row per instance from key=. A meter's readout stays on the node after the step ends.
An unrecognized kind or meter class is reported as a warning, so typos are easy to spot.
Step 2: Save the chart on the Flight
The chart is part of the Flight version, so changing it creates a new version. Charts are limited to 64 KiB.
- CLI
- SQL
- MCP / AI agent
Keep the chart in a chart.mmd file next to main.py. The file holds raw Mermaid starting at the flowchart line, with no code fences:
orders_nightly/
├── main.py
├── requirements.txt
├── chart.mmd
└── flight.metadata.json
flight push sends chart.mmd as the Flight's chart:
motherduck flight push orders_nightly
To start a new Flight with a one-step starter chart, pass --chart to init:
motherduck flight init orders_nightly --name orders_nightly --chart
Pass the chart in the metadata map under the chart key:
CALL MD_UPDATE_FLIGHT(
    flight_id := '<flight_id>',
    metadata := MAP {'chart': 'flowchart TD
  extract[Pull orders from API]:::extract --> load[Write to warehouse]:::load
  load --> verify{Row counts match?}:::check'}
);
MD_CREATE_FLIGHT takes the same metadata parameter.
Ask the agent to save the chart. create_flight and update_flight take it as metadata.chart.
Older Flights may declare the chart in the Python source, between # @flight and # @end-flight comment lines. The Flight Explainer still reads that block as a fallback, but new charts belong on the Flight. Remove the block when you save a chart. A saved chart is used when it parses into steps. An empty chart means no chart, even when the source still has a block. If the chart field is missing, or it is set but does not parse, a valid block in the source is used.
Step 3: Print progress lines
Print one @flight-run line each time a step changes state. Each line must end in a newline and be flushed, so it lands in the log as its own event:
@flight-run <step_id> <running|ok|failed|skipped> [field=value ...]
For a sequential Flight with a handful of steps, plain print() calls are enough:
from datetime import datetime, timezone

def ts():
    return datetime.now(timezone.utc).isoformat()

def main():
    print(f"@flight-run extract running ts={ts()}", flush=True)
    rows = pull_orders()
    print(f"@flight-run extract ok rows={len(rows)} ts={ts()}", flush=True)

    print(f"@flight-run load running ts={ts()}", flush=True)
    written = write_orders(rows)
    print(f"@flight-run load ok rows={written} effect=table:analytics.main.orders ts={ts()}", flush=True)

    print(f"@flight-run verify running ts={ts()}", flush=True)
    if written != len(rows):
        print(f'@flight-run verify failed error="{written} written, {len(rows)} pulled" ts={ts()}', flush=True)
        raise SystemExit(1)
    print(f"@flight-run verify ok ts={ts()}", flush=True)

if __name__ == "__main__":
    main()
Fields you can add to a @flight-run line:
| Field | Meaning |
|---|---|
rows | Row count, as an integer. |
error | Error message. |
ts | ISO-8601 timestamp. Add it to the running line and the final line of a step to get per-step durations and the timeline column. |
effect | What the step touched, as type:detail. Repeatable. Types are table:, file:, net:, and other:, for example effect=table:analytics.main.orders or effect=net:api.example.com. |
key | Instance name for a fan-out step. Defaults to a single instance. |
progress | A value from 0 to 1, for a :::percent meter. |
done, total | Integers, for a :::fraction meter. |
branch | The label of the outgoing edge this step took. |
Wrap any value that contains a space, ", or = in double quotes, for example error="timeout after 30s". A line with an unknown status or no step ID is dropped with a warning.
To attach free-text messages to a step, print @flight-log <step_id> <message>. The message is kept verbatim.
You don't need a line for the run itself: the Flight Explainer takes the run's outcome from its status and exit code. To report it explicitly, print @flight-run @flight ok exit=0 or @flight-run @flight failed exit=1.
For concurrent steps, large fan-outs, or JSON logging, see the helper pattern and JSON mode in the full guide: motherduck flight guide --explainer.
Step 4: Run the Flight and open the run
- MotherDuck UI
- CLI
- MCP / AI agent
Trigger a run, select it in the run history, and open the explainer tab. The tab updates live while the run executes. Before a Flight's first run, its page shows the chart for the current version, so you can check the chart before running anything.
Read the steps in your terminal:
motherduck flight run orders_nightly
motherduck flight explain orders_nightly
flight explain shows the latest run. Pass --run <n> for a specific run. --watch reads it every 5 seconds until it ends. --open also opens the run in the app and prints the URL on stderr.
To see the chart before a run:
motherduck flight explain orders_nightly --preview
Ask your AI agent:
"Run
orders_nightlyand show me how the run went."
The agent calls run_flight, then view_flight_run, which shows the run in your AI tool and links to it in the MotherDuck UI.
Read a run
In the Flight Explainer, each step shows:
- Status: running, ok, failed, skipped, or stalled. Once a run succeeds, steps it never started show as skipped. In a failed or cancelled run, steps it never reached stay pending, because the run stopped before it got to them.
flight explainlabels those pending stepsnot reachedin the table. See Unexpected or missing progress lines for the details. - Readout: the row count, or a meter's progress such as
812 / 1k. - Timing: a duration and a timeline bar, when the step reported
ts=. - Effects and errors: the tables, files, and endpoints it touched, and any
error=text.
Edges light up as the run takes them. Run info shows the run's config and timing, and Run log shows the log.
In a failed run, the failed step is highlighted in red and shows its error. Expand a fan-out step to see which instance failed. A step whose branch the run didn't take is marked as not taken, and a warning icon flags a step whose log disagrees with the chart:
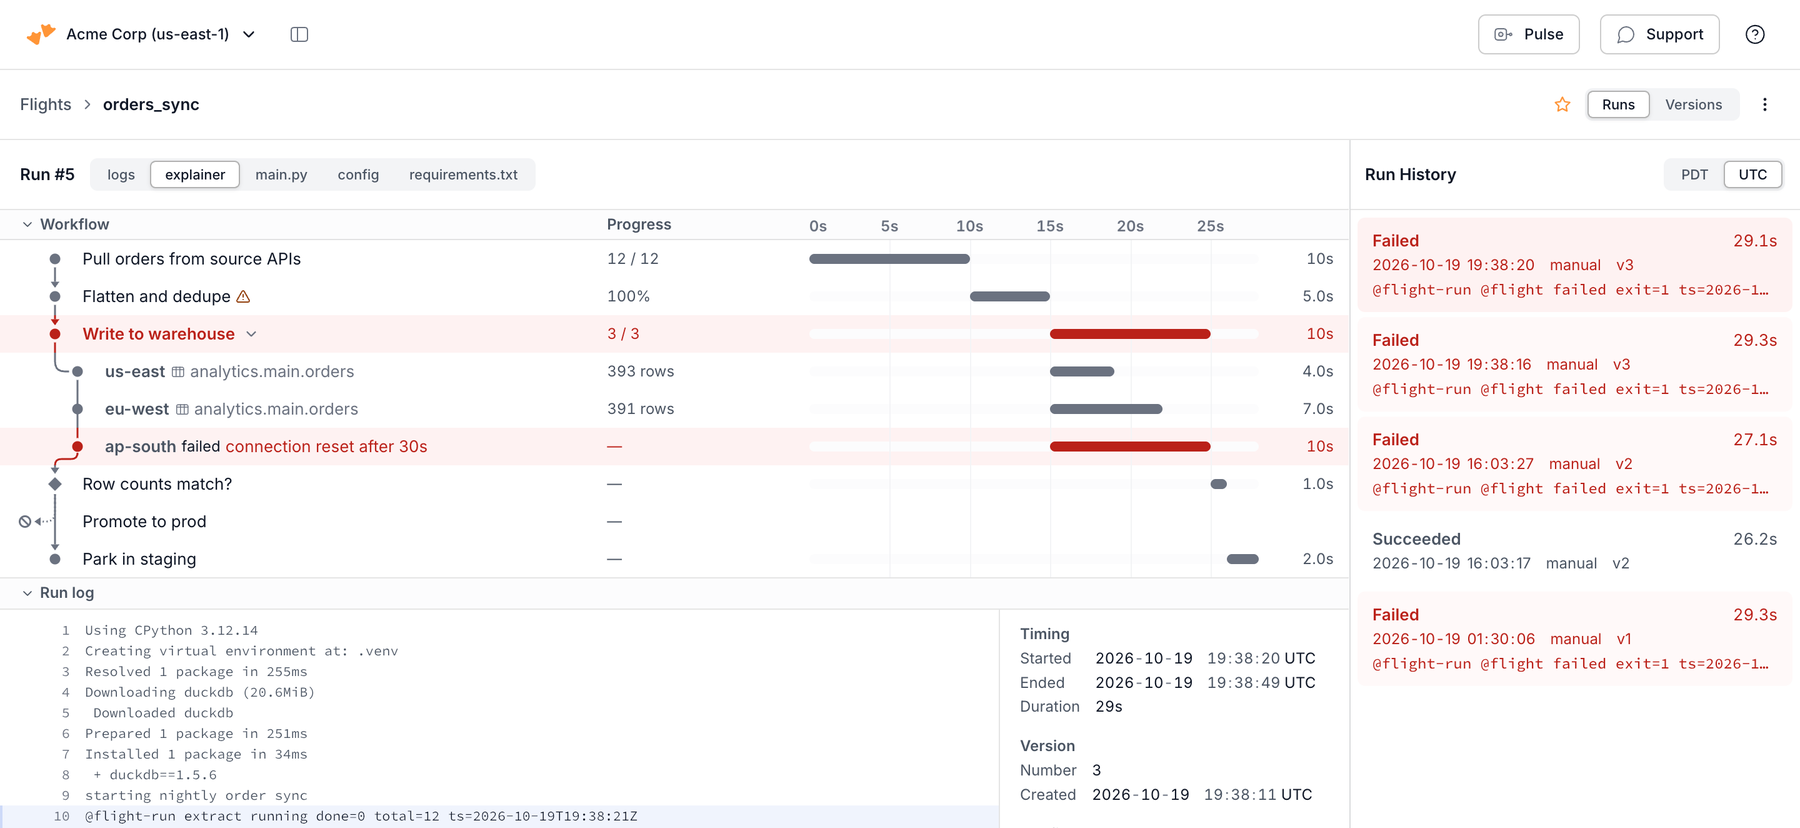
From the terminal, flight explain prints the same steps as a table, and -o json returns them as a steps array on the run object.
Use cases and examples
Find the failing step in a nightly pipeline
Without the Flight Explainer, a failure means scrolling a long log for the traceback. With it, the failed step is highlighted in red and shows an error. Each later step shows that it never ran, so you know what did and did not complete.
Spot the slow shard in a partitioned load
When one step processes many partitions, declare it as a fan-out and report each partition with key=. The Flight Explainer lists one row per partition with its own status, row count, and timeline bar, so the long pole stands out.
flowchart TD
  plan[List partitions]:::query --> load[Load partition]:::load
  load --> verify{All partitions loaded?}:::check
  class load fanout
for day, files in partitions.items():
    print(f"@flight-run load running key={day} ts={ts()}", flush=True)
    try:
        n = load_day(day, files)
        print(f"@flight-run load ok key={day} rows={n} ts={ts()}", flush=True)
    except TimeoutError as e:
        print(f'@flight-run load failed key={day} error="{e}" ts={ts()}', flush=True)
A fan-out step's overall status is determined by its child instances: it is shown as running while any of its individual child instances are still running, then failed if any instance fails.
Gate a publish on a data-quality check
Use a :::check decision node with one labeled edge per outcome, and report the outcome with branch=. When the counts match, report ok with branch=match. When they don't, report ok with branch=mismatch: the check did its job, and the data took the quarantine path. Report failed only when the check itself can't run, such as when the count query errors.
flowchart TD
  load[Write to staging]:::load --> verify{Row counts match?}:::check
  verify -->|match| publish[Promote to prod]:::query
  verify -->|mismatch| quarantine(Park in staging)
print("@flight-run verify running", flush=True)
if staged == expected:
    print("@flight-run verify ok branch=match", flush=True)
    print("@flight-run publish running", flush=True)
    promote()
    print("@flight-run publish ok", flush=True)
else:
    print("@flight-run verify ok branch=mismatch", flush=True)
    print(f"@flight-log verify {staged} staged, {expected} expected", flush=True)
    print("@flight-run quarantine running", flush=True)
    quarantine()
    print("@flight-run quarantine ok", flush=True)
In a run that caught bad data, verify is ok with its message, the mismatch edge and quarantine are lit, the match edge is marked as not taken, and publish shows as skipped.
Reporting branch= is more reliable than letting the Flight Explainer infer the path from which steps finished, especially for retry loops and branches that rejoin.
Alert on a specific step from CI
flight explain -o json returns each step's status, so a CI job or a monitoring script can fail on the one step that matters:
motherduck flight explain orders_nightly -o json \
  | jq -e '.run.steps[] | select(.step == "verify") | .status == "ok"'
Troubleshooting
| Symptom | Cause | Fix |
|---|---|---|
Your Flight doesn't support Explainer yet, or flight explain says the Flight declares no chart. | The Flight version has no chart. | Add a chart and run the Flight again. |
| This run's version doesn't support Explainer. | The run used a version without a chart. A newer version may have one. | Run the Flight again to visualize the current version. |
| Every step stays pending. | The Flight prints no @flight-run lines, or the IDs don't match the chart. | Check that each line's step ID matches a node ID exactly, including case. |
| A warning icon on a step. | The chart and the log disagree. For example, a :::transform, :::check, or :::switch step reported a table: or file: effect, a branch= names no edge out of the step, a meter class never got its fields, or a :::flight step never reported flight= and run=. Hover the icon to see what the chart declared and what the run logged, such as transform step, which should not write and a write to table analytics.main.features. | Fix the chart or the print call so they agree. A step that writes a table is a :::load, not a :::transform. |
| A warning above Run info, or a chart-warning count on the Run log header. | A log line names a step ID the chart doesn't declare, or the chart has a problem such as an unknown class. | Add the step to the chart, or fix the ID in the print call. |
| Later steps read as pending after a very long log. | The Flight Explainer reads the first 5,000 log lines. flight explain warns when the log is longer, including when a read was cut at 4 MB. | Print less free text, so the @flight-run lines fall inside that range. |
Unexpected or missing progress lines
The Flight Explainer doesn't reject progress lines that arrive out of order. It applies these rules instead:
- A step logs again after it finished. The latest line for a step (and
key=) wins. Arunningline afterokshows the step as running again, and anokline afterfailedshows it as ok. That's how a retry looks: logrunningagain, then the final status. Nothing flags an out-of-order status, so if a step's status looks wrong, read its lines in the run log. - The run ends while a step is still
running. The step takes the run's outcome: ok if the run succeeded, failed if it failed, and stalled if it was cancelled. A process that's killed mid-step, for example for running out of memory, fails the run, so that step shows as failed even though it never printed afailedline. - A step never starts. In a run that succeeded, it shows as skipped. In a failed or cancelled run, it stays pending, unless every way into it came from a branch the run decided against, in which case it shows as skipped.
- A line is malformed. A line with an unknown status or no step ID is dropped with a warning. A line for a step ID that isn't in the chart is reported as a warning, so you can fix the chart or the
printcall.
Related
- Monitoring and debugging Flights — run history, logs, and common failure patterns.
- Running Python with Flights — create, run, and schedule a Flight.
motherduck flight—explainandguide --explainer.view_flight_runandget_flight_viz_guide— the MCP tools for AI agents.MD_UPDATE_FLIGHT— save a chart from SQL.