2023/11/28 - Ryan Boyd
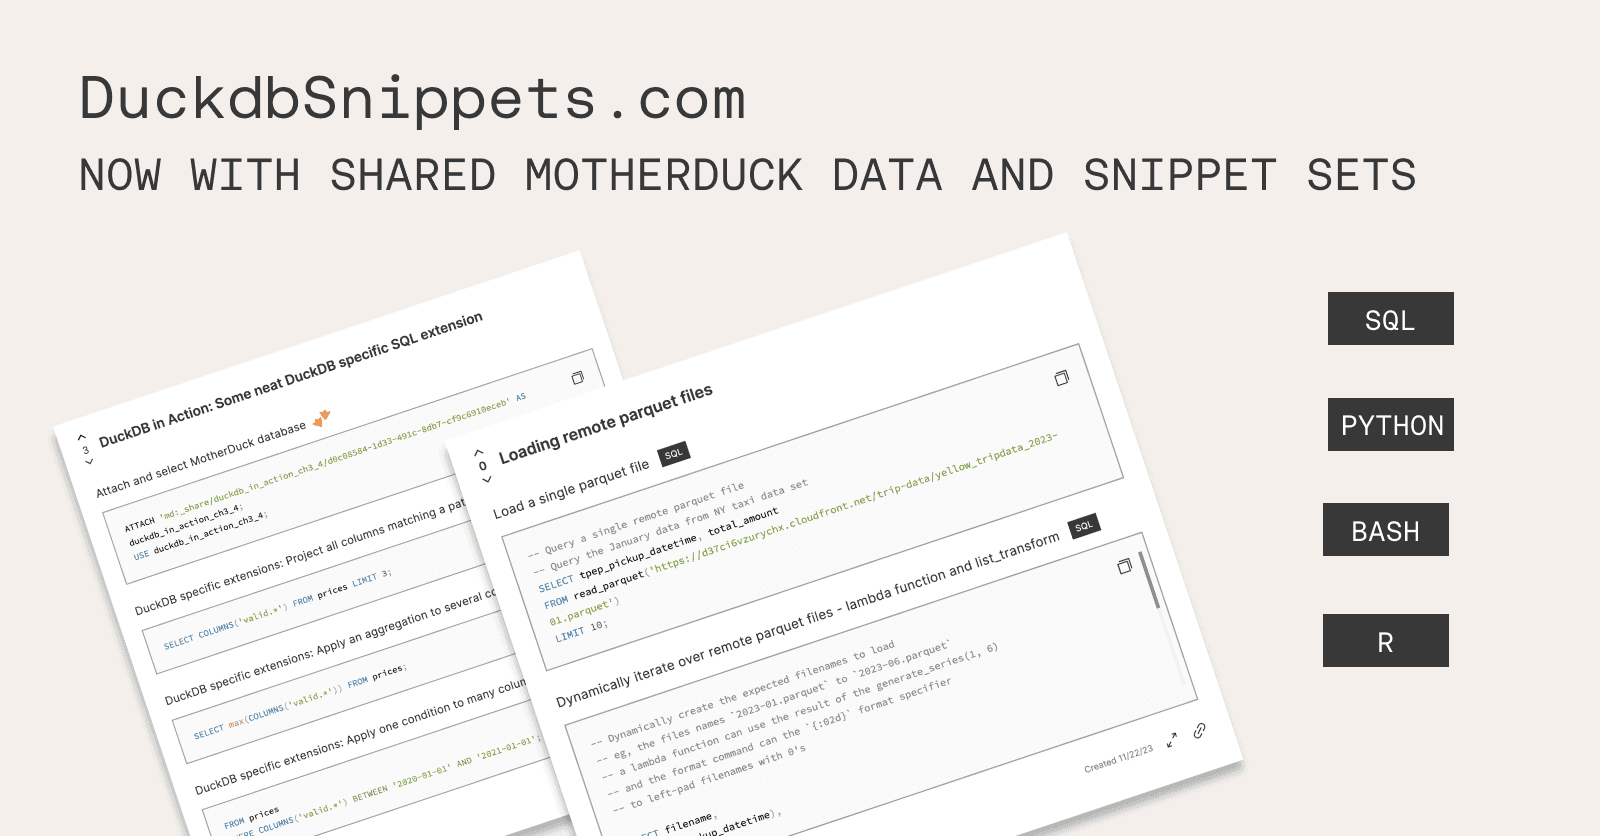
Announcing: DuckDB code snippet sets with MotherDuck Sharing
The DuckDB Snippets site has been upgrade to include sharing sets of code snippets in SQL and Python plus also sharing data with MotherDuck share URLs.
- 9 min read
BY- 9 min read
BYAn analytics dashboard is a software asset. It must undergo testing, be appropriately versioned, and exist in various environments, including staging and production, during its development stages.
The emergence of BI-as-code tools addresses long-standing challenges in this field.
DuckDB is an excellent tool for quick analytics, but what if you need a more sustainable visualization? In an earlier YouTube video, we explored integrations of DuckDB/MotherDuck with Preset and Hex. However, the world of data visualization offers many more tools beyond standard BI dashboarding.
This blog post discusses three Bi-as-code tools - Evidence, Rill, and Streamlit. For each tool, we’ll go over :
And of course, you can follow along with the full repository code.
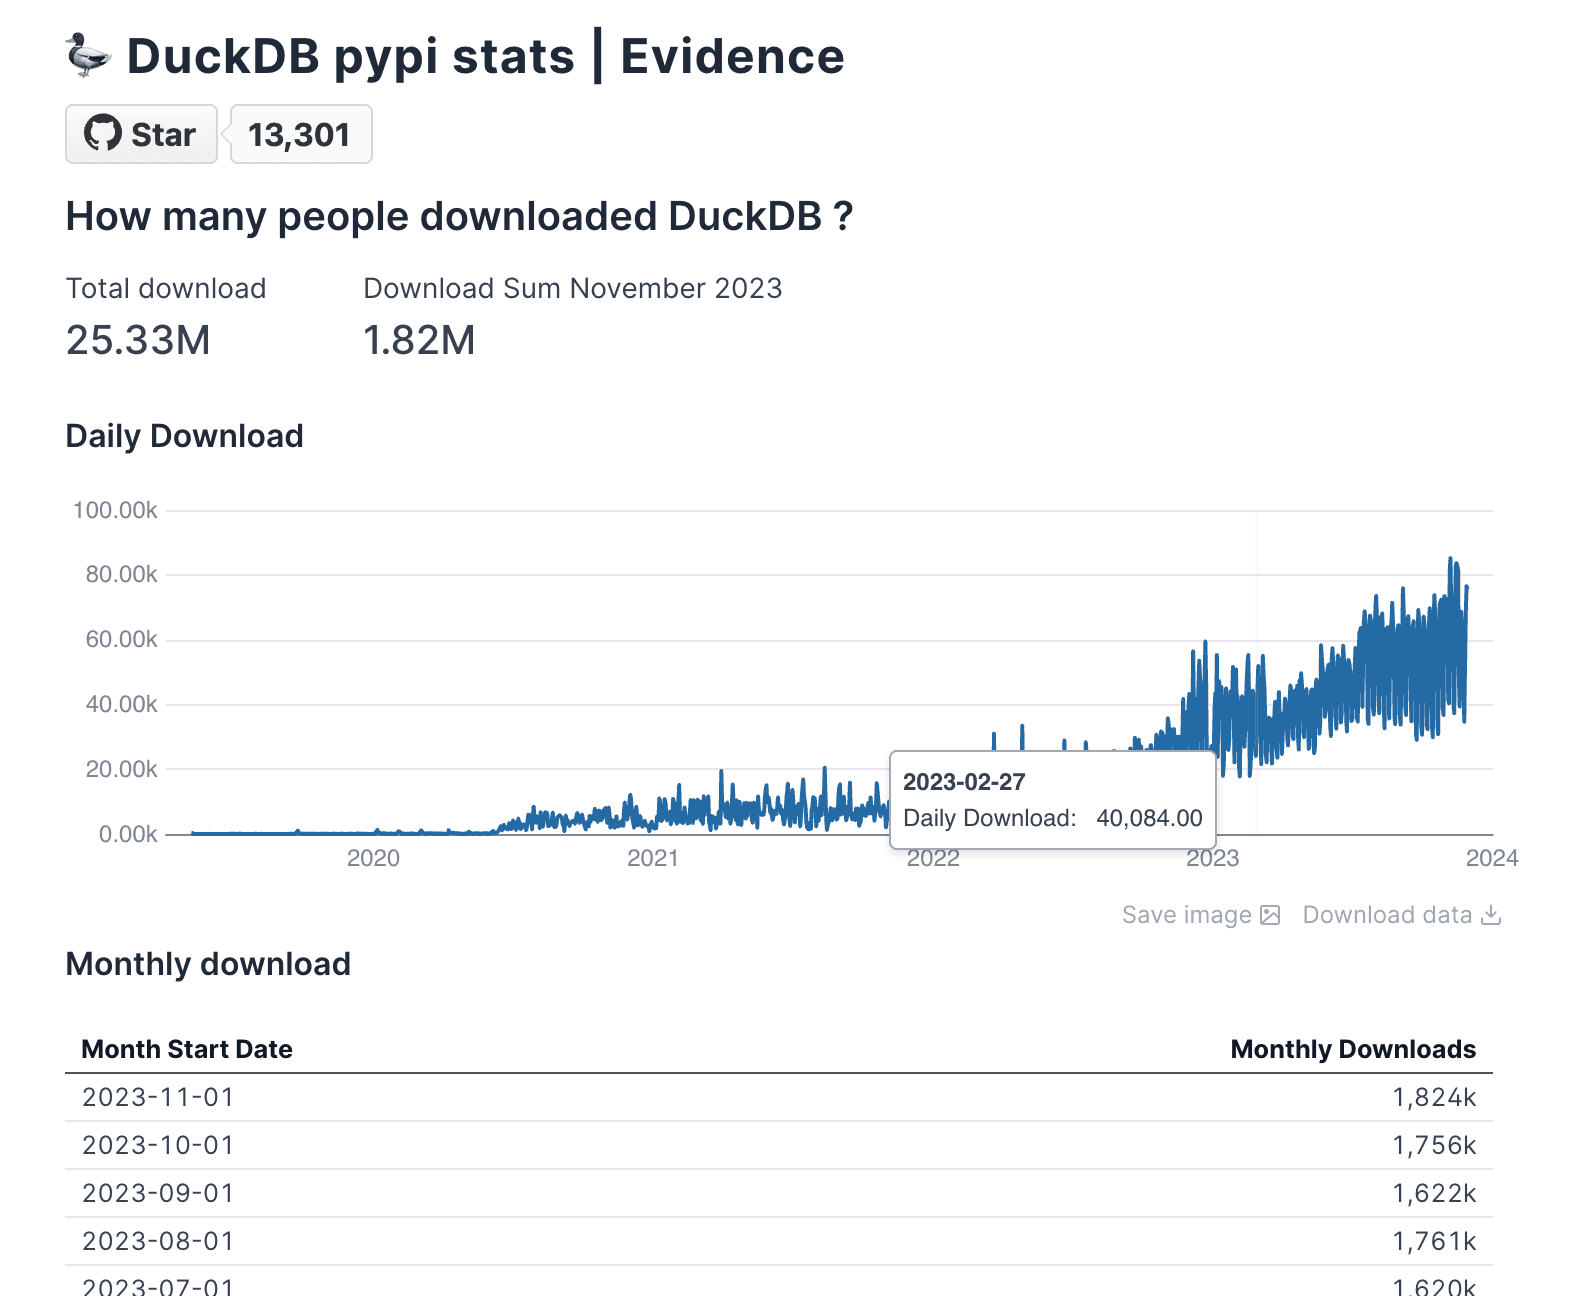
Plus, instead of using boring demo data, we'll dive into PyPI statistic insights from the DuckDB project.
If are too lazy to read, I also made a video for this tutorial.
Before diving into the different tools, it's important to understand why such tools are emerging. Data engineering has seen significant advancements, yet the rest of the analytics chain often hasn't kept pace.
Typically, business and analytics users extract data from a data warehouse, often organized in a Star Schema and build their dashboards using WYSIWYG tools such as Tableau, PowerBi, or Excel.
What's the issue with these tools? They were designed with a user interface-first focus to lower the technical barrier to entry. However, this approach can lead to increased technical debt.
For instance, how do you roll back a UI dashboard or prevent it from breaking? Ultimately, the dashboard that presents your Key Performance Indicators (KPIs) is a software asset.
Let's consider what some tools offer today, along with their advantages (remember, the choice is yours). They all share some common features:
Evidence is a lightweight JS framework designed for building data apps using Markdown and SQL. You simply construct your dashboard using existing components, incorporate them using SQL within your markdown, and you're set! The end product is a static website that can be hosted anywhere: Vercel, Netlify, or Evidence Cloud.
Rill, by Rilldata, allows you to create dashboards using only SQL and YAML files. They offer a convenient CLI for running it locally, using a local web UI to draft queries/dashboards, or for deploying on their Cloud. Here's a fun fact: Rill is built using DuckDB.
Streamlit has been in the market for a few years and was acquired by Snowflake in Q1 2022. The primary advantage (and possibly disadvantage) of Streamlit is that it allows you to stay within your Python data workflow and use the same ecosystem to develop your data apps. Hence, you build your data apps with Python and need a Python runtime for hosting.
Let's come back to our use case to analyze PyPi statistics on the Python package of duckdb.
I won't go into the complete code example, but I'll put some beautiful screenshots and code snippets to grasp how each one works. Feel free to follow along with the source code for the dashboards below.
Setup
To quickly start an evidence project, you essentially need to copy a JS template. You can do this either by using Node.js and degit package or their container image using the devcontainer feature from VSCode.
According to their documentation, here's how you can do it:
Copy code
npx degit evidence-dev/template my-project
cd my-project
npm install
npm run dev
Project structure & Connection to DuckDB
There are 3 main important part in the projects
Copy code
.evidence // evidence configurations
pages/index.md // Where we write .md & SQL
evidence.plugins.yaml // configure evidence plugins
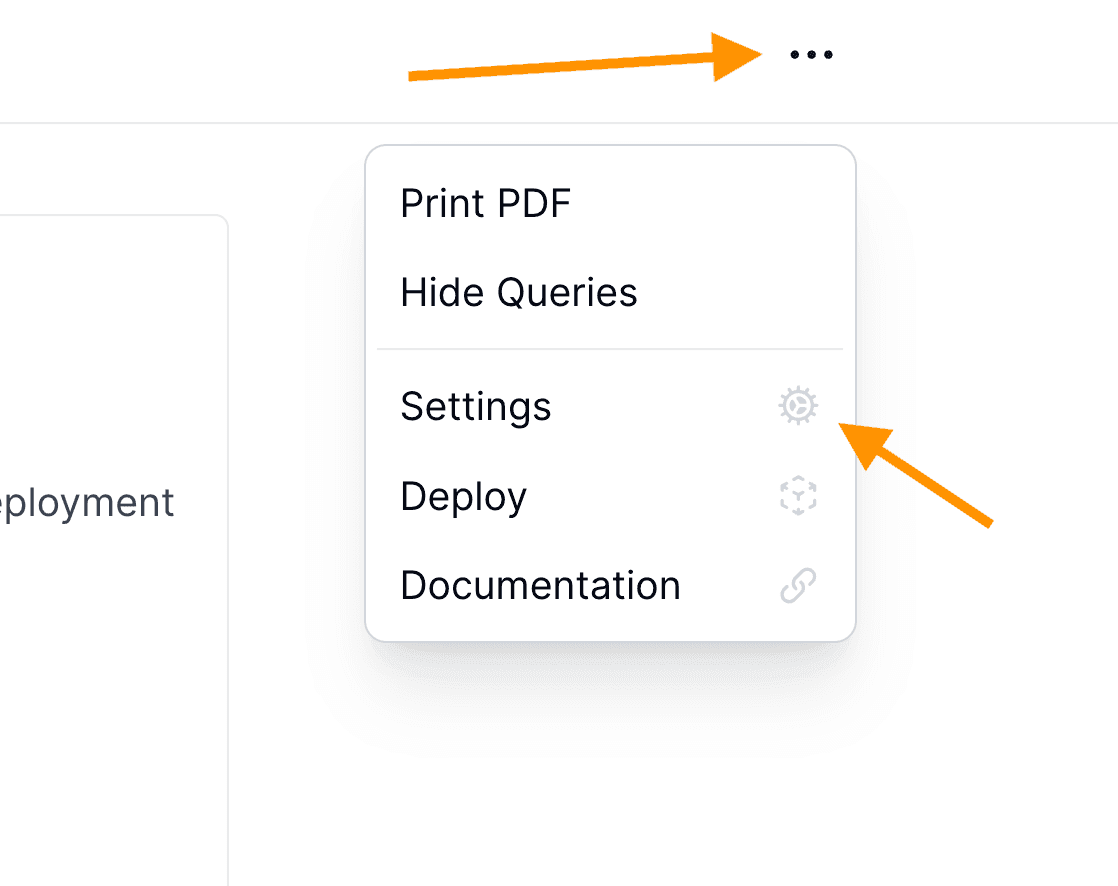
Once the local server is running, you can connect to DuckDB through the UI settings page.
For a local DuckDB database, you will just need to provide the path and the extension.
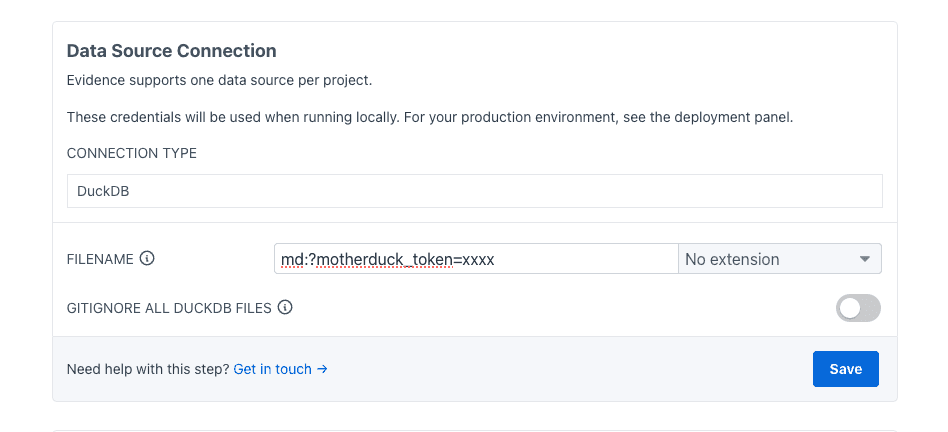
For a MotherDuck database, you will need to specify your MotherDuck Token. More information about how to retrieve this token and work in production on our documentation.
Creating Visualizations
Evidence renders markdown files into web pages. When developing, the markdown file /pages/example.md is rendered at localhost:3000/example.
Evidence has a collection of components that you can use for your visualization. You then defined your SQL query attached to this component.
Copy code
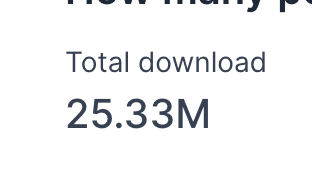
<BigValue
title='Total download past 2 years'
data={total_count}
value='download_count'
fmt='#,##0.00,,"M"'
/>
```total_count
SELECT SUM(daily_download_count) AS download_count
FROM daily_stats
WHERE timestamp_day BETWEEN DATE_TRUNC('month', CURRENT_DATE) AND CURRENT_DATE;
This would display :
That sums up how you can create your components. Of course, there's more to it, such as reusing SQL queries, filters, etc.
Deployment
When you generate a static website, you have the flexibility to host it anywhere that supports JS static websites. Evidence also provides its own cloud service to streamline the deployment process from local to production.
Setup
Rill provides a Command Line Interface (CLI), essentially a binary (written in Golang) for installation. There's a single command line that executes the installation for you.
Copy code
curl -s <https://cdn.rilldata.com/install.sh> | bash
rill should then be then available in your terminal
Copy code
Usage:
rill [command]
Available Commands:
start Build project and start web app
docs Open docs.rilldata.com
version Show Rill version
upgrade Upgrade Rill to the latest version
whoami Show current user
org Manage organisations
project Manage projects
deploy Deploy project to Rill Cloud
user Manage users
env Manage variables for a project
login Authenticate with the Rill API
logout Logout of the Rill API
help Help about any command
Flags:
-h, --help Print usage
--interactive Prompt for missing required parameters (default true)
-v, --version Show rill version
Use "rill [command] --help" for more information about a command.
Project structure & Connection to DuckDB
To start a fresh new project, you can do :
Copy code
rill start my-rill-project
When you start a project, it launches a local server. When you browse to the page, you will see the following:
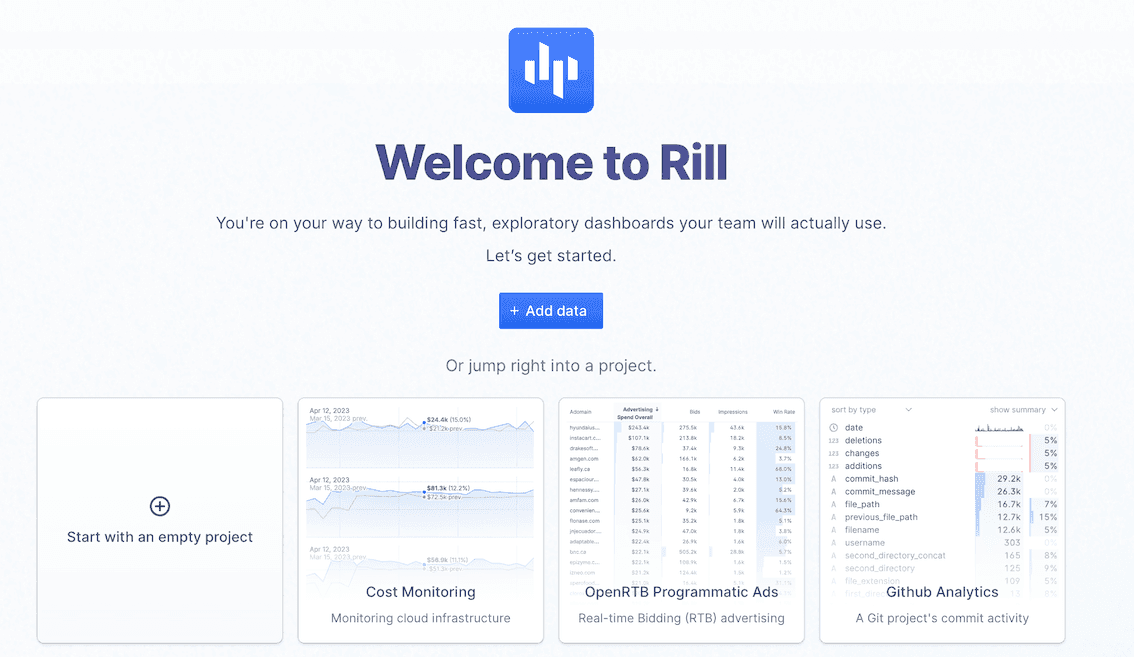
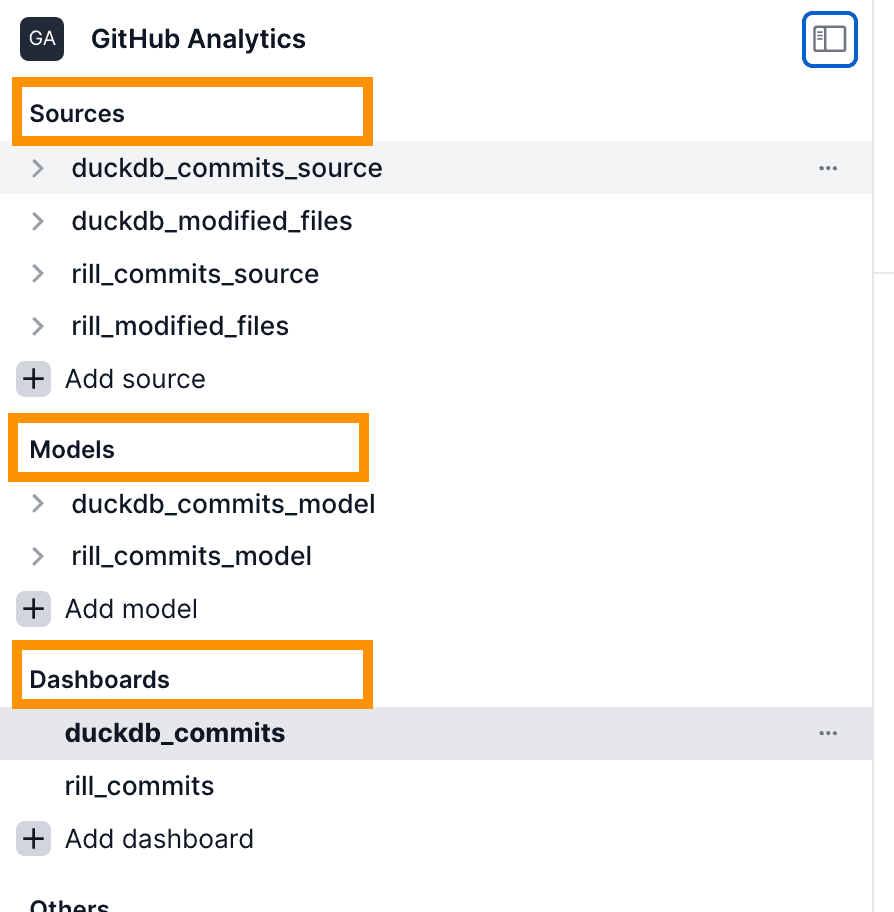
If you click on any of these examples, it will generate .yaml and .sql files and there are 3 main folders :
Copy code
├── dashboards │ └── customer_margin_dash.yaml ├── models │ └── metrics_margin_model.sql ├── rill.yaml ├── sources │ └── metrics_margin_monitoring.yaml
In sources, you define any supported sources using YAML. Models contain SQL queries that will be used in your dashboard, and dashboard is where you specify your metrics, in YAML. You can also edit these through the Rill UI.
Coming back to our PyPI stats use case, since we have a DuckDB database containing the data, we can proceed as follows:
Copy code
rill start rill/my-rill-project --db rill/data/duckdb_stats.db
To connect to MotherDuck, you would need to export motherduck_token as an environment variable. More information on their documentation here.
There's a small workaround to do : it won't be displayed as a source table in the Rill UI.
However, we can create a model in the models folder as described below or directly use it in the dashboard.
Copy code
select * from duckdb_stats.main.daily_stats
We can now define some metrics in our model_dashboard.yaml
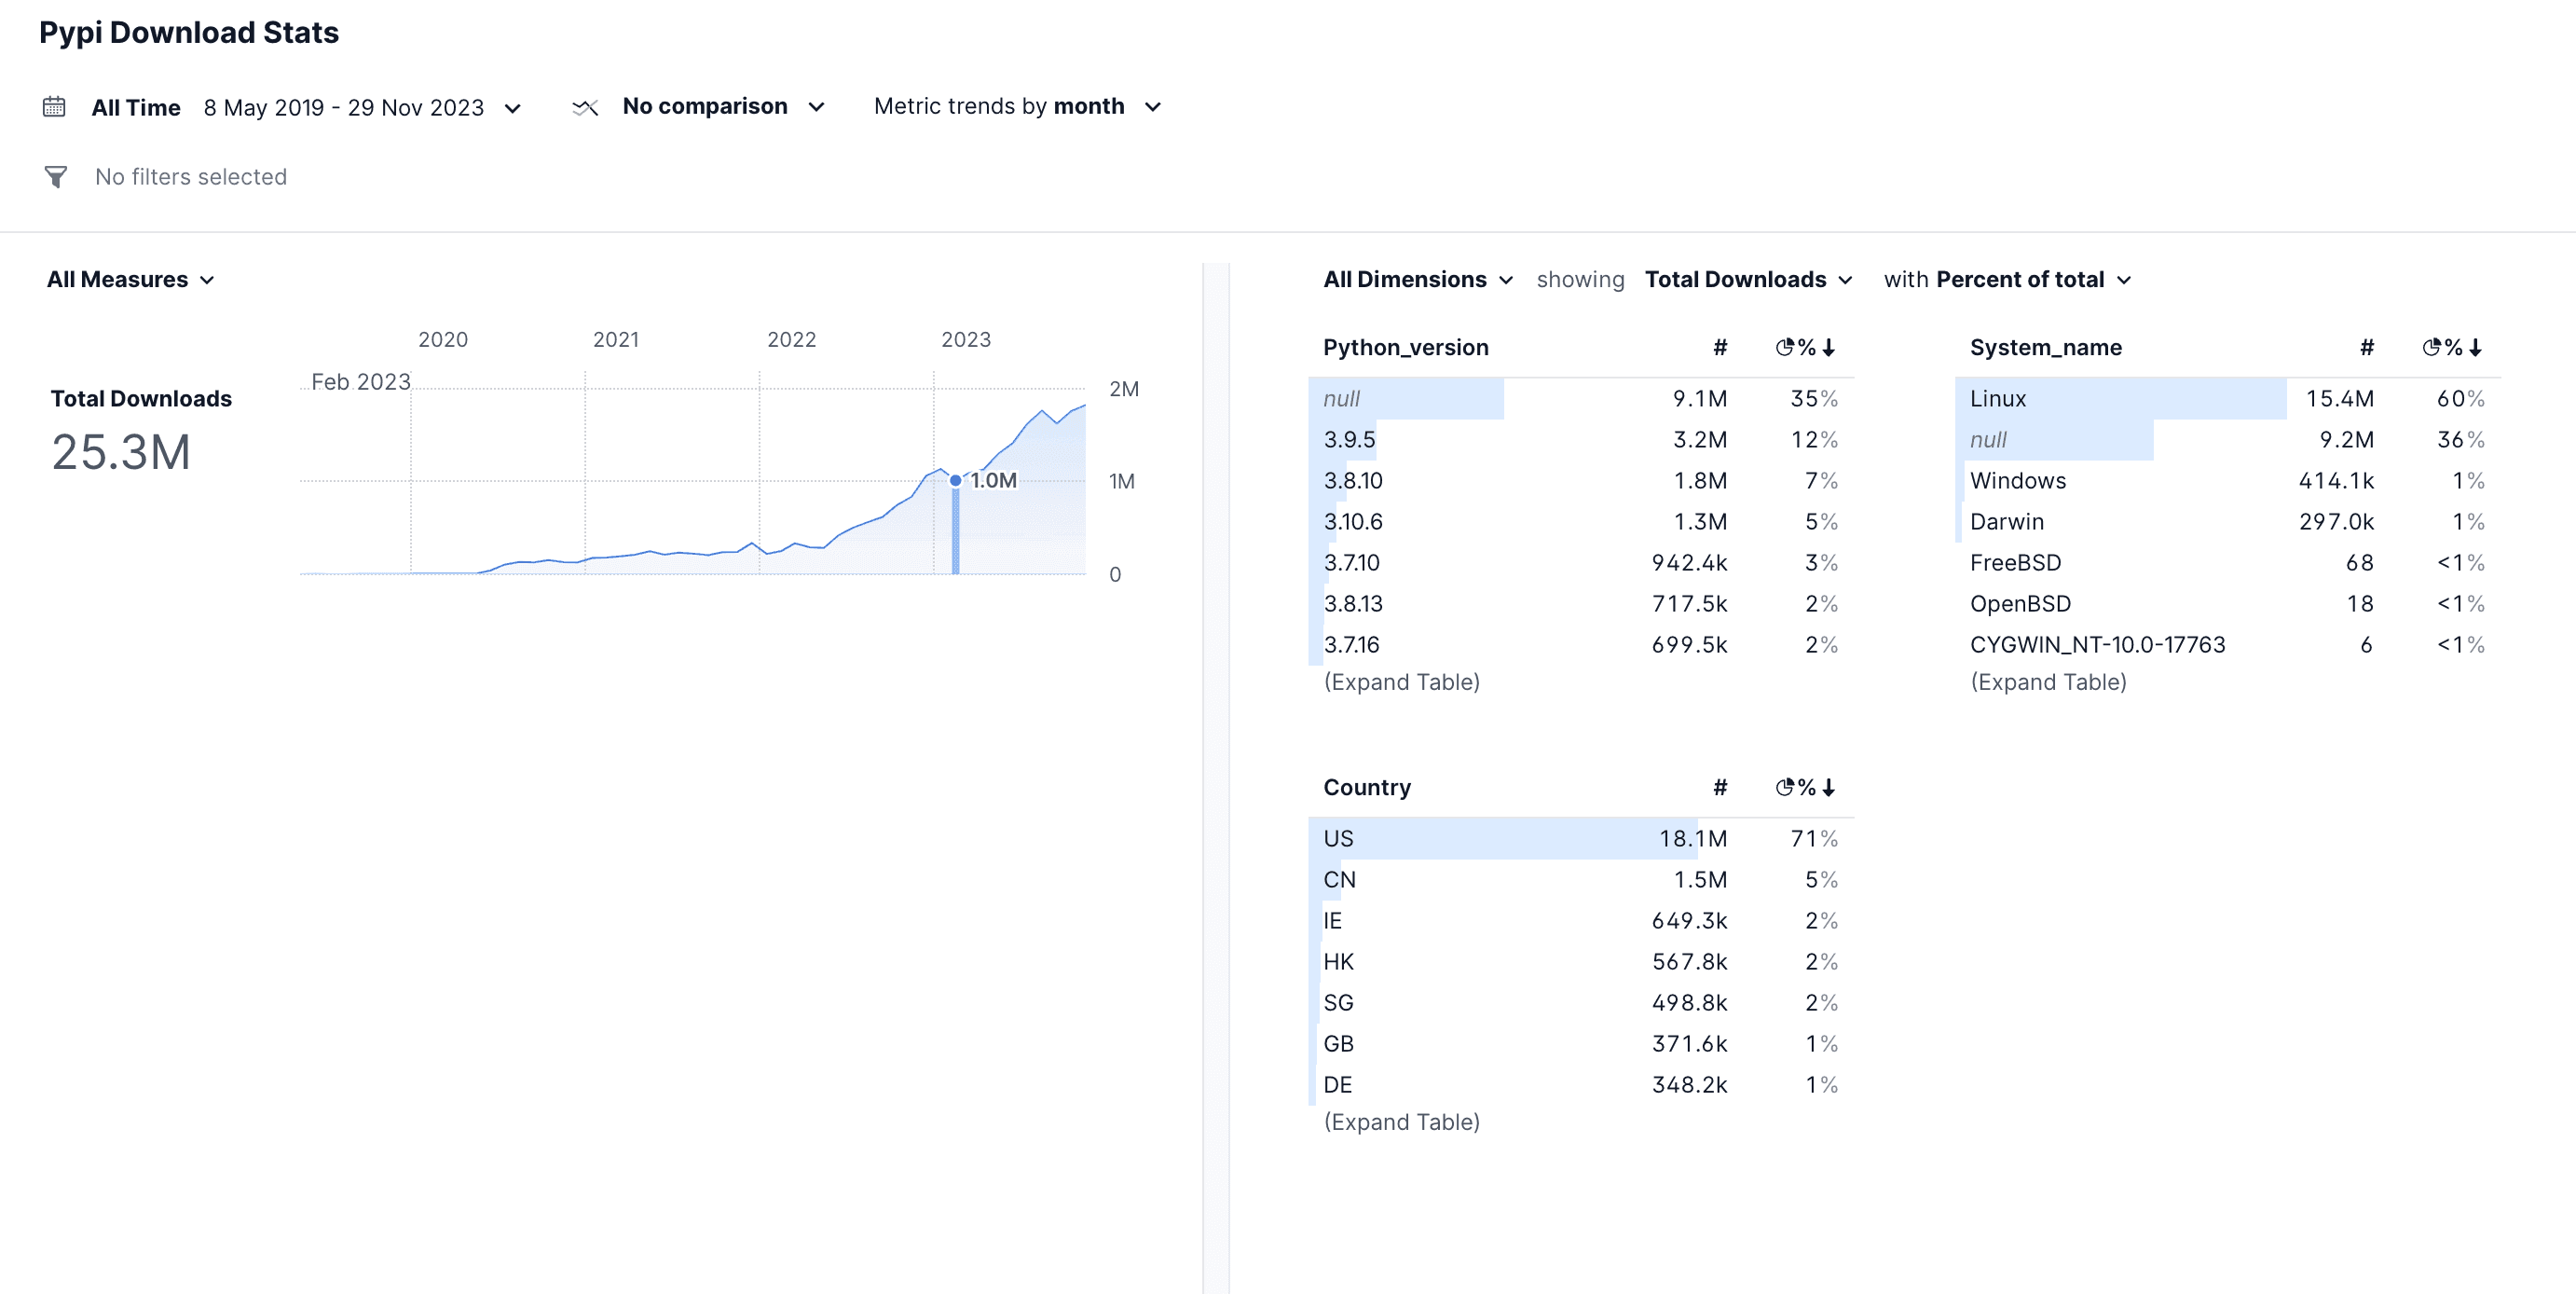
The overarching goal of Rill is to provide you with a tailored dashboard based on the metrics you want to see, rather than offering an endless collection of charts that you have to construct yourself.
Copy code
title: Pypi Download Stats
model: model
timeseries: timestamp_day
measures:
- label: Total Downloads
expression: sum(daily_download_count)
name: total_records
description: Total number of records present
format_preset: humanize
valid_percent_of_total: true
dimensions:
- name: python_version
label: Python_version
column: python_version
description: ""
- name: system_name
label: System_name
column: system_name
description: ""
- name: cpu
label: Cpu
column: cpu
description: ""
- name: file_version
label: File_version
column: file_version
description: ""
- name: country
label: Country
column: country
description: ""
Deployment
Deployment is done through Rill’s Cloud offering. It’s worth to mention that compared to the other solutions, Rill offer users access management out of the box.
Setup
For someone familiar with Python, getting started with Streamlit is quite simple. All you need is a Python environment and common packages like streamlit, duckdb, pandas, and matplotlib for data visualization.
Running the app, as per our example is as simple as :
Copy code
streamlit run app.py
Project structure & Connection to DuckDB/MotherDuck
You have the freedom to structure your Python app as you see fit. However, for beginners, everything can be contained in a single script.
Connecting to DuckDB/MotherDuck is the standard Python way.
For a local connect to our PyPi stats DuckDB database, use the following:
Copy code
import duckdb
con = duckdb.connect(database='duckdb_stats.db', read_only=True)
To connect to MotherDuck, you will have to provide your token :
Copy code
import duckdb
con = duckdb.connect('md:?motherduck_token=<token>')
Creating Visualizations
Streamlit offers a vast array of components, including interactive features for audio/video or LLMs, among others. We're only scratching the surface here.
The primary strategy involves using a Pandas dataframe and using the built-in charts that Streamlit provides.
Let’s build the Pandas dataframe first :
Copy code
# Query for filtered data
query = """
SELECT
DATE_TRUNC('month', timestamp_day) AS month,
SUM(daily_download_count) AS total_downloads,
python_version,
cpu
FROM duckdb_stats.main.daily_stats
WHERE timestamp_day BETWEEN ? AND ?
GROUP BY month, python_version, cpu
ORDER BY month
"""
df = con.execute(query, (start_date, end_date)).df()
DuckDB supports natively conversion of results to Pandas dataframe.
And our first chart :
Copy code
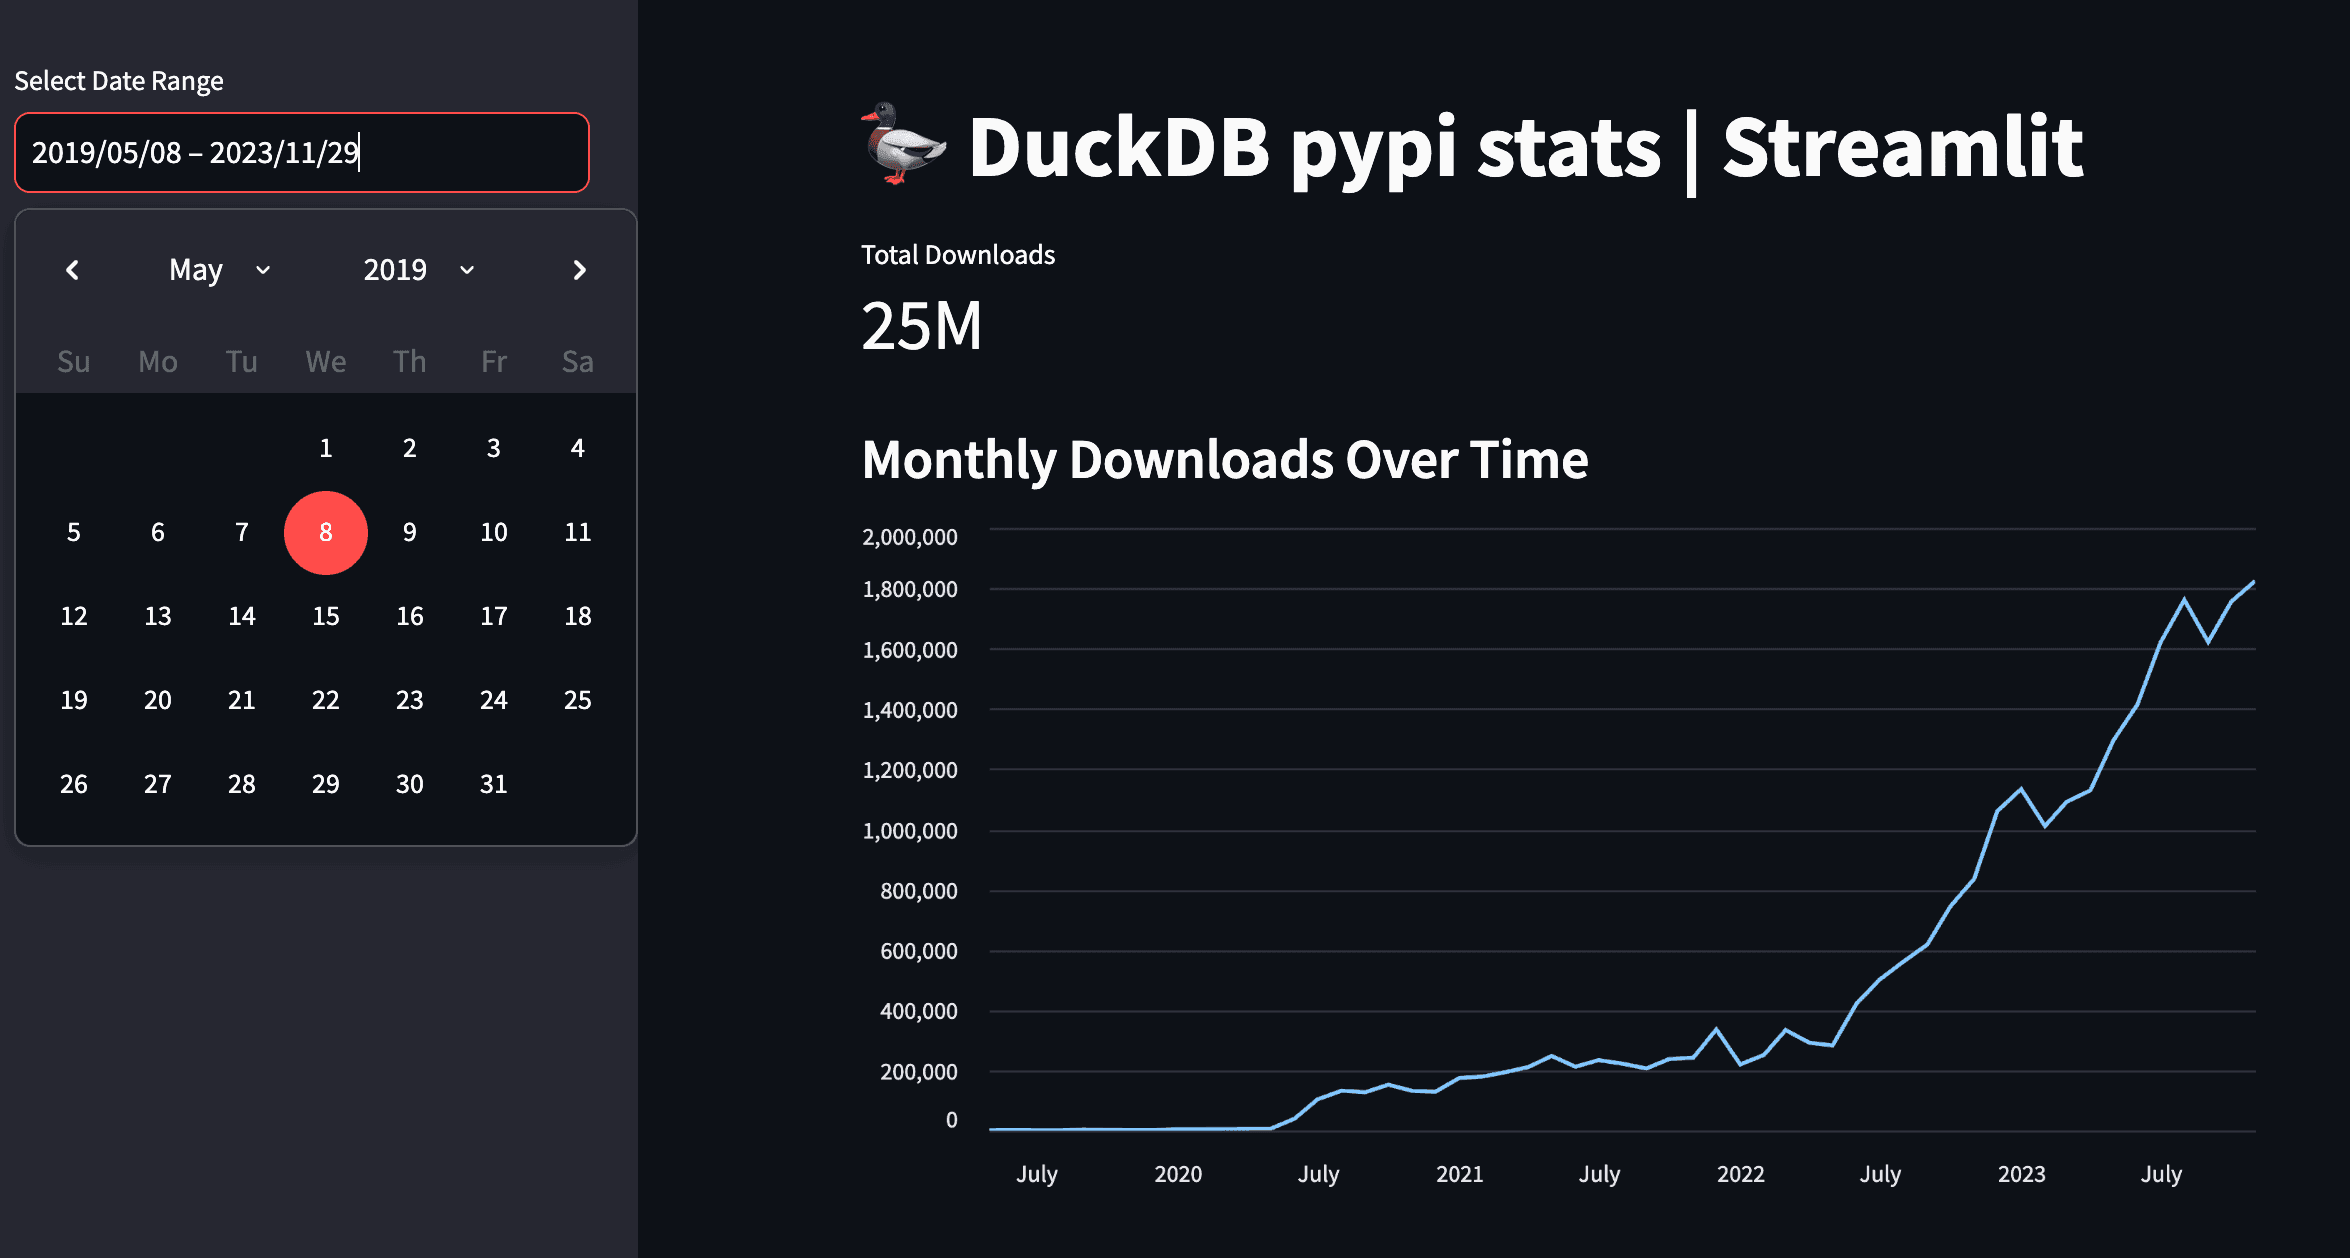
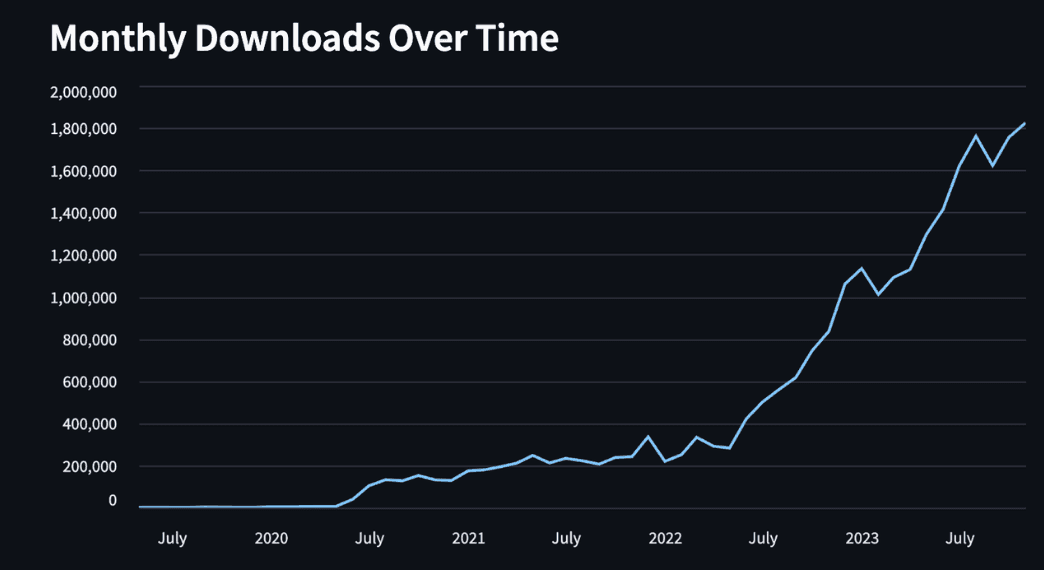
# Line Graph of Downloads Over Time
st.subheader("Monthly Downloads Over Time")
df_monthly = df.groupby('month')['total_downloads'].sum().reset_index()
st.line_chart(df_monthly.set_index('month'))
Deployment
Streamlit offers a community Cloud where you can deploy your app for free. Since it's a python app, it can work on any python runtime that allows you to expose a web service.
Through the blog, we've explored three different tools that each offer a unique approach to BI-as-code.
You can conduct all tests locally and use Git for version control and CI/CD. Your dashboard can be easily deployed or rolled back, all while embracing software best practices. BI doesn't have to be a tedious click-through expensive UI. It's refreshing to see new perspectives. Even though some of these tools are in their early stages, they show great promise.
Stay tuned for our next blog post, where we'll dive into how to efficiently collect data from PyPI into DuckDB. This will enable you to easily build your own PyPI stats dashboard for your Python project!
Keep coding, keep quacking.
2023/11/28 - Ryan Boyd
The DuckDB Snippets site has been upgrade to include sharing sets of code snippets in SQL and Python plus also sharing data with MotherDuck share URLs.

2023/12/05 - Leslie Thomas
MotherDuck's Seattle office opened as one of four company hubs, which also includes San Francisco, NYC and Amsterdam