← Browse Dives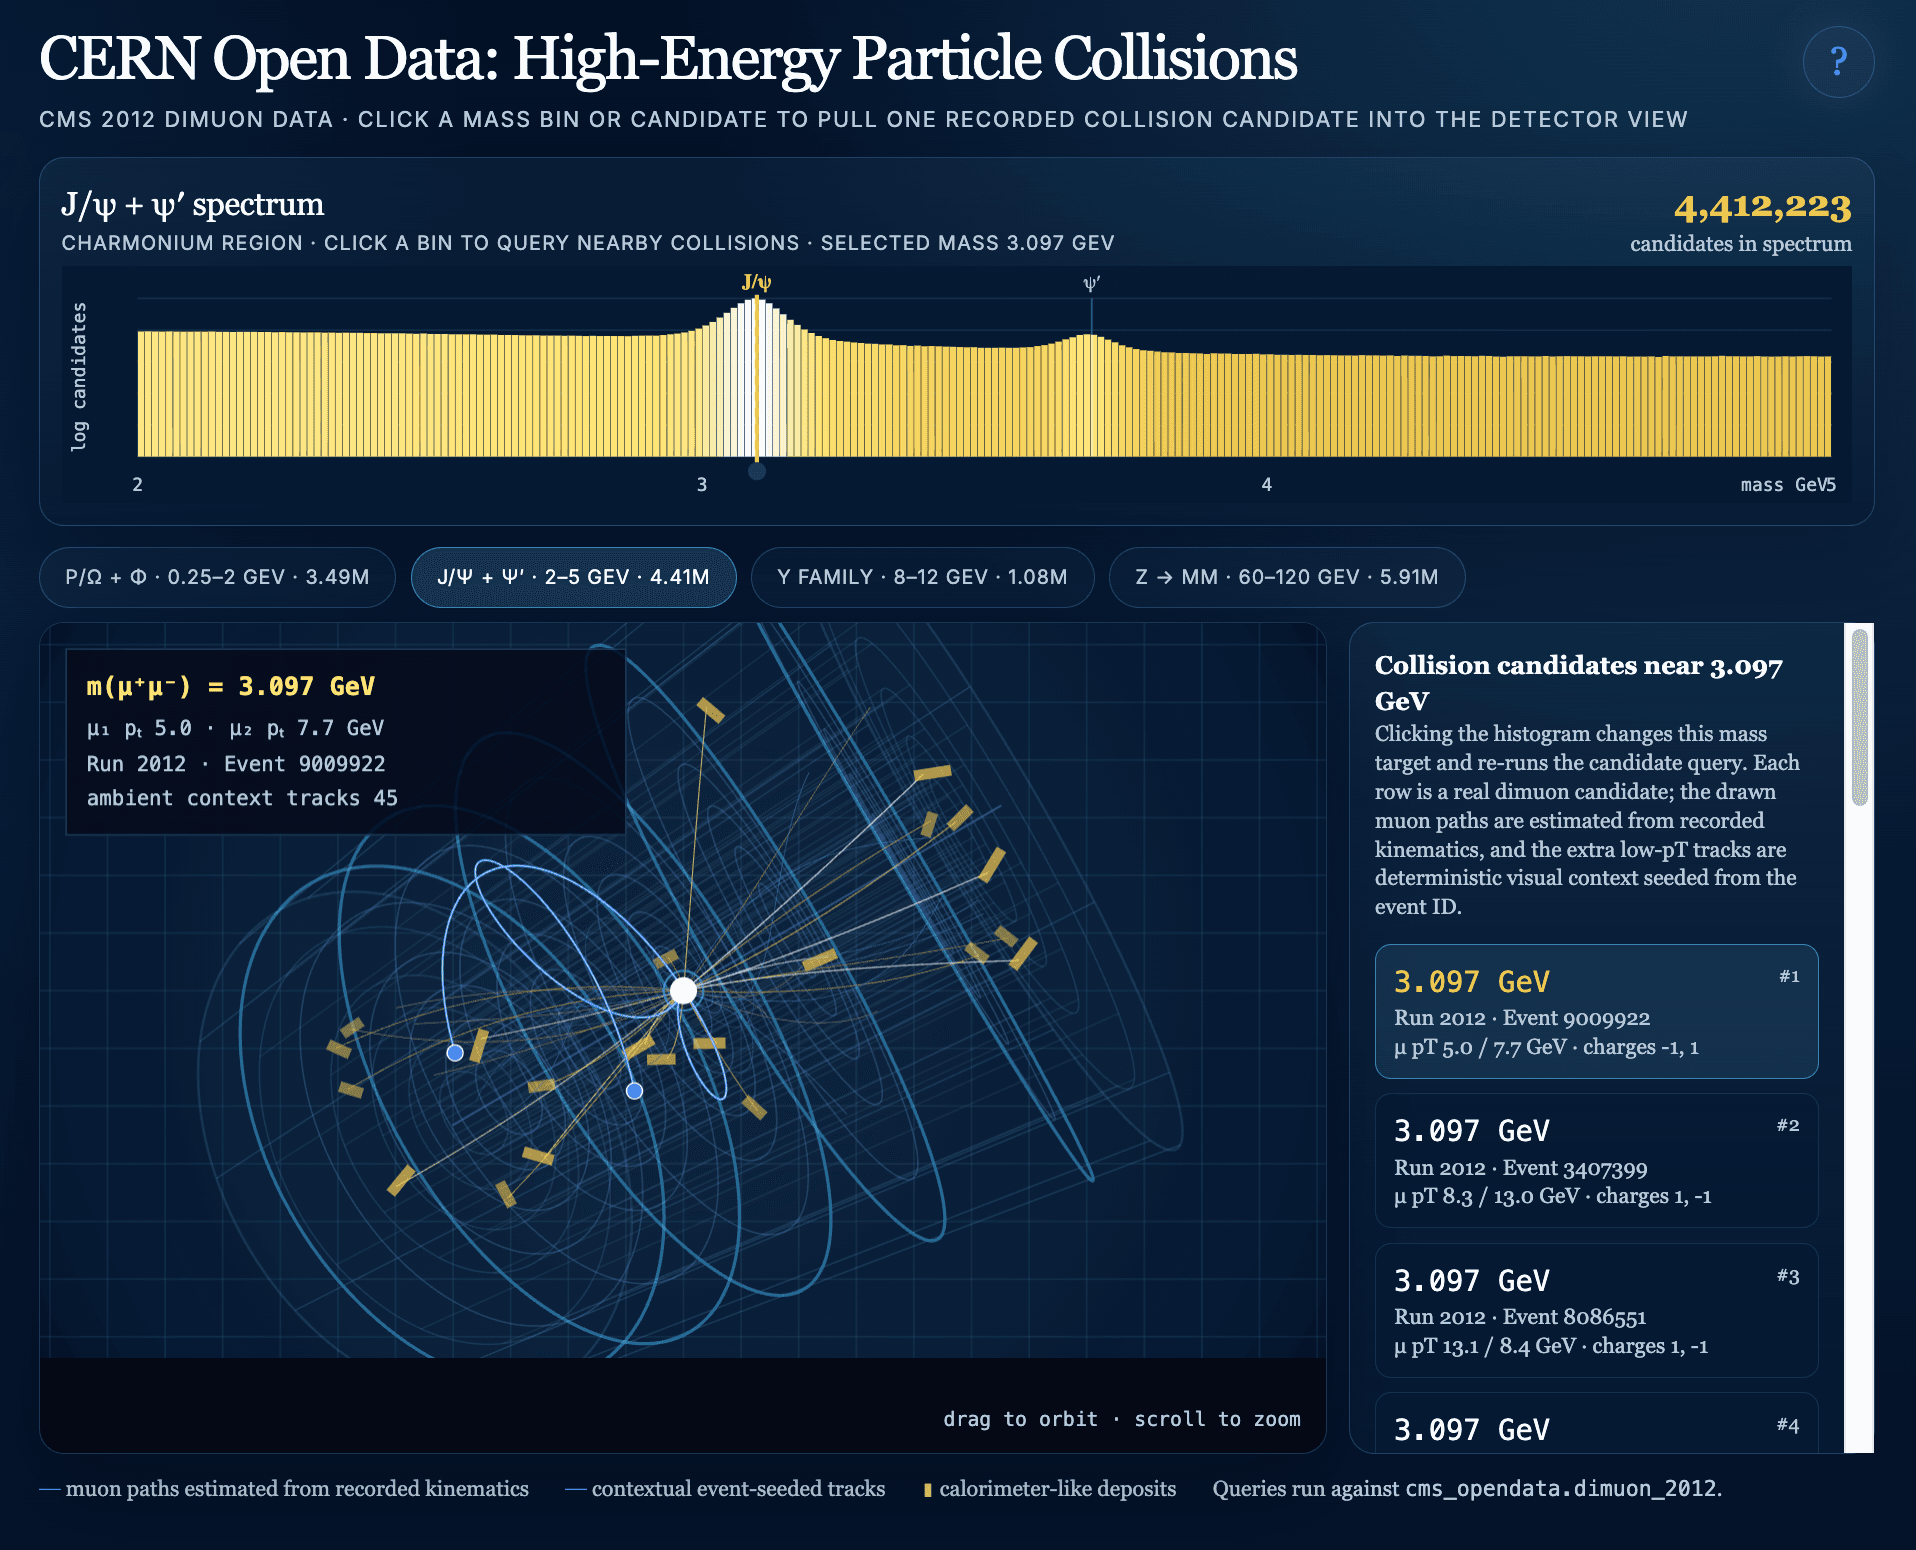
Loading Interactive Dive...
CERN Open Data: High-Energy Particle Collisions
Explore real CERN CMS Open Data with a curated educational dataset from 2012 through an interactive dimuon mass spectrum and WebGL embedded particle-collision event display. Click peaks in the histogram to browse reconstructed muon-pair candidates, see how invariant mass reveals hidden short-lived particles, and learn how CERN experiments use collision data to study the Standard Model, the Higgs boson, dark-matter particles and new physics.
ExplorerScienceData VizShowcaseMotherDuck
Author: Guen Prawiroatmodjo · June 14, 2026 Region: us-east-1
AI Prompts Used
1Prompt 1
(Claude prompts done via voice while on the beach)

What kind of data visualization is useful for high energy physics? So for example, CERN has all these large datasets, and I'm trying to come up with a demo for a dashboard that has a giant dataset and, like, live query set dataset in the background so you can have these, like, fast queries that run-in the background. Um, but the the visualization has to be very compelling and awe inspiring. Um, what kind of visualizations are there for high energy physics data that meet these prerequisites?

Can you show me an example of what that visualization looks like, and can you walk me through what kind of interactive widgets? Um, there would be and how they would change those data.

Can you also make an example of the awe shot collision viz and how it would interact with this visualization?
2Prompt 2
(In ChatGPT back home after manually loading an example educational dataset into MD)
create a new motherduck dive based on this prototype. can you use the data in cms_opendata.dimuon_2012 for this? I want to see the multiple collisions like in the example, and be able to browse the different spectra.
Comments
Log in to leave a comment.
No comments yet. Be the first!