FIFA World Cup Team DNA Comparison
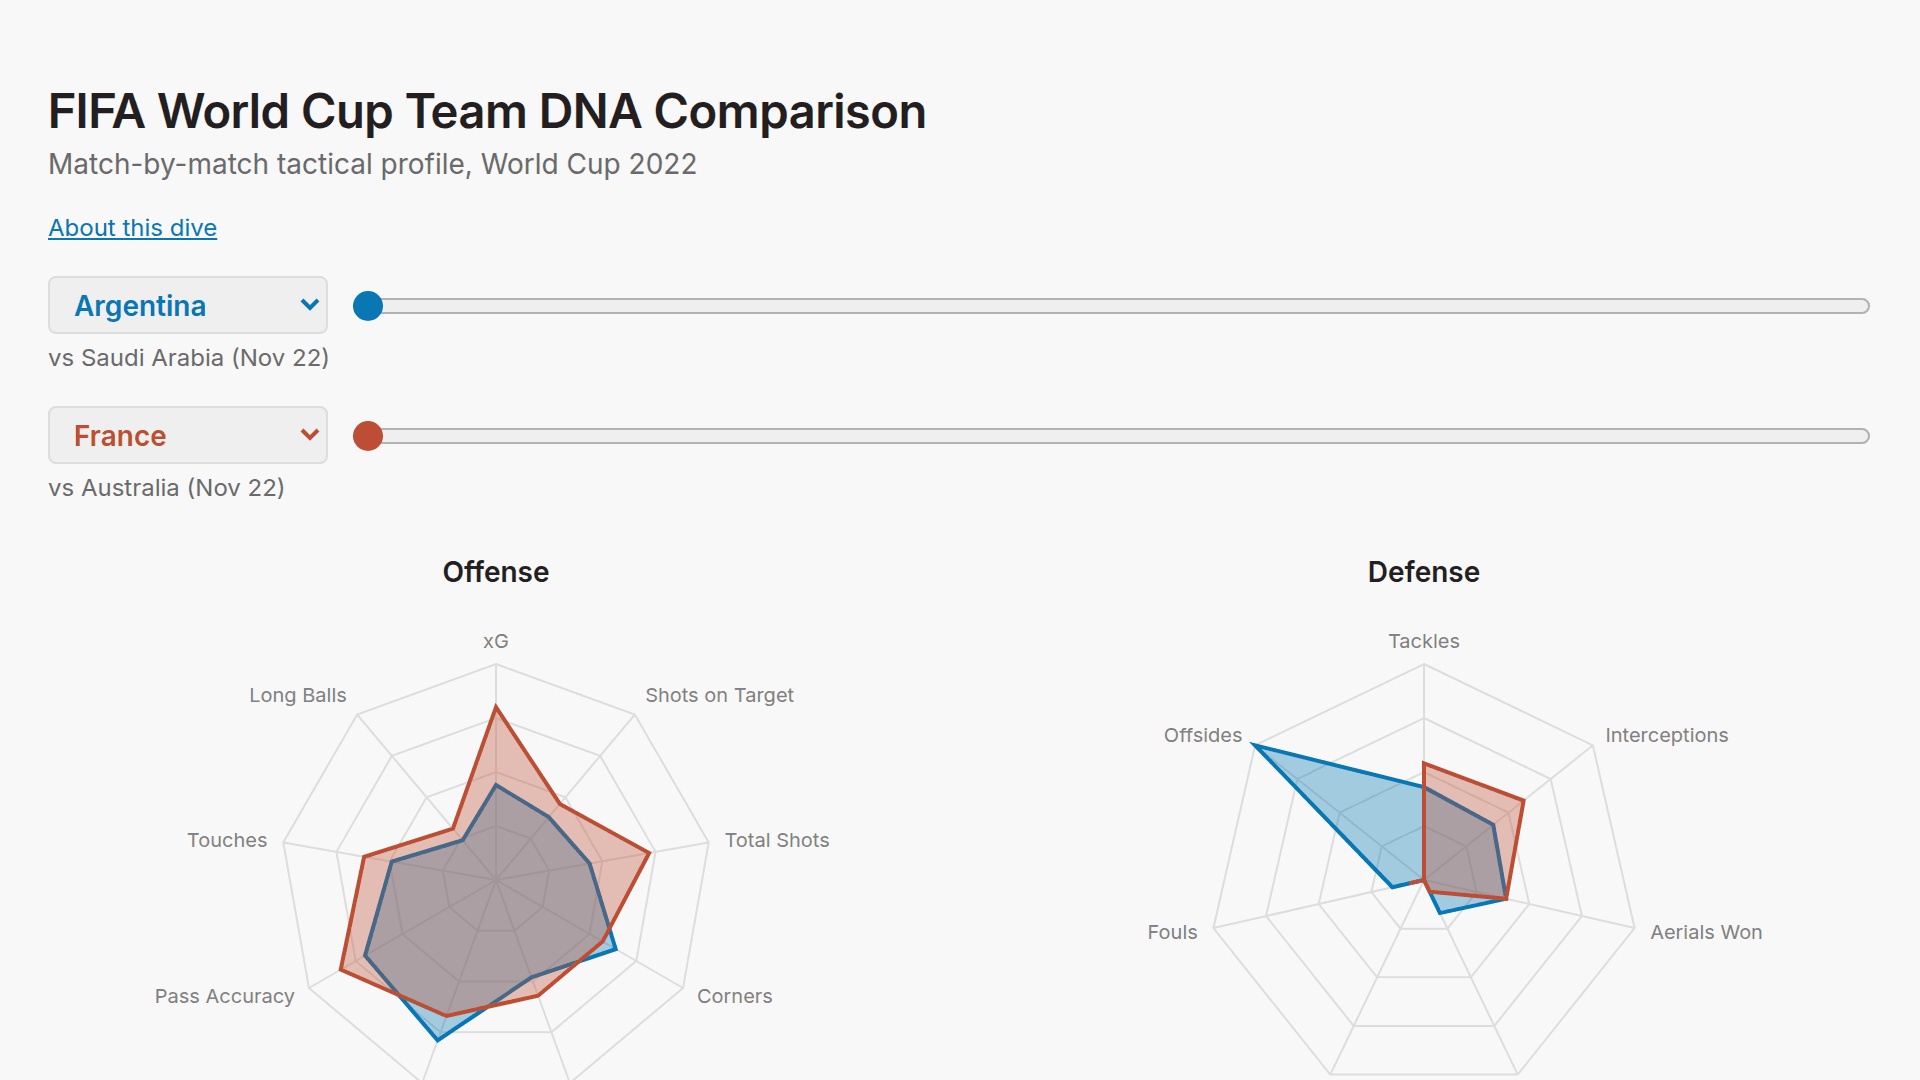
Compare any two World Cup 2022 teams' tactical "DNA" head-to-head, match by match. Each team has its own slider to step through their individual matches (group stage through the final) — choose any two matches, even from different stages of the tournament, and see how each team's playing style overlaps or contrasts. Two radar charts split the comparison into Offense and Defense so each stays readable: - Offense (9 metrics): xG, Shots on Target, Total Shots, Corners, Crosses, Possession, Pass Accuracy, Touches, Long Balls - Defense (7 metrics): Tackles, Interceptions, Aerials Won, Clearances, Saves, Fouls, Offsides All 16 values are normalized to a 0–100 scale (based on the tournament-wide min/max for that metric) so metrics on very different scales — like xG (0–5) and Touches (300–1200) — can sit on the same chart and be compared visually as shape, not raw numbers. Use it to spot stylistic mismatches (e.g. a high-possession, high-pass-accuracy team vs. a low-possession, high-tackle counter-attacking team) or to trace how a single team's tactical shape evolved from their opening group match to a knockout-stage performance.
Comments
Log in to leave a comment.
No comments yet. Be the first!