← Browse Dives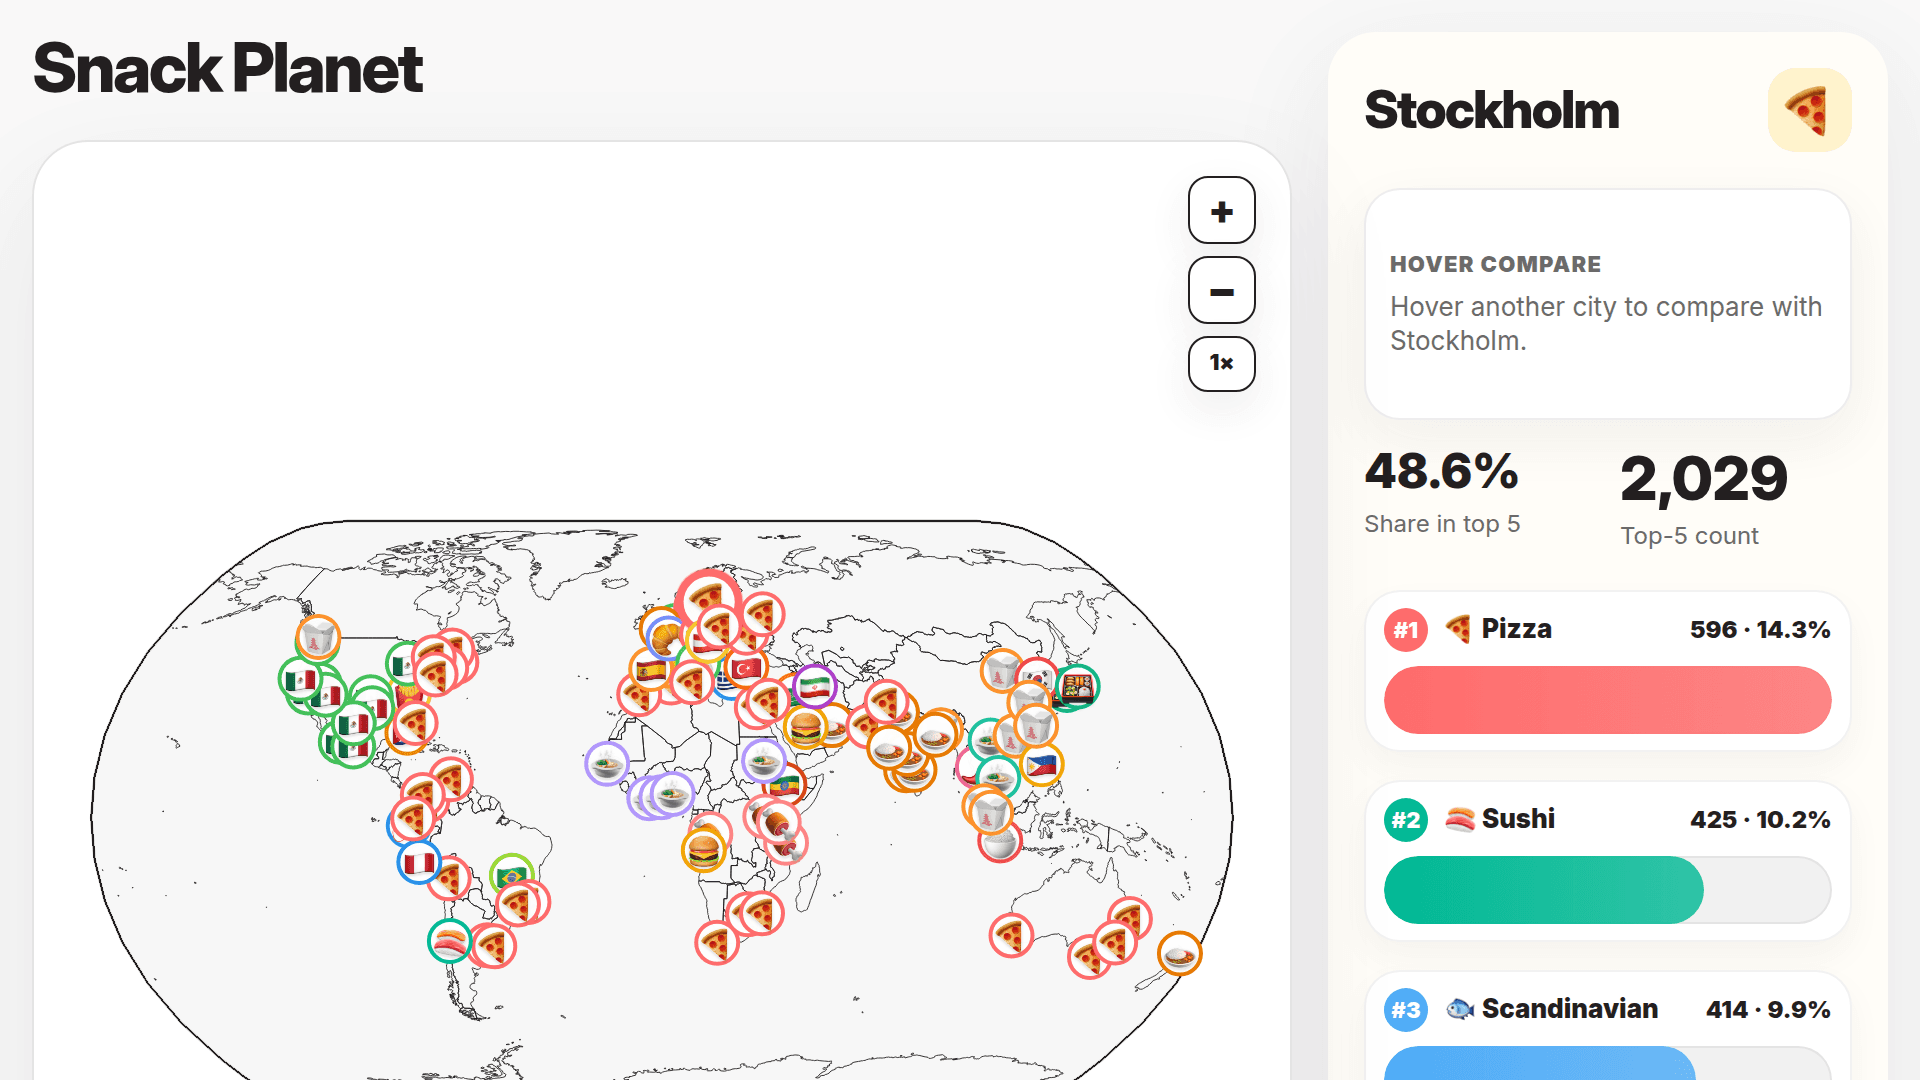
Loading Interactive Dive...
Snack Planet
Interactive world map with city-level restaurant emoji markers and top restaurant types from Overture Maps places data.
MapData Viz
Author: Alex Dahl · June 4, 2026 Region: us-east-1
AI Prompts Used
1Prompt 1
see initial prompt below. had to tweak it a lot to get it right, roughly 30 iterations

Create an interactive visualization for a dataset of city-level restaurant distributions. dataset is called `restaurant_city_summary`

The dataset has one row per city with:

* `city`
* `lon`
* `lat`
* `top_5_restaurants`

`top_5_restaurants` is a list of objects with:

* `rank`
* `type`
* `count`
* `share`

Build a simple exploratory app with two main views.

On the left, show a globe or world map with one marker per city, positioned using `lon` and `lat`.

On the right, show details for the selected city.

Default selected city: Stockholm.

When a user clicks a city marker on the globe, update the right panel to show:

1. City name
2. A simple horizontal bar chart of that city’s top 5 restaurant types
3. Each bar should show:

   * food emoji
   * readable restaurant type label
   * count
   * share percentage

Use `share` for the bar length and display it as a percentage.

Use this emoji mapping:

* `pizza_restaurant` → 🍕 Pizza
* `sushi_restaurant` → 🍣 Sushi
* `scandinavian_restaurant` → 🐟 Scandinavian
* `italian_restaurant` → 🍝 Italian
* `burger_restaurant` → 🍔 Burger
* `thai_restaurant` → 🌶️ Thai
* `ramen_restaurant` → 🍜 Ramen
* `japanese_restaurant` → 🍱 Japanese
* `chinese_restaurant` → 🥡 Chinese
* `steakhouse` → 🥩 Steakhouse
* `german_restaurant` → 🥨 German
* `vietnamese_restaurant` → 🍲 Vietnamese
* `asian_restaurant` → 🥢 Asian
* `french_restaurant` → 🥐 French
* `seafood_restaurant` → 🦐 Seafood
* `egyptian_restaurant` → 🧆 Egyptian
* `barbecue_restaurant` → 🍖 Barbecue
* `middle_eastern_restaurant` → 🧆 Middle Eastern
* `turkish_restaurant` → 🥙 Turkish
* `doner_kebab_restaurant` → 🥙 Doner Kebab
* `african_restaurant` → 🍛 African
* `bar_and_grill_restaurant` → 🍗 Bar & Grill
* `mexican_restaurant` → 🌮 Mexican
* `american_restaurant` → 🍟 American
* `taco_restaurant` → 🌮 Taco
* `chicken_restaurant` → 🍗 Chicken
* `czech_restaurant` → 🍺 Czech
* `brazilian_restaurant` → 🥘 Brazilian

For any restaurant type not in the mapping, use:

* `other` → 🍽️ Other

Clean labels by removing `_restaurant`, replacing underscores with spaces, and title-casing the result.

The design should feel minimal, polished, and playful.

Suggested title:

“What Does Your City Eat?”

Subtitle:

“Top restaurant types from Overture Maps places data.”

Interaction details:

* Hovering a city marker should show the city name.
* Clicking a marker selects the city.
* The selected city marker should be visually highlighted.
* The right panel should update immediately.
* The bar chart should animate when the selected city changes.
* Sort bars by `rank`, not alphabetically.
* Display shares as percentages with one decimal place.
* Display counts as whole numbers.

The visualization should emphasize comparison between cities, not raw data exploration. Keep the interface simple: globe on the left, restaurant DNA panel on the right.
Comments
Log in to leave a comment.
No comments yet. Be the first!