← Browse Dives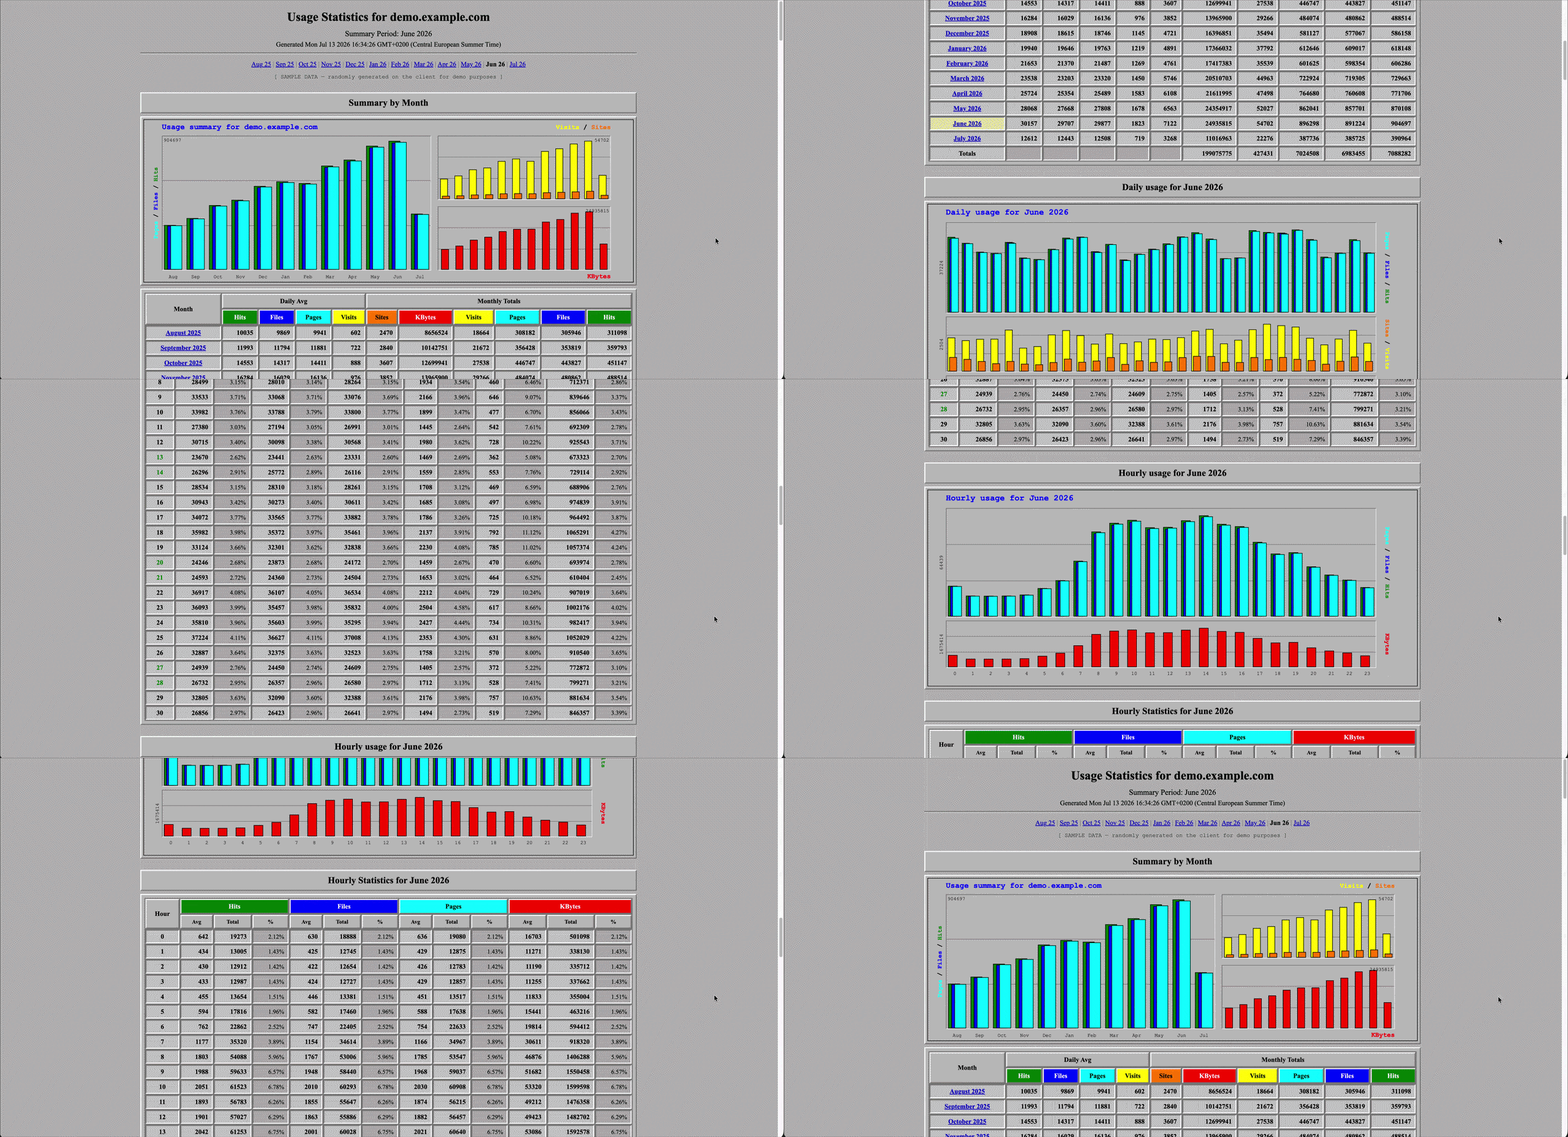
Loading Interactive Dive...
Webalizer Themed Analytics (demo)
Gallery-ready, fully self-contained retro Webalizer 2.x report. Generates deterministic sample AI-traffic data for the trailing 12 months automatically (no database or share required) — Summary by Month, daily & hourly usage graphs with overlapping bars, and Top URLs / User Agents / Sites / Referrers tables. Pure demo: all numbers are randomly generated on the client.
ShowcaseData Viz
Author: Dumky de Wilde · July 13, 2026 Region: us-east-1
AI Prompts Used
1Prompt 1
Build me a MotherDuck Dive that renders web/AI-traffic analytics as a period-accurate Webalizer 2.x server-log report (the late-90s/early-2000s look). It's a deliberate retro pastiche — lean all the way into the aesthetic.
Data source: <your table, e.g. db.schema.request_logs>. Columns available: timestamp, path, status_code, user_agent, client_ip, referer (+ any category fields). If a metric isn't in the data (e.g. bytes transferred), synthesize it deterministically from the row (e.g. hash(path) % 42000 + 6000) and add a visible one-line disclaimer. Validate the SQL and reconcile totals before finalizing.
Map data → the six Webalizer metrics: Hits = all requests; Files = status_code IS NULL OR < 400; Pages = non-asset paths; Sites = distinct client_ip; Visits = 30-minute sessionization per IP (LAG over event time); KBytes = summed (synthesized) bytes /1024.
Sections, in order: header (Usage Statistics for <domain> / Summary Period / Generated timestamp); a month selector; Summary by Month (split graph + Daily Avg/Monthly Totals table with a Totals row); Daily usage graph + Daily Statistics table (value + % per metric); Hourly usage graph + Hourly Statistics table (Avg/Total/%); Top URLs, Top User Agents, Top Sites, Top Referrers; a "Generated by The Webalizer Ver. 2.23-08" footer.
Exact visual rules (this is where fidelity lives):

Layout in a centered ~1000px fixed-width column on a grey page (#b6b6b6); everything wrapped in #c0c0c0 raised 3D bevel chrome (Win95 style: light top/left, dark bottom/right).
Fonts: Times/serif for tables and titles, Courier/mono for graph titles and axis labels; graph titles in blue (#0000ff).
Canonical Webalizer palette: Hits #008000 (dark green), Files #0000FF, Pages #00FFFF, Visits #FFFF00, Sites #FF8000, KBytes #FF0000.
Bars (custom SVG, not a chart lib): overlapping, equal-width, each series drawn back-to-front and shifted a few px right (green Hits behind → blue Files → cyan Pages in front).
Summary graph is a split layout: big left panel = Pages/Files/Hits; right third split into Visits/Sites (top) and KBytes (bottom). Axis labels are per-token colored to match their bars (Pages/Files/Hits etc.), rotated on the sides. Daily/hourly graphs use three stacked lanes instead.
Panels: grey (#c0c0c0) fill with a sunken/inset bevel (dark top-left, light bottom-right) so they look "dropped in"; two dark-grey (#808080) horizontal gridlines behind the bars; a single 1px black frame on the outside of each whole chart. Weekend day-labels colored green.
Tables = classic <table border=2>: border-collapse: separate with 2px dark-grey gaps; raised colored header cells; inset data cells; no white — cells are light grey (#c8c8c8) with darker grey (#b0b0b0) percentage/blank cells.

First ask me: (1) live Dive vs self-contained gallery demo, and (2) how faithful to go. For a gallery demo, generate deterministic sample data (seeded PRNG) for the trailing 12 months with a gentle upward trend + weekend dips, set REQUIRED_DATABASES = [], use a fake domain, and add a "SAMPLE DATA" banner.
Comments
Log in to leave a comment.
No comments yet. Be the first!