Geospatial analysis has always been an important topic in data, but pretty hard to dive into. One big reason for this is that it's just hard to get you set up. There are many standards, tools, and dependencies in geospatial that it can be challenging to iterate around data, transform it, and plot something.
That being said, we have a couple of new tools, including DuckDB and MotherDuck, which helps move much faster—or should I say quack louder?
In this blog, we'll recap the basics of geospatial data—just enough to start building and creating this heatmap about Electric vehicle charging spots using DuckDB and a Python library for visualization.
Heatmap of EV charging spots in France
The code is available here and in case you prefer watching over reading - I got you covered.
What you need for geospatial
To start your journey around geospatial, you need essentially 3 things.
- Knowledge of geospatial analysis, which would include (non-exhaustive list):
- Understanding geometries
- Spatial relationship & spatial joins
- Understanding standard file formats for geospatial
- Something to read, process, and export geospatial data
- Something to visualize what you are doing and iterate We'll only introduce some basic concepts for building the heatmap. If you want to explore these further, I recommend Dr. Qiusheng Wu's free online course.
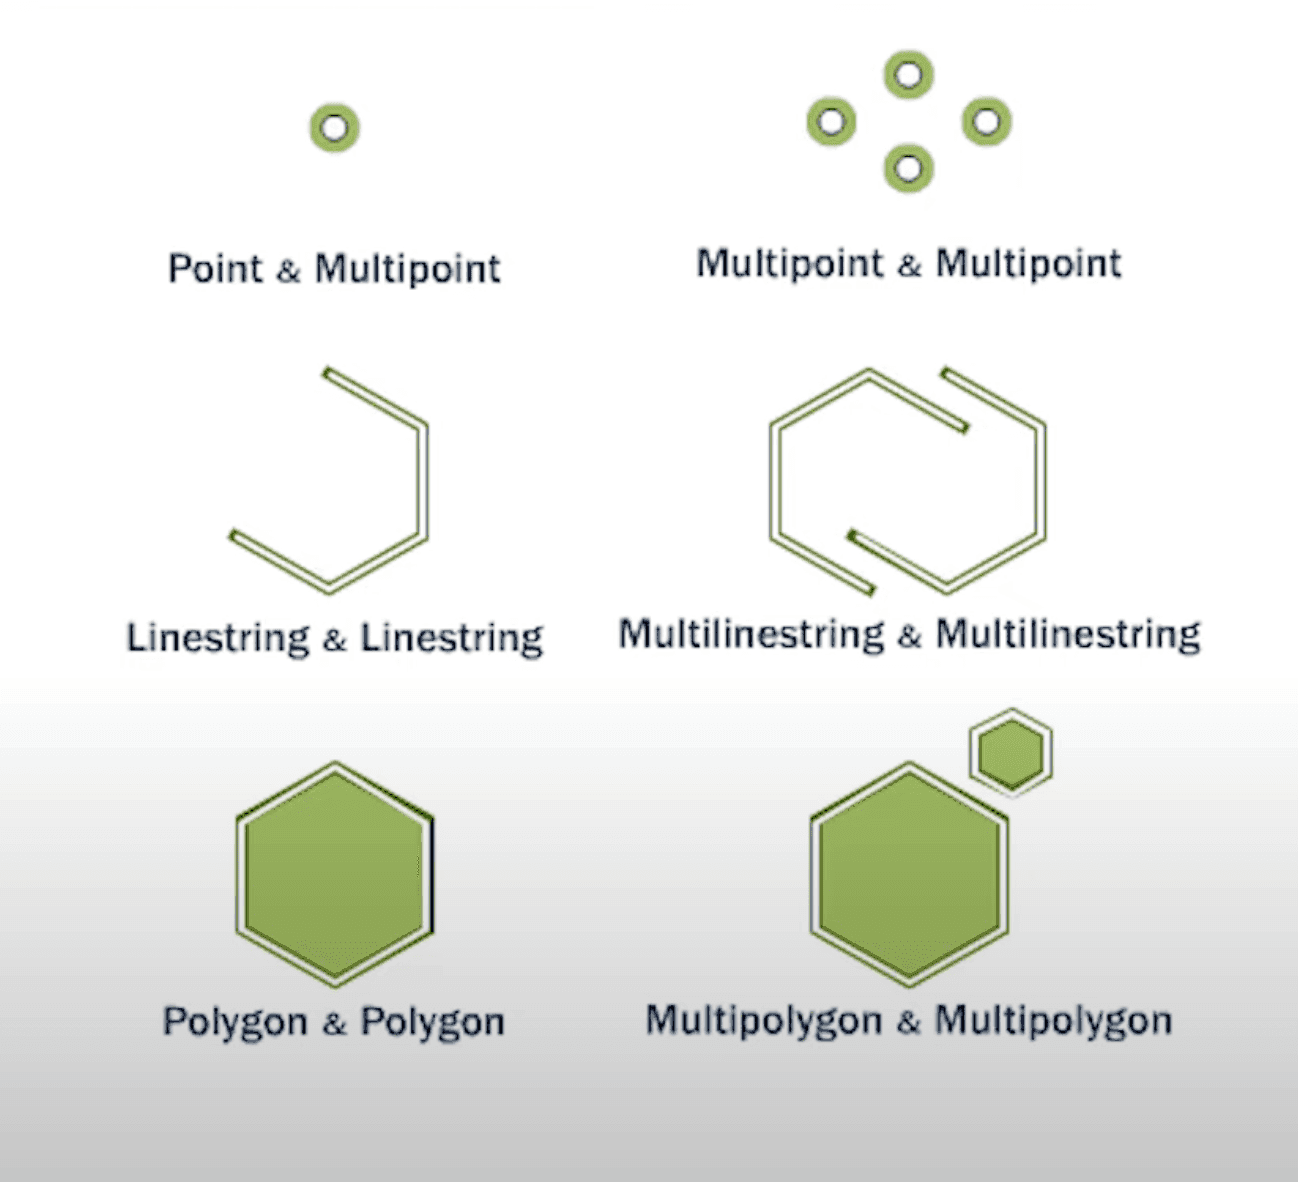
Understanding geometries
When working with geospatial functions, you will learn how to work with geometries. In short, these can be points, lines, polygons, or collections of them.
Many databases support spatial function and spatial type to store these geometries, and they are typically prefixed with ST_, which stands for "spatial and temporal".
So if you have a coordinate - a point in spatial type - you would convert it with DuckDB by just using the ST_Point from the spatial extension.
An example using the DuckDB CLI :
Copy code
D install spatial;
D load spatial;
D SELECT ST_Point(30, 50) AS location;
┌───────────────┐
│ location │
│ geometry │
├───────────────┤
│ POINT (30 50) │
└───────────────┘
File format
The second important point regarding geospatial is the file format. To share geospatial data, there are multiple formats you can work with:
- Vector data represents the discrete features we discussed above, such as points, lines, and polygons (e.g., city locations and roads).
- Raster data is more like a photo and represents continuous information. It consists of a grid of cells (or pixels), and each cell has a value representing something, like temperature, elevation, or colors in a satellite image.
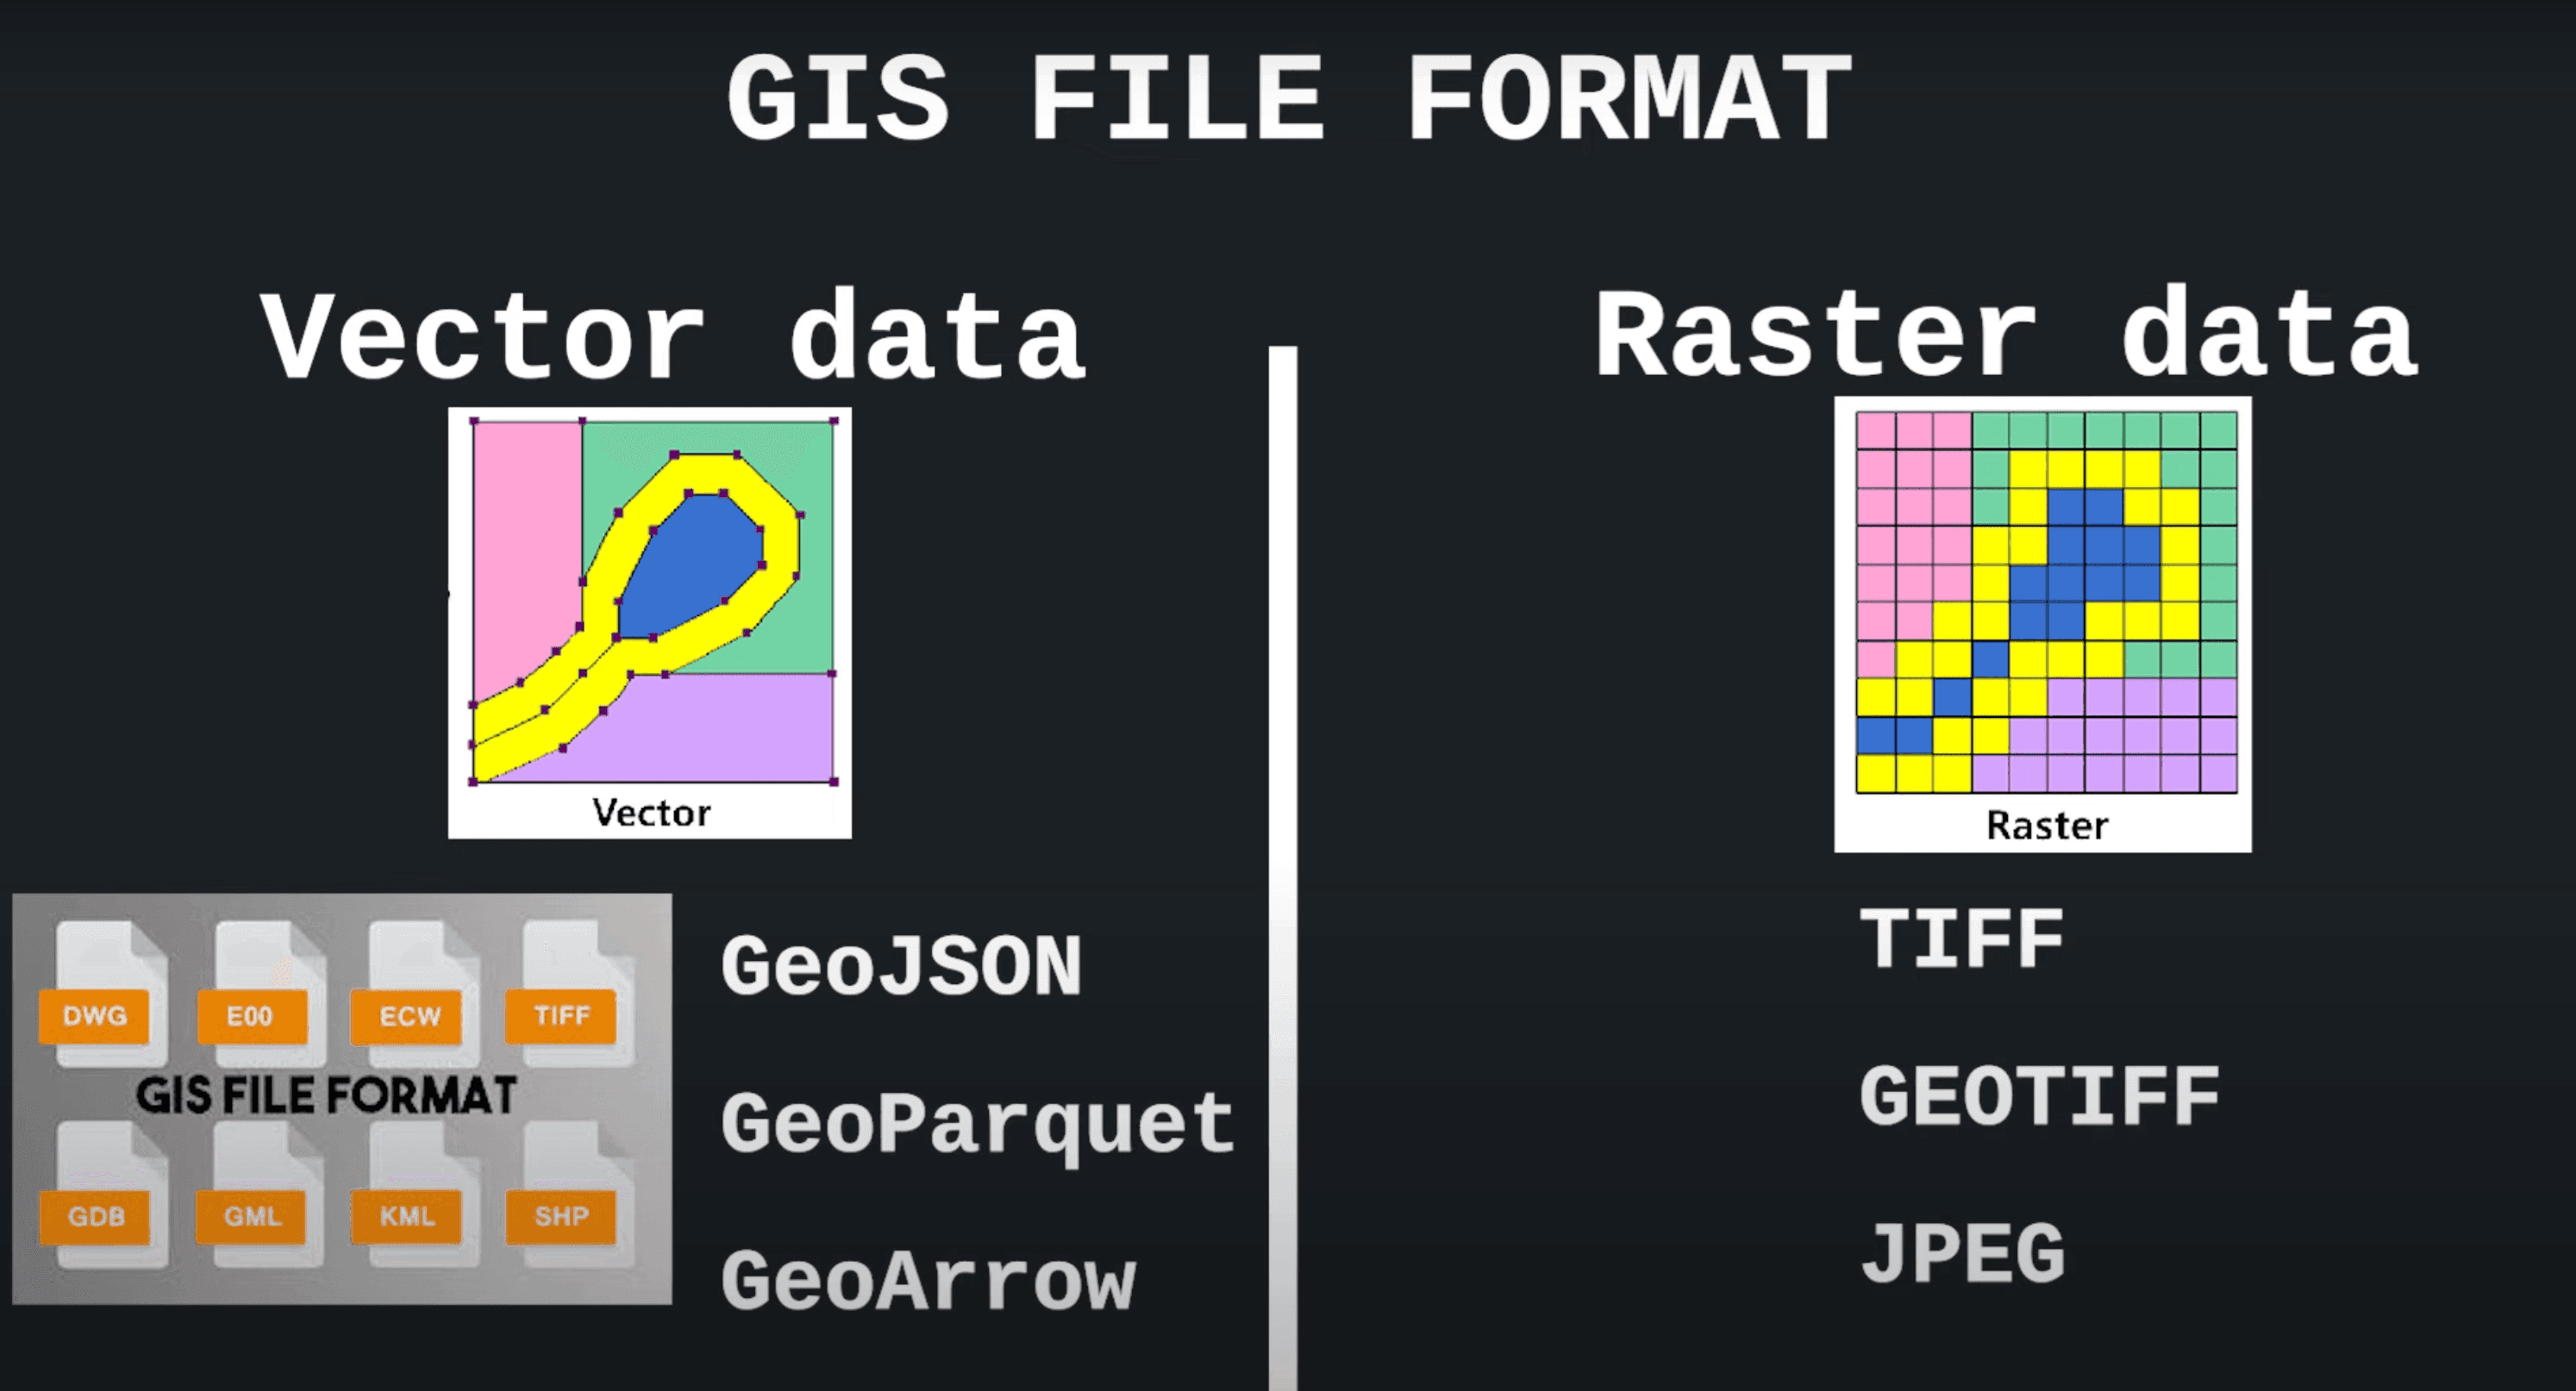
You can find both on the web, but vector data are usually easier to share because of their smaller size.
GeoJSON is the easiest one to work with, as you can directly edit, but it's pretty inefficient in terms of size.
GeoParquet adoption has been increasing, yet not many tools support it. However, there's no need to worry—DuckDB does!
DuckDB has many possibilities to read/write from many of these.
You can use the table function FROM ST_Drivers(); to display all supported drivers.
Copy code
D FROM ST_Drivers();
┌────────────────┬──────────────────────────────────────────────────────┬────────────┬──────────┬──────────┬────────────────────────────────────────────────────┐
│ short_name │ long_name │ can_create │ can_copy │ can_open │ help_url │
│ varchar │ varchar │ boolean │ boolean │ boolean │ varchar │
├────────────────┼──────────────────────────────────────────────────────┼────────────┼──────────┼──────────┼────────────────────────────────────────────────────┤
│ ESRI Shapefile │ ESRI Shapefile │ true │ false │ true │ https://gdal.org/drivers/vector/shapefile.html │
│ MapInfo File │ MapInfo File │ true │ false │ true │ https://gdal.org/drivers/vector/mitab.html │
│ UK .NTF │ UK .NTF │ false │ false │ true │ https://gdal.org/drivers/vector/ntf.html │
│ LVBAG │ Kadaster LV BAG Extract 2.0 │ false │ false │ true │ https://gdal.org/drivers/vector/lvbag.html │
│ S57 │ IHO S-57 (ENC) │ true │ false │ true │ https://gdal.org/drivers/vector/s57.html │
│ DGN │ Microstation DGN │ true │ false │ true │ https://gdal.org/drivers/vector/dgn.html │
│ OGR_VRT │ VRT - Virtual Datasource │ false │ false │ true │ https://gdal.org/drivers/vector/vrt.html │
│ Memory │ Memory │ true │ false │ true │ │
│ CSV │ Comma Separated Value (.csv) │ true │ false │ true │ https://gdal.org/drivers/vector/csv.html │
│ GML │ Geography Markup Language (GML) │ true │ false │ true │ https://gdal.org/drivers/vector/gml.html │
│ GPX │ GPX │ true │ false │ true │ https://gdal.org/drivers/vector/gpx.html │
│ KML │ Keyhole Markup Language (KML) │ true │ false │ true │ https://gdal.org/drivers/vector/kml.html │
This makes it super helpful again to convert and join data in a standard format, which is usually a big preparation step for a geospatial project.
As I mentioned in the intro, there are many standards! It's nice to prepare all your geo data with a single tool.
Getting your tools ready
Now that we understand the fundamentals, let's see what we need regarding tooling. You can use SQL and DuckDB, but you still need something to display the data.
A typical stack is to use Python in a notebook environment to render the results directly. We'll use a Google Collab but any notebook environment is good for you, it's just for the simplicity of this tutorial and sharing.
Regarding the data visualization library, again, there are many options. Leafmap is definitely interesting and pretty mature to use. For this blog, however, I'll show you a new kid on the block called Lonboard. It's performant because it doesn't use GeoJSON as an intermediate step to transfer the data to the front end, as many of these tools do. Plus, it supports direct integration with DuckDB.
Now, let's zoom in on the code and the data.
About the source dataset
We'll use data from Open Charge Map (OCM). This website aims to document the world's Electric Vehicle (EV) Charging Points. They have produced a dataset of over 200K+ charging point locations around the world, and the data is sourced from volunteers as well as official sources. But what's is great is that they have a public API easy to use and well-documented 👏
We can get the charging points with a single request and filter by a bounding box. I filtered around France, and I want to understand the "dead zones" where there are no EV charging points in France. To get the bounding box coordinates around France, I simply asked ChatGPT to generate these.
Building the map
We start by installing the Python dependencies DuckDB & Lonboard. Note that on Google Collab, at this point where the blog is written, there's a conflict to install the latest DuckDB if Malloy is installed. As we won't use it, we can uninstall it.
Copy code
# Installing geo viz tool Lonboard and DuckDB
# Latest version installed on collab of Malloy is incompatible with DuckDB 1.1.0
!pip uninstall malloy --y
!pip install lonboard duckdb==1.1.0
First, we create a DuckDB connection and install the spatial extension.
To query the data from a public remote API that returns JSON, you can directly use the read_json_auto() from DuckDB with the URL endpoint.
Copy code
import duckdb
# Initialize DuckDB connection
con = duckdb.connect()
# Load spatial extension
con.sql('INSTALL spatial;')
con.sql('LOAD spatial;')
# URL for France data
poi_url = 'https://api-01.openchargemap.io/v3/poi?client=ocm-data-export&maxresults=100000&compact=true&verbose=false&boundingbox=(51.124,-5.142),(41.342,9.562)'
# Ingest the data from the API and create as a table
con.sql(f"CREATE TABLE poi_france AS SELECT * FROM read_json_auto('{poi_url}')")
Once our data is loaded in the poi_france table, the only thing left is to transform the longitude and latitude field into a geometry type.
Two things interesting to note :
- To access a field in a complex nested type, we can use the dot
.annotation. ST_Pointis the spatial function to transform the longitude and latitude as geometry type.
Copy code
# Transform and query data
sql = """
SELECT ID,
ST_Point(AddressInfo.Longitude, AddressInfo.Latitude) AS geom,
AddressInfo.Title AS Title
FROM poi_france
WHERE AddressInfo.Latitude IS NOT NULL
AND AddressInfo.Longitude IS NOT NUL
"""
# Execute the query and fetch results
query = con.sql(sql)
Finally, we can inspect the final dataset and notice now the POINT data type.
Copy code
┌────────┬───────────────────────────────────────────────┬───────────────────────────────────────────────┐
│ ID │ geom │ Title │
│ int64 │ geometry │ varchar │
├────────┼───────────────────────────────────────────────┼───────────────────────────────────────────────┤
│ 203362 │ POINT (-5.075207325926755 43.448421243964304) │ Hotel Rural La Curva │
│ 299450 │ POINT (-5.06783854990374 43.465030087046614) │ Hotel Villa Rosario │
│ 209224 │ POINT (-5.06419388654615 43.46594466895118) │ Gran Hotel del Sella │
│ 201363 │ POINT (-5.062485285379808 43.43078297825821) │ Rest. Canoas La Ribera │
│ 194441 │ POINT (-5.129921424610529 43.348744254371155) │ Hotel Cangas de Onis Center │
│ 265109 │ POINT (-5.112427896960327 43.33982803064052) │ Apartamentos el Coritu │
│ 271112 │ POINT (-5.1120723 43.350132) │ Tanatorio Cangas de Onís │
│ 117706 │ POINT (-5.12532666805556 43.35258395) │ Avenida de los Picos de Europa │
The only thing left now is to display this. To create a map, we first create a layer, which is here a HeatmapLayer, and load data using the from_duckdb method.
Copy code
from lonboard import Map, HeatmapLayer
layer = HeatmapLayer.from_duckdb(query, con)
m = Map(layer)
m
And that's it; the whole thing takes less than 15 lines of code!
Moving to the cloud
You can create an account in MotherDuck for free. Once sign-up, you can get your access token in the settings menu.
Connecting to MotherDuck is simply as changing one line of code, using md: in the duckdb.connect() line - this assumes we set motherduck_token as an environment variable to authenticate to MotherDuck.
Copy code
import duckdb
# Initialize a MotherDuck Connection
con = duckdb.connect('md:')
# Load spatial extension
con.sql('INSTALL spatial;')
con.sql('LOAD spatial;')
# URL filtered with bounding box around France data
poi_url = 'https://api-01.openchargemap.io/v3/poi?client=ocm-data-export&maxresults=100000&compact=true&verbose=false&boundingbox=(51.124,-5.142),(41.342,9.562)'
# Ingest the data from the API and create as a table
# Create database if not exist
con.sql("CREATE DATABASE IF NOT EXISTS geo_playground")
con.sql(f"CREATE TABLE IF NOT EXISTS geo_playground.poi_france AS SELECT * FROM read_json_auto('{poi_url}')")
Now, the above query and the rest of the pipeline will leverage cloud computing.
Copy code
# Uploading the current local table to MotherDuck
sql = """ CREATE TABLE IF NOT EXISTS geo_playground.poi_france_display AS
SELECT ID,
ST_Point(AddressInfo.Longitude, AddressInfo.Latitude) AS geom,
AddressInfo.Title AS Title
FROM geo_playground.poi_france
WHERE AddressInfo.Latitude IS NOT NULL
AND AddressInfo.Longitude IS NOT NULL
"""
con.sql(sql)
Finally, as shown below, you can reuse the database and even share it with one line of code .
Copy code
from lonboard import Map, HeatmapLayer
query = con.sql("SELECT * FROM geo_playground.poi_france_display")
layer = HeatmapLayer.from_duckdb(query, con)
m = Map(layer)
Copy code
# Create a MotherDuck Share to share with other MotherDuck users
con.sql("CREATE SHARE IF NOT EXISTS ev_poi_france FROM geo_playground (ACCESS UNRESTRICTED);")
To export into a flat file, for instance GeoJSON, it's a simple as :
Copy code
# Export to geojson
con.sql("COPY geo_playground.poi_france_display TO './ev_poi_france.geojson' WITH (FORMAT GDAL, DRIVER 'GeoJSON');")
Moving forward with geospatial applications
In this blog, we saw how DuckDB is an excellent Swiss army knife for spatial data, as it enables us to quickly pull and transform from various spatial formats. We also saw how easy it is to use it with other Python libraries like Lonboard for visualization.
Finally, we learned how to leverage the cloud with MotherDuck and create a share or export your data to a local file like GeoJSON.
DuckDB and MotherDuck are democratizing access to geospatial work by supporting many needed features with a lightweight setup. You can read more about the spatial extension here and listen to a talk with the main contributer of the spatial extension from DuckDB Labs, Max Gabrielsson here
Until the following map, keep quacking and keep coding.