Product Analytics with MotherDuck & DuckDB: A Practical SQL Guide
15 min readBY
Product analytics is essential for understanding user behavior, driving engagement, and ultimately achieving business growth. Deriving meaningful insights from raw event and user data is crucial, and having the right tools can make all the difference. This is where MotherDuck and DuckDB shine, offering a powerful, flexible, and efficient solution for product analytics workflows.
DuckDB is an in-process analytical database system, designed for Online Analytical Processing (OLAP) workloads. It's known for its speed, ease of use, and ability to handle large datasets on a single machine, even exceeding available RAM by using disk space. MotherDuck complements DuckDB by providing a serverless, cloud-based platform that enables persistent storage, data sharing, and hybrid execution, combining the power of the cloud with the performance of local DuckDB instances. This makes the combination ideal for product analytics, allowing data professionals to perform complex analyses directly on their data with the familiarity and power of SQL.
In this article, we'll explore how to leverage MotherDuck and DuckDB to compute key product analytics metrics. We'll define a hypothetical data model and provide SQL queries to calculate each metric, demonstrating the capabilities of DuckDB for this use case.
Index: Metrics Covered
Here is a list of the key product analytics metrics we will learn to calculate in this article:
- Monthly Recurring Revenue (MRR)
- User Engagement (DAU, WAU, MAU, Session Duration, Sessions per User)
- Feature Adoption
- User Retention
- Churn Rate (User Churn, MRR Churn)
- Customer Lifetime Value (CLTV or LTV)
- Net Promoter Score (NPS)
- Conversion Rate
- Time to Value (TTV)
- User Funnel Analysis
- Customer Acquisition Cost (CAC)
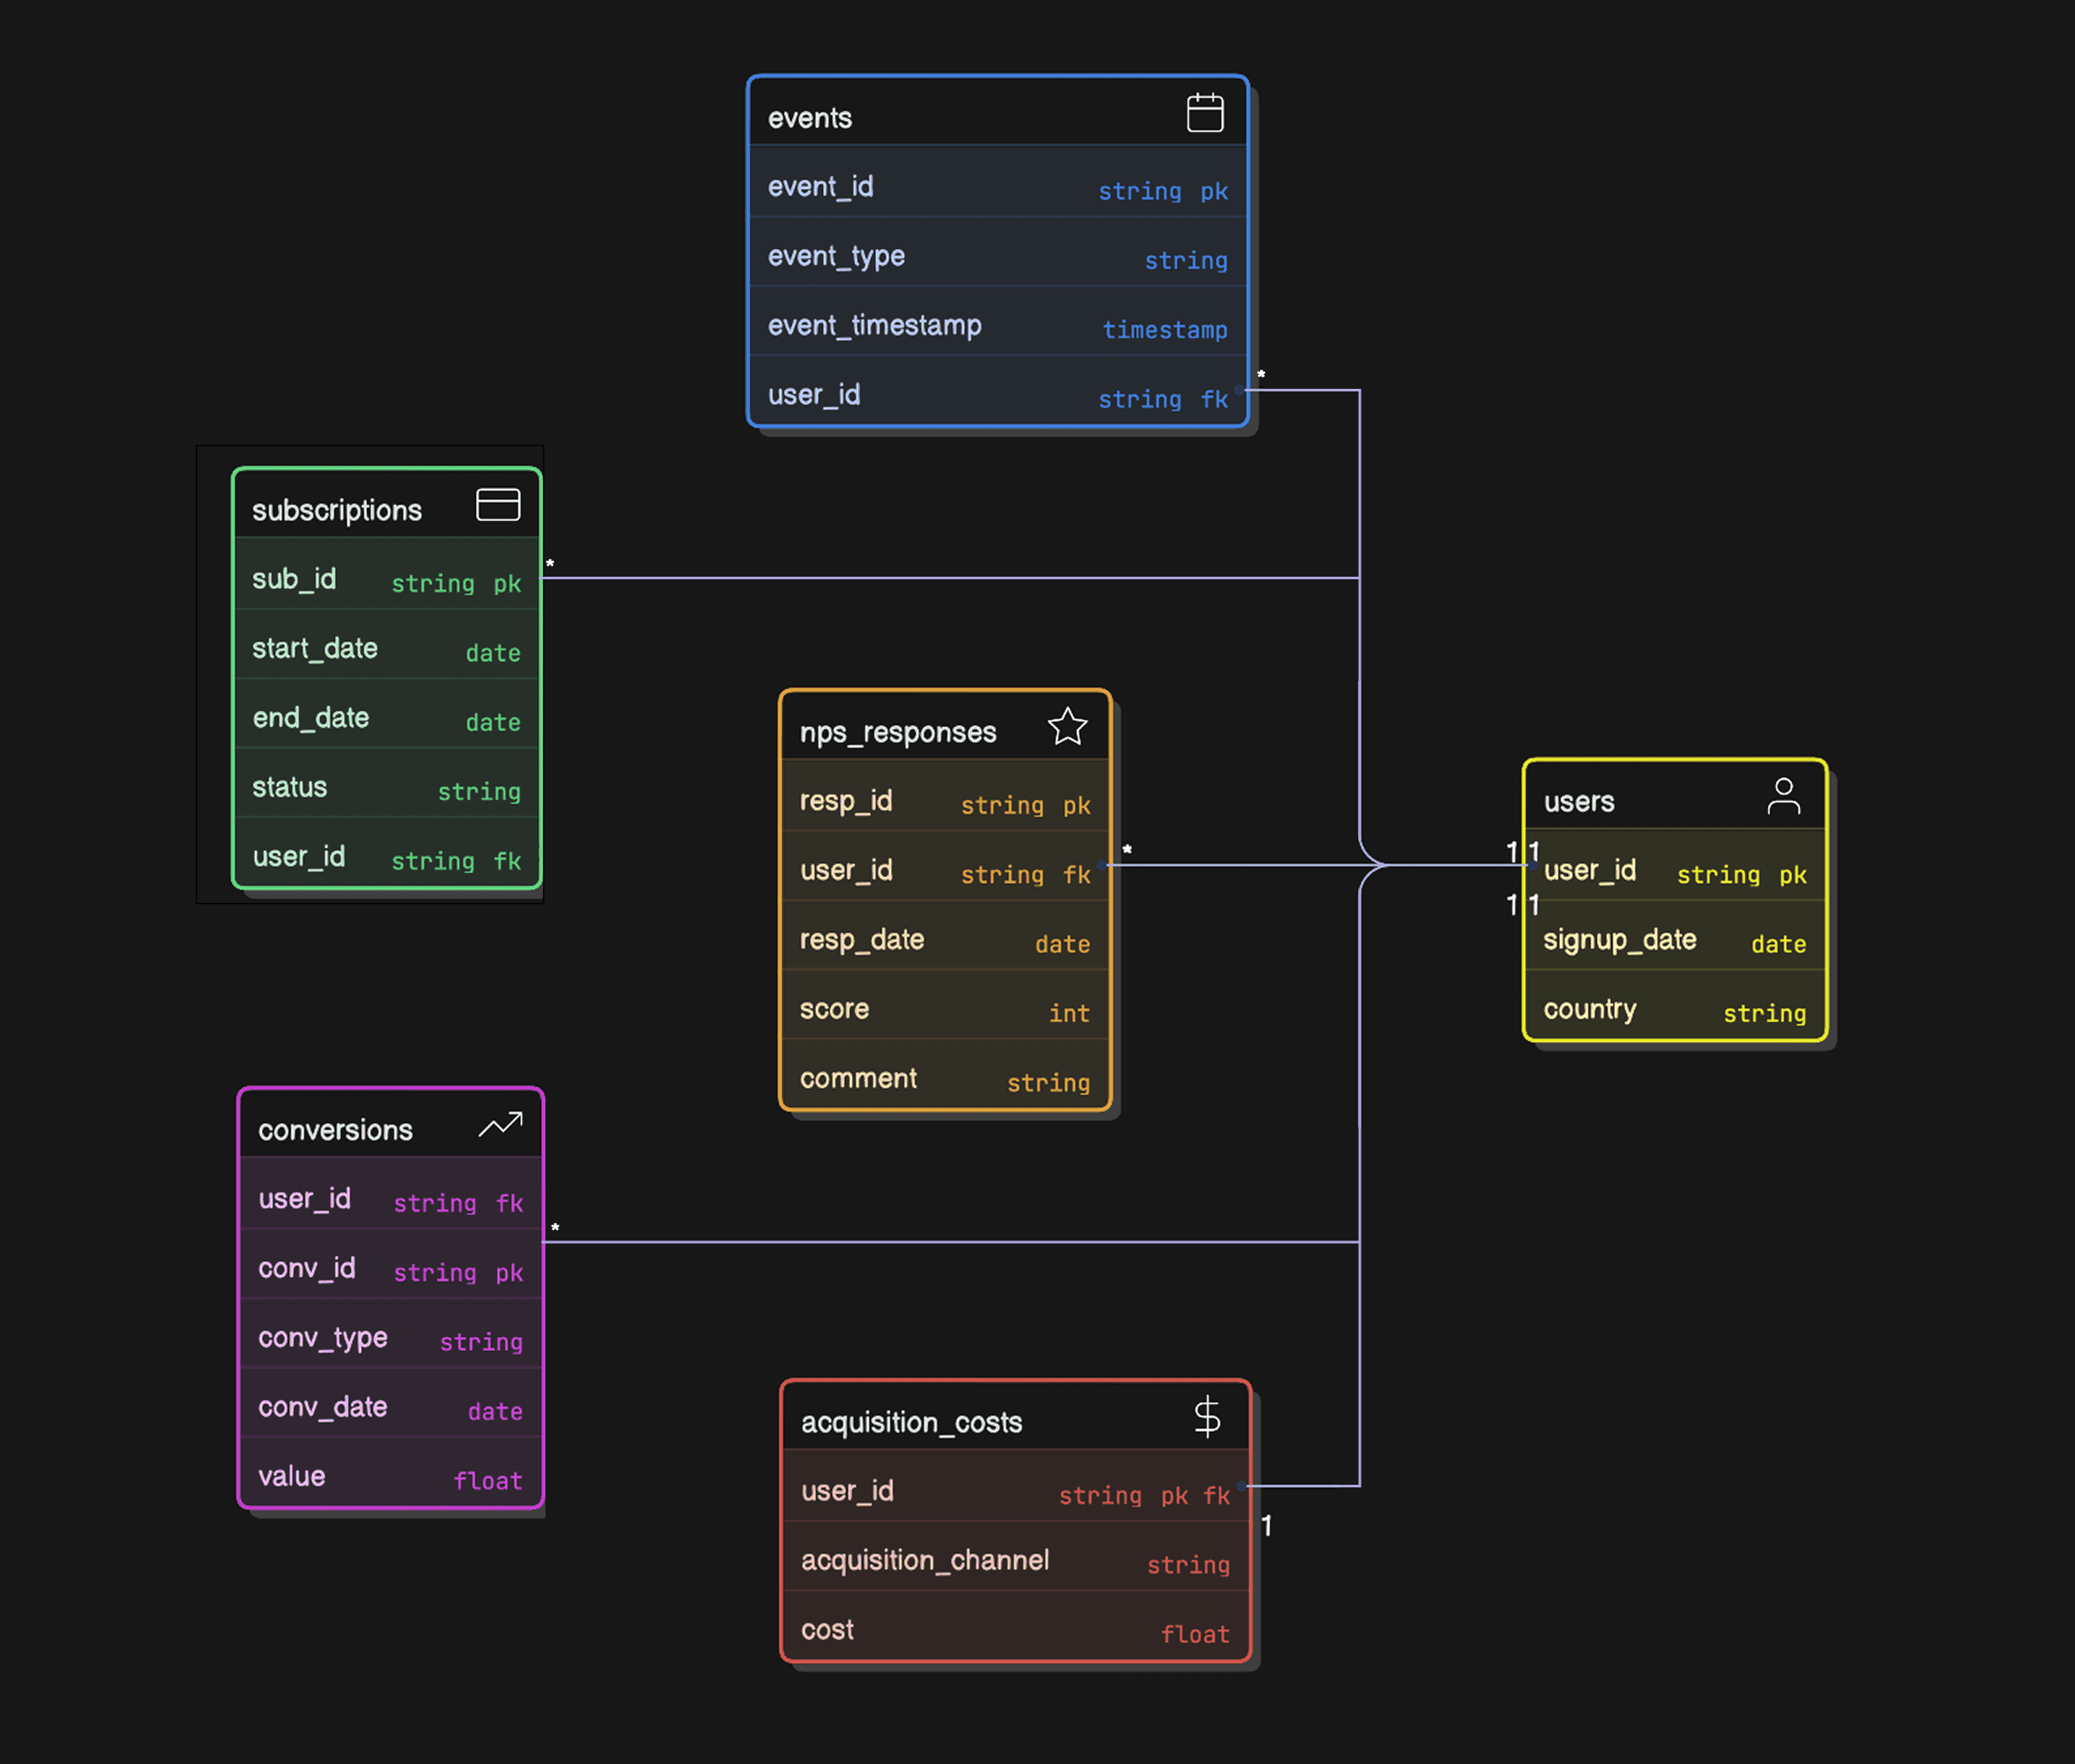
Hypothetical Data Model
To illustrate the SQL queries, we'll assume the following simplified data model, common in product analytics:
Loading the Data
To follow along with the examples in this article, I’ve put together a mock product analytics dataset. It includes everything from users and events to subscriptions, NPS responses, conversions, and acquisition costs. You’ll find everything you need in this GitHub repo.
Let’s get your environment set up:
Copy code
git clone https://github.com/adisomani/duckdb_product_analytics_tutorial.git
cd duckdb_product_analytics_tutorial
duckdb
.read load_data.sql
This script will automatically create all the necessary tables and load the sample data from the mock_data/ folder. Once that’s done, we’re ready to start quacking—I mean, cracking—into some real analytics work with DuckDB. 🦆
Computing Product Analytics Metrics
Now, let's dive into computing the key product analytics metrics using DuckDB SQL.
Monthly Recurring Revenue (MRR) Computation
MRR is a key metric for subscription businesses, representing the predictable revenue generated each month from subscriptions.
SQL Query:
Copy code
SELECT
DATE_TRUNC('month', start_date) AS subscription_month,
SUM(mrr_amount) AS mrr
FROM subscriptions
WHERE end_date IS NULL OR end_date >= DATE_TRUNC('month', start_date + INTERVAL '1 month') -- Consider active subscriptions or those ending after the start of the next month
GROUP BY 1
ORDER BY 1
LIMIT 5;
Explanation:
This query calculates the total MRR for each month. It groups subscriptions by the month their recurring revenue contributes to. We sum the mrr_amount for active subscriptions (end_date IS NULL) or those that ended after the beginning of the following month to capture the revenue for their last full month.
Output:
Copy code
┌────────────────────┬───────────────┐
│ subscription_month │ mrr │
│ date │ decimal(38,3) │
├────────────────────┼───────────────┤
│ 2023-01-01 │ 493.390 │
│ 2023-03-01 │ 133.790 │
│ 2023-04-01 │ 16.840 │
│ 2023-05-01 │ 16.910 │
│ 2023-06-01 │ 489.160 │
└────────────────────┴───────────────┘
User Engagement Computation
Engagement metrics measure how actively users interact with the product.
Daily Active Users (DAU), Weekly Active Users (WAU), Monthly Active Users (MAU)
These metrics count the number of unique users who performed at least one event within a day, week, or month, respectively.
SQL Query:
Copy code
WITH DailyActiveUsers AS (
SELECT
DATE_TRUNC('day', event_time) AS event_day,
COUNT(DISTINCT user_id) AS dau
FROM events
GROUP BY 1
),
WeeklyActiveUsers AS (
SELECT
DATE_TRUNC('week', event_time) AS event_week,
COUNT(DISTINCT user_id) AS wau
FROM events
GROUP BY 1
),
MonthlyActiveUsers AS (
SELECT
DATE_TRUNC('month', event_time) AS event_month,
COUNT(DISTINCT user_id) AS mau
FROM events
GROUP BY 1
)
SELECT
dau.event_day,
dau.dau,
wau.wau,
mau.mau
FROM DailyActiveUsers dau
LEFT JOIN WeeklyActiveUsers wau ON DATE_TRUNC('week', dau.event_day) = wau.event_week
LEFT JOIN MonthlyActiveUsers mau ON DATE_TRUNC('month', dau.event_day) = mau.event_month
ORDER BY 1
LIMIT 5;
Explanation:
We use Common Table Expressions (CTEs) to calculate DAU, WAU, and MAU separately by grouping events by day, week, and month and counting distinct users. We then join these CTEs on their respective truncated dates to present the metrics alongside each other for each day.
Output:
Copy code
┌────────────┬───────┬───────┬───────┐
│ event_day │ dau │ wau │ mau │
│ date │ int64 │ int64 │ int64 │
├────────────┼───────┼───────┼───────┤
│ 2023-01-02 │ 2 │ 10 │ 38 │
│ 2023-01-03 │ 2 │ 10 │ 38 │
│ 2023-01-04 │ 3 │ 10 │ 38 │
│ 2023-01-05 │ 3 │ 10 │ 38 │
│ 2023-01-06 │ 9 │ 10 │ 38 │
└────────────┴───────┴───────┴───────┘
Session Duration Computation
Measures the average length of a user session.
SQL Query:
Copy code
SELECT
AVG(duration_ms) AS average_session_duration_ms
FROM events
WHERE event_name = 'session_end'; -- Assuming a specific event marks the end of a session and duration is recorded
Explanation:
This query calculates the average session duration by averaging the duration_ms from events that signify the end of a session. This assumes your event tracking includes a session end event with a duration. If sessions are defined by periods of inactivity, a more complex query involving window functions might be needed to calculate duration between events within a session.
Output:
Copy code
┌─────────────────────────────┐
│ average_session_duration_ms │
│ double │
├─────────────────────────────┤
│ 911406.7083965256 │
└─────────────────────────────┘
Sessions per User Computation
Measures the average number of sessions initiated by each user over a period.
SQL Query:
Copy code
SELECT
COUNT(DISTINCT session_id) / COUNT(DISTINCT user_id) AS average_sessions_per_user
FROM events
WHERE session_id IS NOT NULL;
Explanation:
This query calculates the ratio of distinct session IDs to distinct user IDs across all events that have a session_id.
Output:
Copy code
┌───────────────────────────┐
│ average_sessions_per_user │
│ double │
├───────────────────────────┤
│ 14.506 │
└───────────────────────────┘
Feature Adoption Computation
Tracks which features are being used and how often.
SQL Query:
Copy code
SELECT
feature_name,
COUNT(DISTINCT user_id) AS distinct_users_using_feature,
COUNT(*) AS total_feature_uses
FROM events
WHERE event_name = 'feature_click' -- Assuming 'feature_click' event indicates feature use
GROUP BY 1
ORDER BY 2 DESC;
Explanation:
This query counts the number of unique users and the total number of events associated with a specific feature interaction (assuming an event_name like 'feature_click').
Output:
Copy code
┌───────────────┬──────────────────────────────┬────────────────────┐
│ feature_name │ distinct_users_using_feature │ total_feature_uses │
│ varchar │ int64 │ int64 │
├───────────────┼──────────────────────────────┼────────────────────┤
│ help_center │ 374 │ 479 │
│ profile │ 373 │ 484 │
│ search │ 369 │ 478 │
│ video_player │ 367 │ 473 │
│ checkout │ 360 │ 459 │
│ notifications │ 354 │ 470 │
│ settings │ 353 │ 443 │
│ messages │ 353 │ 454 │
│ homepage │ 352 │ 435 │
│ feed │ 338 │ 439 │
├───────────────┴──────────────────────────────┴────────────────────┤
│ 10 rows 3 columns │
└───────────────────────────────────────────────────────────────────┘
User Retention Computation
Measures the percentage of users who continue using the product over time. Calculating retention cohorts is a common approach.
SQL Query (Example for Monthly Cohorts):
Copy code
WITH SignupCohorts AS (
SELECT
user_id,
DATE_TRUNC('month', signup_time) AS signup_month
FROM users
),
MonthlyActivity AS (
SELECT
user_id,
DATE_TRUNC('month', event_time) AS activity_month
FROM events
GROUP BY 1, 2 -- Ensure unique user-month combinations
)
SELECT
sc.signup_month,
DATE_TRUNC('month', ma.activity_month) AS retained_month,
COUNT(DISTINCT sc.user_id) AS retained_users,
-- Calculate total users in the cohort for percentage (requires joining with cohort size)
(COUNT(DISTINCT sc.user_id) * 100.0) / FIRST_VALUE(COUNT(DISTINCT sc.user_id)) OVER (PARTITION BY sc.signup_month ORDER BY retained_month) AS retention_percentage
FROM SignupCohorts sc
JOIN MonthlyActivity ma ON sc.user_id = ma.user_id AND ma.activity_month >= sc.signup_month
GROUP BY 1, 2
ORDER BY 1, 2
LIMIT 5;
Explanation:
This query identifies user signup cohorts by month. It then joins this with monthly activity data to determine in which subsequent months users from each cohort were still active. Window functions are used to calculate the total number of users in the original cohort to compute the retention percentage for each subsequent month.
Output (Simplified):
Copy code
┌──────────────┬────────────────┬────────────────┬──────────────────────┐
│ signup_month │ retained_month │ retained_users │ retention_percentage │
│ date │ date │ int64 │ double │
├──────────────┼────────────────┼────────────────┼──────────────────────┤
│ 2023-01-01 │ 2023-01-01 │ 38 │ 100.0 │
│ 2023-01-01 │ 2023-02-01 │ 38 │ 100.0 │
│ 2023-01-01 │ 2023-03-01 │ 38 │ 100.0 │
│ 2023-01-01 │ 2023-04-01 │ 37 │ 97.36842105263158 │
│ 2023-01-01 │ 2023-06-01 │ 13 │ 34.21052631578947 │
└──────────────┴────────────────┴────────────────┴──────────────────────┘
Churn Rate Computation
The opposite of retention, measuring the percentage of users lost over a period.
User Churn Rate (Example for Monthly Churn):
Churn rate can be calculated as (Number of Churned Users / Number of Users at the Start of the Period) * 100.
SQL Query:
Copy code
WITH MonthlyActiveUsers AS (
SELECT
user_id,
DATE_TRUNC('month', event_time) AS activity_month
FROM events
GROUP BY 1, 2
),
UserActivityMonths AS (
SELECT DISTINCT
user_id,
activity_month
FROM MonthlyActiveUsers
),
LaggedActivity AS (
SELECT
user_id,
activity_month,
LAG(activity_month, 1, NULL) OVER (PARTITION BY user_id ORDER BY activity_month) AS previous_activity_month,
LEAD(activity_month, 1, NULL) OVER (PARTITION BY user_id ORDER BY activity_month) AS next_activity_month
FROM UserActivityMonths
)
SELECT
activity_month AS churn_month,
COUNT(DISTINCT user_id) AS total_users_start_of_month,
COUNT(DISTINCT CASE WHEN next_activity_month IS NULL AND activity_month < DATE_TRUNC('month', CURRENT_DATE) THEN user_id END) AS churned_users,
(COUNT(DISTINCT CASE WHEN next_activity_month IS NULL AND activity_month < DATE_TRUNC('month', CURRENT_DATE) THEN user_id END) * 100.0) / COUNT(DISTINCT user_id) AS user_churn_rate
FROM LaggedActivity
WHERE previous_activity_month IS NOT NULL -- Exclude users who were not active in the previous month (new users)
GROUP BY 1
ORDER BY 1
LIMIT 5;
Explanation:
This query identifies months where a user was active (UserActivityMonths). It then uses window functions (LAG and LEAD) to look at the previous and next months of activity for each user. Users are considered churned in a given month if they were active in that month but not in the following month (and the current month is not the latest data point). We then calculate the churn rate based on the number of users active at the start of the month.
Output (Simplified):
Copy code
┌─────────────┬────────────────────────────┬───────────────┬────────────────────┐
│ churn_month │ total_users_start_of_month │ churned_users │ user_churn_rate │
│ date │ int64 │ int64 │ double │
├─────────────┼────────────────────────────┼───────────────┼────────────────────┤
│ 2023-02-01 │ 38 │ 0 │ 0.0 │
│ 2023-03-01 │ 70 │ 1 │ 1.4285714285714286 │
│ 2023-04-01 │ 102 │ 23 │ 22.54901960784314 │
│ 2023-05-01 │ 91 │ 18 │ 19.78021978021978 │
│ 2023-06-01 │ 113 │ 11 │ 9.734513274336283 │
└─────────────┴────────────────────────────┴───────────────┴────────────────────┘
MRR Churn:
Measures the revenue lost from churned customers.
SQL Query:
Copy code
WITH MonthlySubscriptions AS (
SELECT
user_id,
DATE_TRUNC('month', start_date) AS subscription_month,
mrr_amount
FROM subscriptions
WHERE end_date IS NULL OR end_date >= DATE_TRUNC('month', start_date)
),
ChurnedUsers AS (
-- This part requires identifying churned users similar to the User Churn query,
-- but focusing on subscription status changes rather than activity.
-- A simplified approach is shown here, assuming churn is marked in the subscriptions table.
SELECT DISTINCT
user_id
FROM subscriptions
WHERE DATE_TRUNC('month', end_date) = DATE_TRUNC('month', CURRENT_DATE - INTERVAL '1 month') -- Example: users whose subscription ended last month
),
MRRLostFromChurn AS (
SELECT
ms.subscription_month,
SUM(ms.mrr_amount) AS mrr_lost
FROM MonthlySubscriptions ms
JOIN ChurnedUsers cu ON ms.user_id = cu.user_id
WHERE ms.subscription_month <= DATE_TRUNC('month', CURRENT_DATE - INTERVAL '1 month') -- Consider MRR from before churn
GROUP BY 1
)
SELECT
mrr.subscription_month,
mrr.mrr AS total_mrr_start_of_month,
mlfc.mrr_lost AS mrr_churn,
(mlfc.mrr_lost * 100.0) / mrr.mrr AS mrr_churn_rate
FROM (
SELECT
DATE_TRUNC('month', start_date) AS subscription_month,
SUM(mrr_amount) AS mrr
FROM subscriptions
WHERE end_date IS NULL OR end_date >= DATE_TRUNC('month', start_date)
GROUP BY 1
) mrr
JOIN MRRLostFromChurn mlfc ON mrr.subscription_month = mlfc.subscription_month
ORDER BY 1
LIMIT 5;
Explanation:
This query calculates MRR churn by identifying users who churned (based on the end_date in the subscriptions table) and summing their MRR from a previous period. A more robust calculation would involve tracking month-over-month changes in MRR per user.
Output (Simplified):
Copy code
┌────────────────────┬──────────────────────────┬───────────────┬────────────────────┐
│ subscription_month │ total_mrr_start_of_month │ mrr_churn │ mrr_churn_rate │
│ date │ decimal(38,3) │ decimal(38,3) │ double │
├────────────────────┼──────────────────────────┼───────────────┼────────────────────┤
│ 2023-06-01 │ 489.160 │ 0.000 │ 0.0 │
│ 2024-03-01 │ 1076.380 │ 120.060 │ 11.154053401215183 │
│ 2024-04-01 │ 372.350 │ 18.250 │ 4.901302537934739 │
│ 2024-05-01 │ 773.290 │ 62.820 │ 8.123731071137607 │
│ 2024-06-01 │ 821.250 │ 0.000 │ 0.0 │
└────────────────────┴──────────────────────────┴───────────────┴────────────────────┘
Customer Lifetime Value (CLTV or LTV) Computation
Estimates the total revenue a customer will generate. A simple method involves averaging historical revenue per user.
SQL Query (Historical LTV):
Copy code
WITH UserTotalRevenue AS (
SELECT
user_id,
SUM(mrr_amount * (JULIAN(end_date) - JULIAN(start_date)) / 30.0) AS total_revenue -- Simplified for demonstration, assumes average month length
FROM subscriptions
WHERE end_date IS NOT NULL -- Consider only completed subscriptions for historical LTV
GROUP BY 1
)
SELECT
AVG(total_revenue) AS average_historical_ltv
FROM UserTotalRevenue;
Explanation:
This query calculates the total revenue generated by each user from completed subscriptions and then averages this across all users with completed subscriptions to get a historical LTV. Predictive LTV models are more complex and often involve statistical methods beyond basic SQL.
Output:
Copy code
┌────────────────────────┐
│ average_historical_ltv │
│ double │
├────────────────────────┤
│ 238.48609121061358 │
└────────────────────────┘
Net Promoter Score (NPS) Computation
Measures customer loyalty and satisfaction based on a single question. NPS is calculated as (% Promoters - % Detractors) * 100.
SQL Query:
Copy code
WITH NPSCategories AS (
SELECT
score,
CASE
WHEN score >= 9 THEN 'Promoter'
WHEN score BETWEEN 7 AND 8 THEN 'Passive'
WHEN score BETWEEN 0 AND 6 THEN 'Detractor'
ELSE 'Unknown'
END AS nps_category
FROM nps_responses
),
NPSCounts AS (
SELECT
nps_category,
COUNT() AS count
FROM NPSCategories
GROUP BY nps_category
),
TotalResponses AS (
SELECT COUNT() AS total_count FROM nps_responses
)
SELECT
(SELECT count FROM NPSCounts WHERE nps_category = 'Promoter') * 100.0 / tr.total_count
-
(SELECT count FROM NPSCounts WHERE nps_category = 'Detractor') * 100.0 / tr.total_count AS nps
FROM TotalResponses tr;
Explanation:
This query categorizes NPS responses into Promoters, Passives, and Detractors based on the score. It then counts the number of responses in each category and calculates the NPS using the formula: (Promoters - Detractors) / Total Responses * 100.
Output:
Copy code
┌───────────────────┐
│ nps │
│ double │
├───────────────────┤
│ 11.41439205955335 │
└───────────────────┘
Conversion Rate Computation
The percentage of users who complete a desired action.
SQL Query (Example: Trial Signup Conversion Rate from Website Visit):
Copy code
WITH WebsiteVisits AS (
SELECT DISTINCT user_id
FROM events
WHERE event_name = 'website_visit'
),
TrialSignups AS (
SELECT DISTINCT user_id
FROM conversions
WHERE conversion_type = 'trial_signup'
)
SELECT
COUNT(DISTINCT ts.user_id) * 100 / COUNT(DISTINCT wv.user_id) AS trial_signup_conversion_rate
FROM WebsiteVisits wv
LEFT JOIN TrialSignups ts ON wv.user_id = ts.user_id;
Explanation:
This query identifies users who visited the website and users who signed up for a trial. It then calculates the conversion rate by dividing the number of users who signed up for a trial by the number of users who visited the website and multiplying by 100. The LEFT JOIN ensures that even if no users converted, we still get a result (a conversion rate of 0).
Output:
Copy code
┌──────────────────────────────┐
│ trial_signup_conversion_rate │
│ double │
├──────────────────────────────┤
│ 58.72855701311806 │
└──────────────────────────────┘
Time to Value (TTV) Computation
Measures the time it takes for a new user to experience the core value of the product. This is highly dependent on the specific product and what constitutes "core value". It might involve the time between signup and completing a key action.
SQL Query (Example: Time from Signup to First Feature Use):
Copy code
WITH FirstFeatureUse AS (
SELECT
user_id,
MIN(event_time) AS first_feature_event_time
FROM events
WHERE event_name = 'feature_click' -- Assuming 'feature_click' is the first value-giving event
GROUP BY 1
)
SELECT
AVG(JULIAN(ffu.first_feature_event_time) - JULIAN(u.signup_time)) AS average_ttv_days
FROM users u
JOIN FirstFeatureUse ffu ON u.user_id = ffu.user_id;
Explanation:
This query finds the timestamp of the first 'feature_click' event for each user after their signup. It then calculates the difference in days between the signup time and the first feature use time for each user and computes the average.
Output:
Copy code
┌────────────────────┐
│ average_ttv_days │
│ double │
├────────────────────┤
│ 20.109737758908203 │
└────────────────────┘
User Funnel Analysis Computation
Analyzing the steps users take to complete a goal and identifying drop-off points. SQL can be used to track users through a predefined sequence of events.
SQL Query (Example: Signup to First Purchase Funnel):
Copy code
WITH Step1 AS (
SELECT user_id, signup_time AS step_time
FROM users
),
Step2 AS (
SELECT user_id, MIN(event_time) AS step_time
FROM events
WHERE event_name = 'view_product_page' -- Assuming this is the next step
GROUP BY 1
),
Step3 AS (
SELECT user_id, MIN(event_time) AS step_time
FROM events
WHERE event_name = 'add_to_cart' -- Assuming this is the next step
GROUP BY 1
),
Step4 AS (
SELECT user_id, MIN(conversion_time) AS step_time
FROM conversions
WHERE conversion_type = 'paid_plan_purchase' -- Assuming this is the final step
GROUP BY 1
)
SELECT
'Signed Up' AS step,
COUNT(DISTINCT s1.user_id) AS users
FROM Step1 s1
UNION ALL
SELECT
'Viewed Product Page' AS step,
COUNT(DISTINCT s2.user_id) AS users
FROM Step1 s1
JOIN Step2 s2 ON s1.user_id = s2.user_id AND s2.step_time > s1.step_time
UNION ALL
SELECT
'Added to Cart' AS step,
COUNT(DISTINCT s3.user_id) AS users
FROM Step2 s2
JOIN Step3 s3 ON s2.user_id = s3.user_id AND s3.step_time > s2.step_time
UNION ALL
SELECT
'Made Purchase' AS step,
COUNT(DISTINCT s4.user_id) AS users
FROM Step3 s3
JOIN Step4 s4 ON s3.user_id = s4.user_id AND s4.step_time > s3.step_time;
Explanation:
This query defines each step of the funnel as a CTE, identifying the first occurrence of the relevant event or conversion for each user. It then uses JOIN operations to count the number of users who successfully completed each step in the correct order, based on the timestamps.
Output:
Copy code
┌─────────────────────┬───────┐
│ step │ users │
│ varchar │ int64 │
├─────────────────────┼───────┤
│ Signed Up │ 1000 │
│ Viewed Product Page │ 493 │
│ Added to Cart │ 737 │
│ Made Purchase │ 382 │
└─────────────────────┴───────┘
Customer Acquisition Cost (CAC) Computation
The cost of acquiring a new customer.
SQL Query:
Copy code
SELECT
SUM(cost) / COUNT(DISTINCT user_id) AS average_cac
FROM acquisition_costs;
Explanation:
This query calculates the average CAC by summing the costs in the acquisition_costs table and dividing by the number of distinct users acquired. In a real-world scenario, acquisition_costs would likely be more detailed, potentially involving marketing campaign spend and attributing costs to specific acquired users or cohorts.
Output:
Copy code
┌────────────────────┐
│ average_cac │
│ double │
├────────────────────┤
│ 33.214349999999996 │
└────────────────────┘
Advantages of Using MotherDuck and DuckDB for Product Analytics
Using MotherDuck and DuckDB for product analytics offers several key benefits:
- Performance: DuckDB's columnar-vectorized query engine is optimized for analytical workloads, providing fast query execution even on large datasets. MotherDuck's hybrid execution can leverage local compute for even faster analysis.
- Ease of Use: DuckDB is simple to install and use, with no external dependencies or server to manage. It supports standard SQL, making it accessible to anyone familiar with the language. MotherDuck adds a user-friendly UI and simplifies data loading and sharing.
- Flexibility: DuckDB can read data directly from various formats like CSV and Parquet, and integrates well with tools like Python (Pandas, Polars). MotherDuck extends this with managed storage and hybrid query execution.
- Cost-Effective: DuckDB is open-source and free. MotherDuck offers a serverless model, potentially reducing infrastructure costs compared to traditional data warehouses.
- Local Development and Cloud Scale: The combination allows for rapid local development and testing with DuckDB, seamlessly scaling to the cloud with MotherDuck when needed for larger datasets or collaboration.
Conclusion
MotherDuck and DuckDB provide a compelling solution for product analytics. Their combined strengths in performance, ease of use, and flexibility, coupled with the power of SQL, enable data professionals to efficiently compute crucial product metrics like MRR, user engagement, retention, churn, LTV, NPS, conversion rate, TTV, and funnel analysis. By adopting this stack, product teams can gain deeper insights into user behavior and drive data-informed decisions to build better products and foster growth.
Start using MotherDuck now!
FAQS
What are MotherDuck and DuckDB, and how do they work as a data warehouse for product analytics?
DuckDB is a powerful, high-speed analytical database engine. MotherDuck extends it into a serverless data warehouse, providing centralized cloud storage, easy data sharing, and a unique hybrid execution model. This is ideal for product analytics because it combines the power and scale of a cloud data warehouse with the speed and convenience of running queries locally on your laptop.
What key product metrics can I calculate with MotherDuck?
By querying your data in your MotherDuck warehouse with DuckDB's SQL engine, you can calculate a wide range of product metrics. This includes financial metrics like Monthly Recurring Revenue (MRR) and Customer Lifetime Value (LTV), user engagement (DAU/MAU), retention cohorts, churn rates, and behavioral analyses like feature adoption and conversion funnels.
How does using MotherDuck as a data warehouse compare to a dedicated product analytics tool?
Dedicated tools offer pre-built dashboards but can be rigid and create data silos. By using MotherDuck as your data warehouse, you build a flexible and scalable single source of truth for your product data. This gives you complete ownership over your metrics, allows for more complex and custom analyses, and integrates seamlessly with the rest of your data stack (like BI tools and Python notebooks), avoiding vendor lock-in.
