2023/07/06 - Tino Tereshko, Nouras Haddad
Birds of a Feather MotherDuck Together
Building the MotherDuck Ecosystem
- 8 min read
BY- 8 min read
BYI was always fascinated by the StackOverflow dataset. We all spend a lot of our time searching, reading and writing StackOverflow questions and answers, but rarely think about the system and data behind it. Let’s change that by analyzing the dataset with DuckDB.
The data has only 65,000 tags and 20 million users (600MB compressed CSV), but 58 million posts (3GB), so it’s worth seeing how DuckDB holds up at this size - which is not "Big Data". Spoiler: Really well, which is not surprising if you read Jordan’s blog post "Big Data is Dead".
In this article series we explore the StackOverflow dataset using DuckDB both locally and on MotherDuck. First we download and transform the raw data, then we load it into DuckDB and inspect it with some EDA queries before exporting it to Parquet.
Then we can use these Parquet files to create the database on MotherDuck and explore it with the new natural language search (AI prompt) features launched last month. To allow you to avoid all the tedious data ingestion work, we use MotherDuck's database sharing feature to share the database with you.
Finally, for some more interesting queries, we access the DuckDB database on MotherDuck from a Python notebook and visualize the results. We also try out the distributed querying capabilities of MotherDuck from our local machine.
If you just want to explore and query the data, you can use the stack exchange data explorer, but for real analysis you want to get access to all the data. Thankfully StackOverflow publishes all their data publicly on the internet archive stack exchange dump every moth, we are looking at the (largest) set of files of the StackOverflow site itself.
It takes a long time (for me two days in total) to download, especially the posts file, as the internet archive bandwidth is limited and aborts in between. We end up with 7 files with a total size of 27 GB.
StackOverflow Dump files
Copy code
19G stackoverflow.com-Posts.7z 5.2G stackoverflow.com-Comments.7z 1.3G stackoverflow.com-Votes.7z 684M stackoverflow.com-Users.7z 343M stackoverflow.com-Badges.7z 117M stackoverflow.com-PostLinks.7z 903K stackoverflow.com-Tags.7z
To convert the SQL-Server Dump XML files to CSV I used a tool I wrote a few years ago, which you can find on GitHub.
It outputs the files as gzipped CSV, which are much smaller now.
Copy code
5.0G Comments.csv.gz 3.1G Posts.csv.gz 1.6G Votes.csv.gz 613M Users.csv.gz 452M Badges.csv.gz 137M PostLinks.csv.gz 1.1M Tags.csv.gz
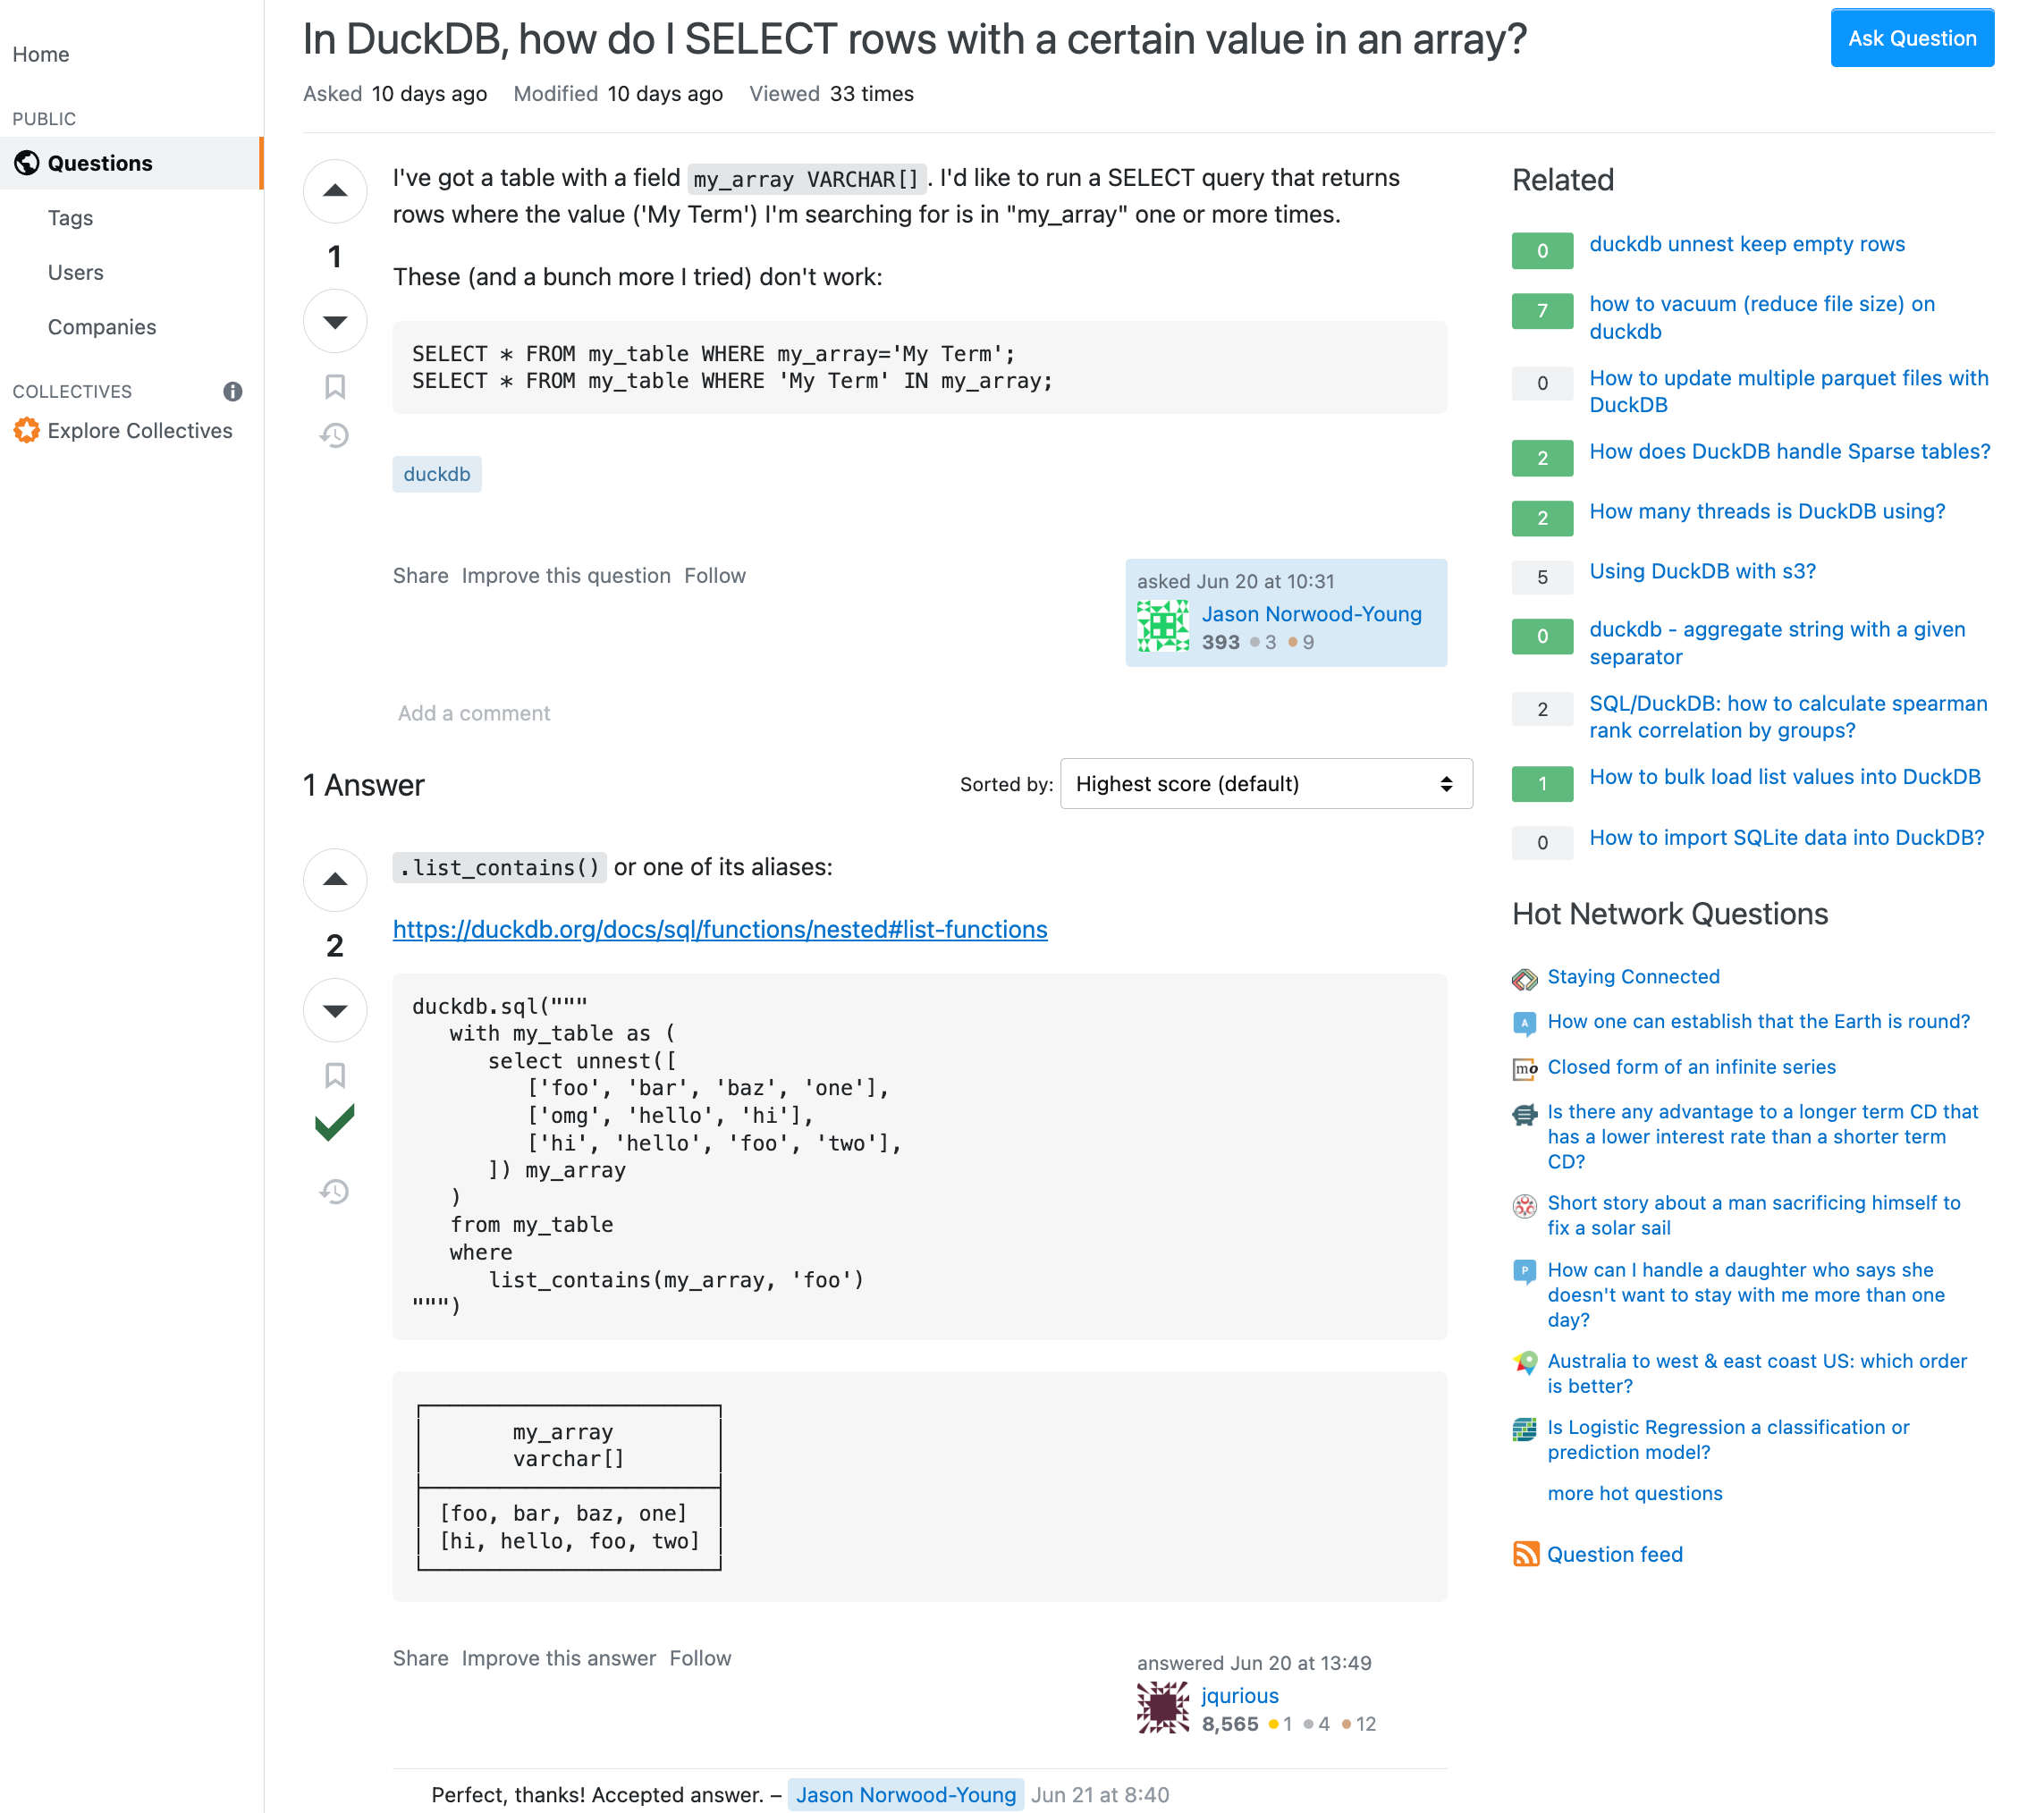
Let’s look at the data model of the StackOverflow dataset. To remind ourselves of the UI, here is a screenshot with most information visible.
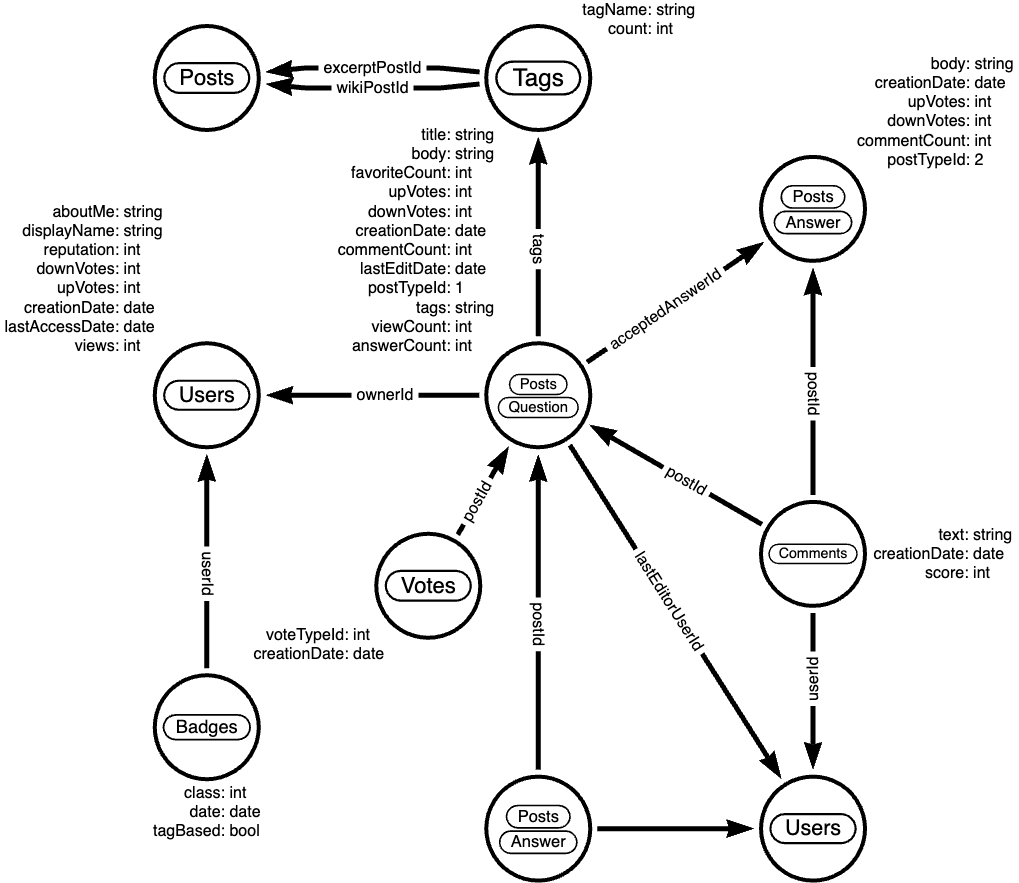
We have the Questions (Post with postTypeId=1) with a title, body, creationDate, ownerUserId, acceptedAnswerId, answerCount, tags, upvotes, downvotes, views, comments. The up to 6 Tags define the topics of the question. The User with displayName, aboutMe, reputation, last login date, etc. The Answers (Post with postTypeId=2) with their own ownerUserId, upvotes, downvotes, comments. One of the answers can be accepted as the correct answer. Both Questions and Answers can have comments with their own text, ownerUserId, score. There are also Badges with class columns that users can earn for their contributions. Posts can be linked to other posts, e.g. duplicates or related questions as PostLinks.
The dump doesn’t have any information of indexes or foreign keys so, we need to discover them as we go.
Now we’re ready to import the files into DuckDB, which is so much easier than our previous steps.
With the read_csv function, we can read the CSV files directly from the compressed gzipped files. As we have header-less files, we need to provide the column names as a list. The auto_detect option will try to guess the column types, which works well for the StackOverflow data.
Let’s look at the Tags file first and query it for structure and content.
Copy code
$ duckdb stackoverflow.db
SELECT count(*)
FROM read_csv_auto('Tags.csv.gz');
┌──────────────┐
│ count_star() │
│ int64 │
├──────────────┤
│ 64465 │
└──────────────┘
DESCRIBE(SELECT * from read_csv_auto('Tags.csv.gz') LIMIT 1);
┌───────────────┬─────────────┐
│ column_name │ column_type │
│ varchar │ varchar │
├───────────────┼─────────────┤
│ Id │ BIGINT │
│ TagName │ VARCHAR │
│ Count │ BIGINT │
│ ExcerptPostId │ BIGINT │
│ WikiPostId │ BIGINT │
└───────────────┴─────────────┘
SELECT TagName, Count
FROM read_csv('Tags.csv.gz',column_names=['Id','TagName','Count'],auto_detect=true)
ORDER BY Count DESC LIMIT 5;
┌────────────┬─────────┐
│ TagName │ Count │
│ varchar │ int64 │
├────────────┼─────────┤
│ javascript │ 2479947 │
│ python │ 2113196 │
│ java │ 1889767 │
│ c# │ 1583879 │
│ php │ 1456271 │
└────────────┴─────────┘
We could either create the tables first and read the data into them or we can create the tables on the fly as we read the data. I won’t show all of the import statements, only Users and Posts, but you can imagine what it will look like.
Copy code
CREATE TABLE users AS
SELECT * from read_csv('Users.csv.gz',auto_detect=true,
column_names=['Id','Reputation','CreationDate','DisplayName',
'LastAccessDate','AboutMe','Views','UpVotes','DownVotes']);
-- 19942787 rows
-- we can leave off the select *
CREATE TABLE posts AS
FROM read_csv('Posts.csv.gz',auto_detect=true,
column_names=['Id','PostTypeId','AcceptedAnswerId','CreationDate',
'Score','ViewCount','Body','OwnerUserId','LastEditorUserId',
'LastEditorDisplayName','LastEditDate','LastActivityDate','Title',
'Tags','AnswerCount','CommentCount','FavoriteCount',
'CommunityOwnedDate','ContentLicense']);
-- 58329356 rows
Now that we have our tables loaded, we can run a a few queries to see what we have.
First we check who our top users are and when did they last login (from this dump), this computes on my machine in 0.126 seconds for 20 million users.
Copy code
.timer on
SELECT DisplayName, Reputation, LastAccessDate
FROM users ORDER BY Reputation DESC LIMIT 5;
┌─────────────────┬────────────┬─────────────────────────┐
│ DisplayName │ Reputation │ LastAccessDate │
│ varchar │ int64 │ timestamp │
├─────────────────┼────────────┼─────────────────────────┤
│ Jon Skeet │ 1389256 │ 2023-03-04 19:54:19.74 │
│ Gordon Linoff │ 1228338 │ 2023-03-04 15:16:02.617 │
│ VonC │ 1194435 │ 2023-03-05 01:48:58.937 │
│ BalusC │ 1069162 │ 2023-03-04 12:49:24.637 │
│ Martijn Pieters │ 1016741 │ 2023-03-03 19:35:13.76 │
└─────────────────┴────────────┴─────────────────────────┘
Run Time (s): real 0.126 user 2.969485 sys 1.696962
Now let’s look at the bigger posts table and see some yearly statistics.
Copy code
SELECT year(CreationDate) as year, count(*),
round(avg(ViewCount)), max(AnswerCount)
FROM posts
GROUP BY year ORDER BY year DESC LIMIT 10;
┌───────┬──────────────┬───────────────────────┬──────────────────┐
│ year │ count_star() │ round(avg(ViewCount)) │ max(AnswerCount) │
│ int64 │ int64 │ double │ int64 │
├───────┼──────────────┼───────────────────────┼──────────────────┤
│ 2023 │ 528575 │ 44.0 │ 15 │
│ 2022 │ 3353468 │ 265.0 │ 44 │
│ 2021 │ 3553972 │ 580.0 │ 65 │
│ 2020 │ 4313416 │ 847.0 │ 59 │
│ 2019 │ 4164538 │ 1190.0 │ 60 │
│ 2018 │ 4444220 │ 1648.0 │ 121 │
│ 2017 │ 5022978 │ 1994.0 │ 65 │
│ 2016 │ 5277269 │ 2202.0 │ 74 │
│ 2015 │ 5347794 │ 2349.0 │ 82 │
│ 2014 │ 5342607 │ 2841.0 │ 92 │
├───────┴──────────────┴───────────────────────┴──────────────────┤
│ 10 rows 4 columns │
└─────────────────────────────────────────────────────────────────┘
Run Time (s): real 5.977 user 7.498157 sys 5.480121 (1st run)
Run Time (s): real 0.039 user 4.609049 sys 0.078694
The first time it takes about 6 seconds, and subsequent runs are much faster after the data has been loaded.
Nice, seems to have worked well.
Our DuckDB database file is 18GB, which is a two times as big as the ultra-compressed 8.7GB of the CSV files.
We could continue to use our local database file, but we wanted to explore MotherDuck, so let’s upload the data to the cloud.
We can export our tables to Parquet files for safekeeping and easier storage and processing in other ways. Parquet as a columnar format compresses better, includes the schema and supports optimized reading with column selection and predicate pushdown.
Copy code
COPY (FROM users) TO 'users.parquet'
(FORMAT PARQUET, CODEC 'SNAPPY', ROW_GROUP_SIZE 100000);
-- Run Time (s): real 10.582 user 62.737265 sys 65.422181
COPY (FROM posts) TO 'posts.parquet'
(FORMAT PARQUET, CODEC 'SNAPPY', ROW_GROUP_SIZE 100000);
-- Run Time (s): real 57.314 user 409.517658 sys 334.606894
You can also export your whole database as Parquet files EXPORT DATABASE 'target_directory' (FORMAT PARQUET);
Copy code
6.9G comments.parquet 4.0G posts.parquet 2.2G votes.parquet 734M users.parquet 518M badges.parquet 164M post_links.parquet 1.6M tags.parquet
I uploaded them to S3 you can find them here: s3://us-prd-motherduck-open-datasets/stackoverflow/parquet/2023-05
So if you don’t want to wait for the second part in the series, where we load the data into MotherDuck and query it with AI prompts, you can use this share:
Copy code
ATTACH 'md:_share/stackoverflow/6c318917-6888-425a-bea1-5860c29947e5'
Take a look at the StackOverflow Example in the docs for a description of the schema and example queries. If you don't already have an invite for MotherDuck, you can request one using the form on their homepage.
Please share any interesting queries or issues on the MotherDuck Slack channel.
Editor's note: Exploring StackOverflow with DuckDB on MotherDuck Part 2 has now been published.
2023/07/06 - Tino Tereshko, Nouras Haddad
Building the MotherDuck Ecosystem

2023/07/17 - Marcos Ortiz
DuckDB news: MotherDuck launches managed cloud service with hybrid execution. Apache Iceberg extension arrives. Vectorized Python UDFs added. DuckCon SF talks published.