
For a startup, speed is survival. The ability to make smart, data-driven decisions faster than the competition isn't just an advantage. It's a necessity. Yet, many growing companies find themselves trapped by traditional data analytics, where every business question becomes a ticket in a long queue for a small, overwhelmed data team. This bottleneck doesn't just delay answers, it stifles curiosity and prevents the growth of a truly data-driven culture.
The solution is a fundamental shift in both mindset and technology, moving away from gatekept data and towards self-service analytics. This modern approach empowers every team member, from marketing and product to sales and operations, to explore data, find their own answers, and collaborate on insights without needing to be a SQL expert.
By pairing a lean, serverless data warehouse like MotherDuck with the right collaborative tools and governance, startups can build an analytics stack that is fast, affordable, and accessible to everyone. This guide is your playbook for making that transition, turning your data from a bottleneck into a competitive advantage.
What You'll Learn in This Guide
- Why traditional BI tools fail startups and how a modern approach saves critical time and money.
- How to empower non-technical users to perform their own ad-hoc queries and analyses.
- Strategies for effective team collaboration on shared data without creating chaos or duplicating work.
- How to integrate real-time analytics dashboards directly into your SaaS product to drive customer value.
- A practical 30-60-90 day roadmap to implement a successful self-service analytics culture.
Why Do Traditional Business Intelligence Tools Fail Startups?
Traditional cloud data warehouses were designed for extremely large distributed batch ETL and equally large data teams. For a startup, this model is often a poor fit, creating significant friction, complexity, and cost. They impose high administrative overhead, requiring specialized expertise to manage clusters, roles, and performance tuning, diverting valuable engineering time away from your core product.
Worse, their pricing models, often based on consumption credits with minimum runtimes of 60 seconds or more, create an "idle compute tax", often referred to as the "Big Data Tax". This means you pay for resources even when they aren't being actively used, a costly problem for startups with intermittent or unpredictable analytical workloads. This rigid billing structure is also a primary reason why traditional platforms fail as an analytics database for AI agents, where spiky, short-burst queries quickly multiply costs.
A new breed of lean, serverless warehouse has emerged to solve these problems. Platforms like MotherDuck, built on the powerful DuckDB in-process OLAP engine, offer a hybrid architecture that combines local-first development with serverless cloud execution. This approach provides true usage-based, per-second billing that eliminates surprise costs and aligns perfectly with a startup's need for agility and affordability.
The difference between these two approaches is not subtle. It's a fundamental shift in how analytics is delivered.
How Do Modern and Traditional Analytics Platforms Compare?
| Feature | Traditional Cloud Warehouse (e.g., Snowflake, BigQuery) | Modern Self-Service Platform (e.g., MotherDuck) |
|---|---|---|
| Architecture | Client-Server, Separated Compute & Storage | Hybrid, Local-First Execution & Serverless Cloud |
| Pricing Model | Consumption-based (credits), 60s minimums | True Usage-based, Per-second, no minimums |
| Admin Overhead | High (manage clusters, roles, IAM) | Low (serverless, minimal configuration) |
| Ideal Workload | Extremely large distributed batch ETL | Interactive analytics, Agile development, Embedded analytics |
| Best For | Large enterprises with dedicated data teams | Teams of any size, from startups to large enterprises |
The economic impact of choosing the right model is significant. Startups report dramatic savings by moving to a lean architecture. For instance, Gardyn found their MotherDuck-powered stack to be 10x more affordable than leading alternatives for their IoT analytics workload, while another company saw a 70% cost reduction.
How Can Non-Technical Users Perform Ad-Hoc Queries?
A major hurdle to true self-service is the SQL skill gap. For decades, asking a new question of your data meant asking an analyst to write a new query. Today, a new wave of tools is making it possible for anyone to query data without writing code.
The most transformative trend is the rise of AI-powered Natural Language-to-SQL (NL-to-SQL). This technology allows users to ask questions in plain English ("What were our top 10 selling products in the last quarter?"), which an AI model then converts into a valid SQL query. The results can be impressive as these tools empower teams to make faster decisions without waiting for a report.
MotherDuck's own UI is designed for this kind of easy exploration. Features like the Column Explorer provide quick visual summaries of data, while Instant SQL provides real-time results as you type, dramatically speeding up the process of building and debugging queries without ever hitting a "run" button. By connecting modern BI tools to MotherDuck, startups can provide a safe, governed, and high-performance environment for natural language exploration.
How Do Data Teams Collaborate Without Duplicating Data?
As a startup grows, preventing data duplication and maintaining a single source of truth becomes a primary challenge. When every team creates its own version of a dataset, you end up with conflicting metrics, inconsistent reports, and a deep-seated lack of trust in the data.
The solution is to treat your data definitions like software code, using a combination of modern tooling and Git-like workflows.
A core component of this strategy is the semantic layer. This acts as a translation layer between the raw data in your warehouse and the business concepts your team understands, like "revenue" or "active users". By defining a metric once in a central location, you prevent "metric drift," where different departments calculate the same KPI in slightly different ways. Tools like Cube and dbt's Semantic Layer integrate with MotherDuck to provide this consistent, governed view of your business logic.
This is formalized through data contracts, agreements between data producers (engineers) and consumers (analysts, business users), often defined in a simple YAML file. These contracts specify the schema, quality standards, and ownership of a dataset. Any proposed changes are reviewed and automatically tested through a pull request (PR) workflow, just like software code, preventing breaking changes downstream.
MotherDuck's architecture is uniquely suited for this collaborative model.
- SHARES: Data can be stored once and shared securely using
SHARES, which provide read-only access to specific databases. This avoids data duplication entirely. - Ducklings: Each team member gets their own isolated, serverless compute instance called a "Duckling." This means an analyst running a complex, exploratory query won't slow down anyone else's dashboards, a common "noisy neighbor" problem in traditional warehouses.
This powerful combination of shared data and isolated compute creates a safe, efficient, and truly collaborative environment for the entire team.
How Do Modern Collaborative Notebooks Compare?
| Platform | Live Collaboration | SQL + Py/R Support | Publish as Apps |
|---|---|---|---|
| Hex | Yes, real-time multiplayer editing, commenting, versioning. | Yes, combines SQL, Python, and spreadsheets in one interface. | Yes, as interactive data apps. |
| Deepnote | Yes, easy cloud-based collaboration. | Yes, combines Python, SQL, and R. | Yes, as data apps or dashboards. |
| Observable | Yes, real-time multiplayer, comments, forking & merging. | JavaScript-native, SQL via connectors. | Yes, embed as iframes or reactive JS modules. |
For startups, these platforms consolidate the entire analytics workflow. An analyst can connect to MotherDuck, query data with SQL, perform advanced analysis in Python, build interactive visualizations, and publish a data app for the marketing team, all within a single, collaborative environment.
How Can We Integrate Real-Time Dashboards into Our SaaS Product?
For SaaS startups, offering embedded analytics is a powerful differentiator. Providing customers with in-app, real-time dashboards can increase engagement, reduce churn, and create new revenue streams. Building this capability from scratch, however, is a massive and resource-intensive undertaking.
The modern approach is to use a purpose-built embedded analytics platform for the front-end components, powered by a high-performance customer-facing analytics database like MotherDuck on the back end. This allows you to ship a high-quality analytics experience with minimal developer effort. A key architectural decision is choosing between a simple iframe and a more integrated JavaScript SDK. While iframes are quick to set up, they often feel clunky and disconnected. A native JS SDK provides a smooth user experience that matches your product's look and feel, though it requires more initial development effort.
Case Study: How Layers Avoided a 1,000x Cost Increase with MotherDuck
The retail analytics platform Layers was facing a projected 1,000x cost increase from their data vendor. To avoid this, they re-architected their stack around MotherDuck. They now land data as compressed Parquet files in cloud object storage, and MotherDuck queries the data in place using "zero-copy analytics." This new architecture powers customer dashboards that load within their 110 ms SLA target. The move not only saved them from crippling costs but also unlocked a freemium tier, as the incremental cost for small tenants is now "fractions of a penny."
MotherDuck's architecture is exceptionally well-suited for powering embedded analytics. Its ability to handle thousands of concurrent queries with low latency is precisely what customer-facing use cases demand.
Is There a Sustainable Way to Scale Customized Client Reporting?
For many B2B startups, creating custom reports for clients begins as a manual, unsustainable process of exporting CSVs and building slide decks. As the client base grows, this "export hell" becomes a major operational bottleneck that consumes countless hours.
The scalable solution is to build an automated, self-service reporting system using an embedded analytics tool that supports white-labeling, parameterized reports, and a multi-tenant data architecture. Instead of building dozens of unique reports, your team creates a library of master templates. These templates are then dynamically populated with each client's data and branded with their logo, which they can access on demand.
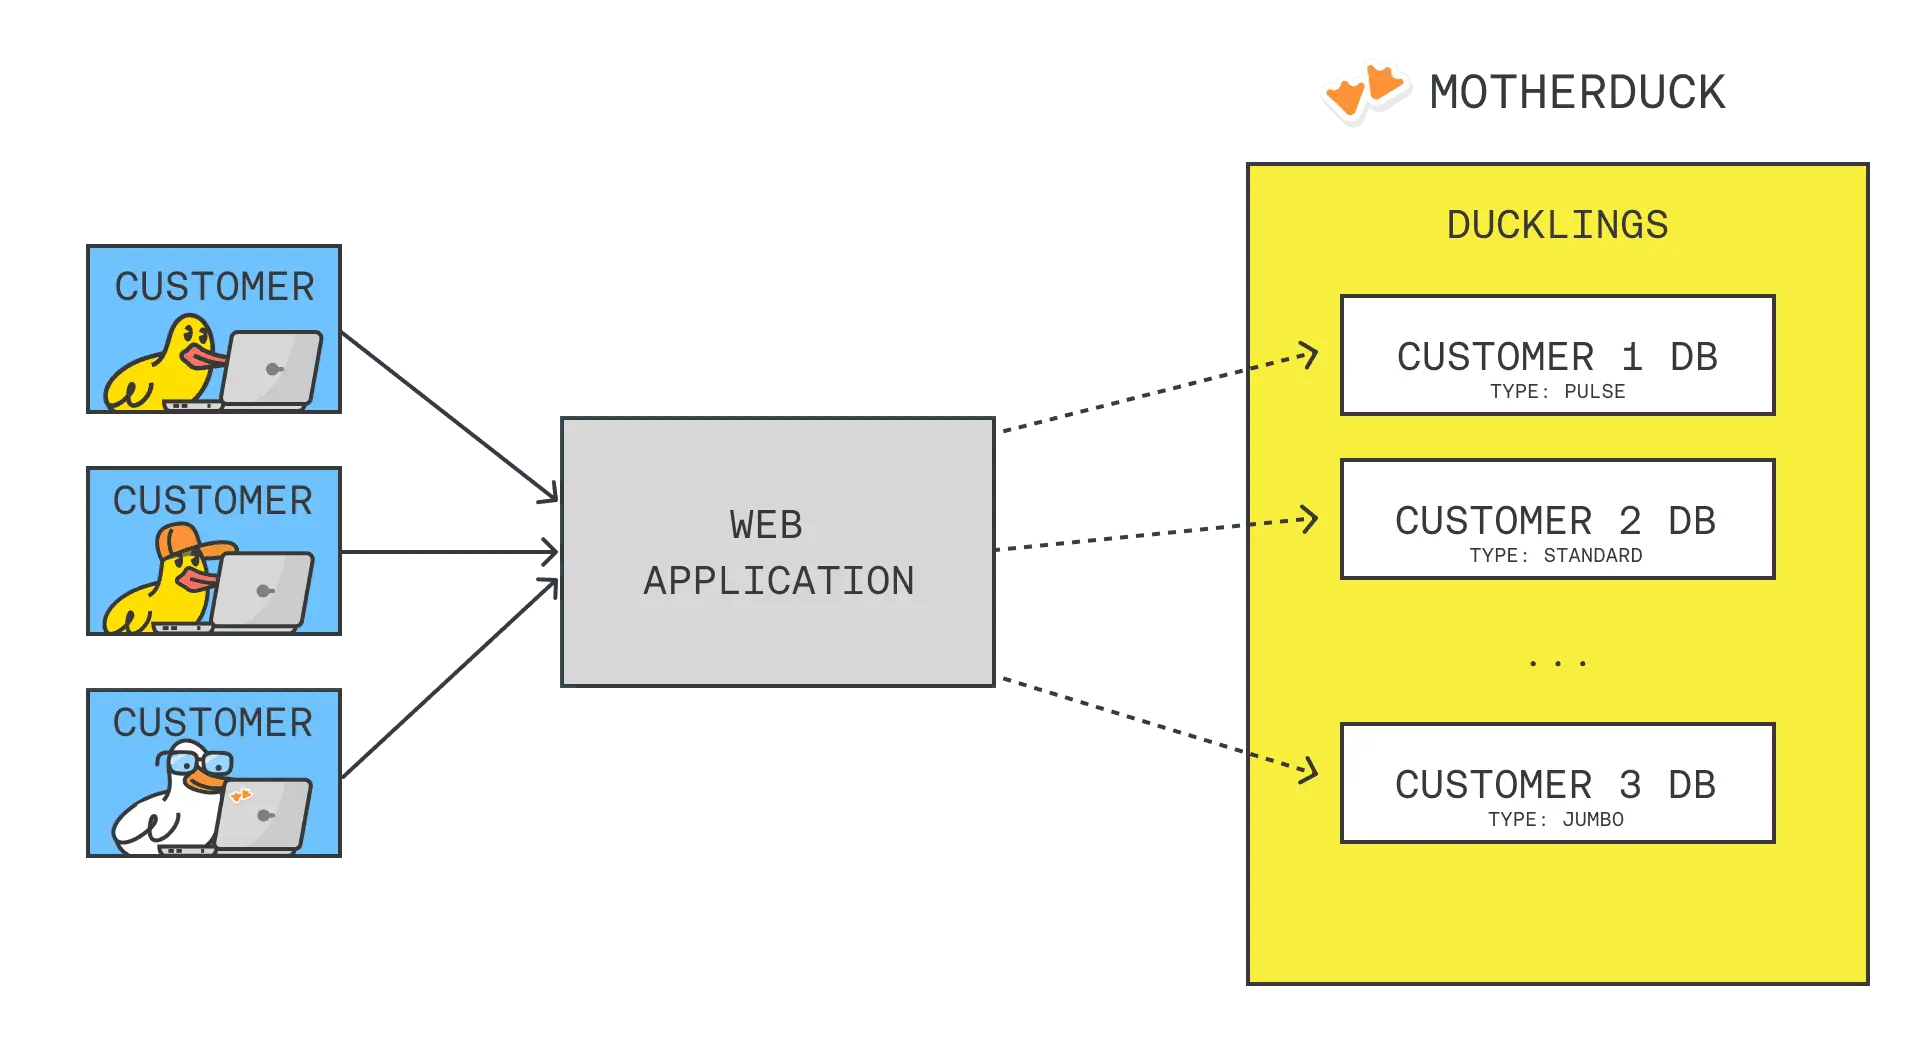
MotherDuck is architecturally designed for this multi-tenant model. Its "hyper-tenancy" approach can provide each client with their own isolated database and compute "Duckling". This provides three key benefits:
- Data Isolation: Eliminates any risk of data leakage between clients.
- Performance Isolation: A heavy query from one client won't slow down the experience for others.
- Cost Attribution: Because compute is isolated per tenant, it's easy to track costs and align your pricing with customer usage.
What is a Practical Roadmap for Implementing Self-Service Analytics?
Transitioning to a modern analytics stack is a journey, not an overnight switch. Here is a practical 30-60-90 day plan for a startup to get started with MotherDuck and build a foundation for a scalable, data-driven culture.
Days 1-30: Establish the Foundation
- Goal: Get your core data into MotherDuck and build your first internal dashboard.
- Actions:
- Sign up for a free MotherDuck trial.
- Identify 1-2 critical data sources (e.g., production database replica, event stream) and land the data in a cloud object store.
- Connect a BI tool like Metabase or Tableau to MotherDuck and build one high-value dashboard for an internal team (e.g., Marketing).
- Draft your first data contract in YAML for your core tables, defining owners and key columns.
Days 31-60: Pilot Self-Service and Embedded Analytics
- Goal: Empower a pilot group of business users and launch your first embedded dashboard.
- Actions:
- Select a pilot group of 5-10 non-technical users and run a focused training sprint on the BI tool.
- Onboard them to MotherDuck's UI, encouraging independent exploration with features like the Column Explorer and Filter button.
- Using an embedded analytics platform, build and launch one customer-facing dashboard for a small, friendly set of beta customers.
Days 61-90: Scale and Automate
- Goal: Roll out self-service to more teams and launch a scalable client reporting library.
- Actions:
- Expand the self-service training program to other departments based on learnings from the pilot.
- Build a library of 3-5 parameterized report templates for your external clients.
- Roll out the white-labeled, self-service reporting portal to all clients.
- Establish a governance council to review new metric definitions and manage the data contract workflow.
Start using MotherDuck now!
FAQS
Effective strategies include providing intuitive tools with features like Natural Language-to-SQL (NL-to-SQL), offering role-specific training sprints, and establishing clear data governance. This combination lowers the technical barrier, makes data exploration relevant to their jobs, and provides safe "guardrails" for independent analysis.
Non-technical users can be empowered through modern tools that don't require writing SQL. AI-powered Natural Language-to-SQL (NL-to-SQL) platforms allow users to ask questions in plain English, while visual query builders provide a drag-and-drop interface. This allows them to get answers in minutes, not days.
Teams can collaborate effectively by using a central data warehouse like MotherDuck and implementing three key practices: 1) Using SHARES to provide read-only access to a single source of truth. 2) Defining metrics centrally in a semantic layer to ensure consistency. 3) Managing changes to data models through data contracts and a Git-like pull request workflow to prevent breaking changes.
The most efficient method is to use a purpose-built embedded analytics platform for the front-end, powered by a high-performance data warehouse like MotherDuck on the back-end. This "buy vs. build" approach allows you to ship a polished, real-time analytics experience with minimal developer effort, often using a native JavaScript SDK for a seamless user experience.
Effective governance relies on three pillars: 1) Access Control (RBAC and RLS) to control who sees what data, 2) Metric Consistency using a semantic layer to define metrics centrally, and 3) Process using data contracts and a PR-based workflow to manage and validate changes to data models.
