For more than a decade now, the fact that people have a hard time gaining actionable insights from their data has been blamed on its size. “Your data is too big for your puny systems,” was the diagnosis, and the cure was to buy some new fancy technology that can handle massive scale. Of course, after the Big Data task force purchased all new tooling and migrated from Legacy systems, people found that they still were having trouble making sense of their data. They also may have noticed, if they were really paying attention, that data size wasn’t really the problem at all.
The world in 2023 looks different from when the Big Data alarm bells started going off. The data cataclysm that had been predicted hasn’t come to pass. Data sizes may have gotten marginally larger, but hardware has gotten bigger at an even faster rate. Vendors are still pushing their ability to scale, but practitioners are starting to wonder how any of that relates to their real world problems.
Who am I and why do I care?
For more than 10 years, I was one of the acolytes beating the Big Data drum. I was a founding engineer on Google BigQuery, and as the only engineer on the team that actually liked public speaking, I got to travel to conferences around the world to help explain how we were going to help folks withstand the coming data explosion. I used to query a petabyte live on stage, demonstrating that no matter how big and bad your data was, we would be able to handle it, no problem.
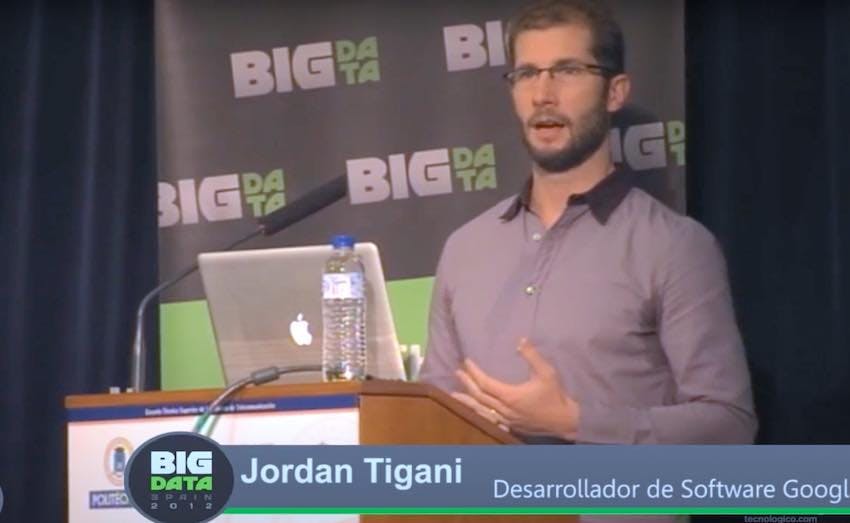
This photo was me at Big Data Spain in 2012, warning of the dangers of giant datasets and promising relief if they just use our technology.
Over the next few years I spent a lot of time debugging problems that customers were having with BigQuery. I co-wrote two books and really dug into how the product was being used. In 2018, I switched to product management, and my job was split between talking to customers, many of whom were the largest enterprises in the world, and analyzing product metrics.
The most surprising thing that I learned was that most of the people using “Big Query” don’t really have Big Data. Even the ones who do tend to use workloads that only use a small fraction of their dataset sizes. When BigQuery came out, it was like science fiction for many people-- you literally couldn’t process data that fast in any other way. However, what was science fiction is now commonplace, and more traditional ways of processing your data have caught up.
About this post
This post will make the case that the era of Big Data is over. It had a good run, but now we can stop worrying about data size and focus on how we’re going to use it to make better decisions. I’ll show a number of graphs; these are all hand-drawn based on memory. If I did have access to the exact numbers, I wouldn’t be able to share them. But the important part is the shape, rather than the exact values.
The data behind the graphs come from having analyzed query logs, deal post-mortems, benchmark results (published and unpublished), customer support tickets, customer conversations, service logs, and published blog posts, plus a bit of intuition.
The obligatory intro slide
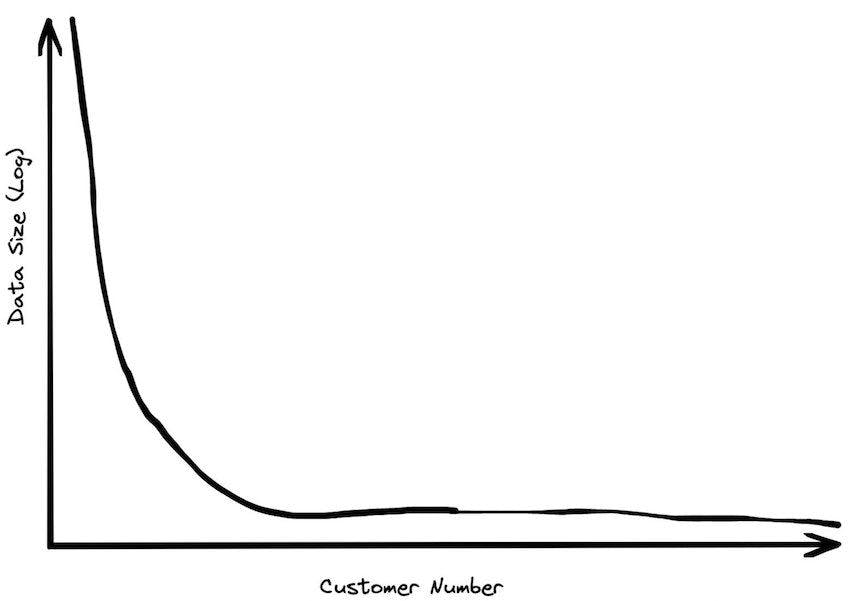
For the last 10 years, every pitch deck for every big data product starts with a slide that looks something like this:
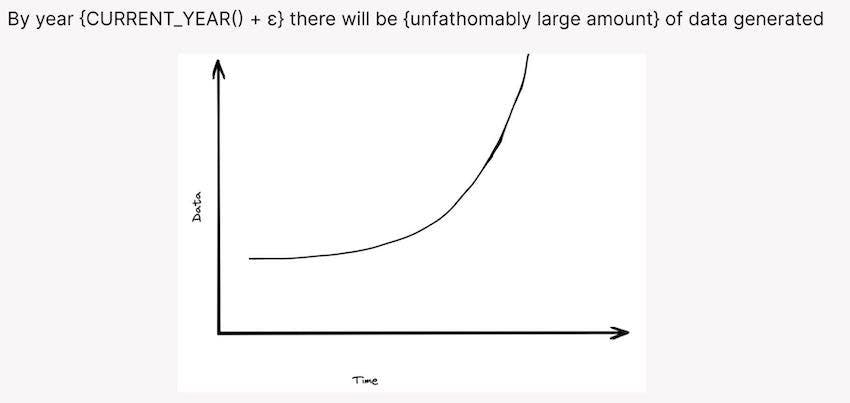
We used a version of this slide for years at Google. When I moved to SingleStore, they were using their own version that had the same chart. I’ve seen several other vendors with something similar. This is the “scare” slide. Big Data is coming! You need to buy what I’m selling!
The message was that old ways of handling data were not going to work. The acceleration of data generation was going to leave the data systems of yesteryear stuck in the mud, and anyone who embraced new ideas would be able to leapfrog their competitors.
Of course, just because the amount of data being generated is increasing doesn’t mean that it becomes a problem for everyone; data is not distributed equally. Most applications do not need to process massive amounts of data. This has led to a resurgence in data management systems with traditional architectures; SQLite, Postgres, MySQL are all growing strongly, while “NoSQL” and even “NewSQL” systems are stagnating.
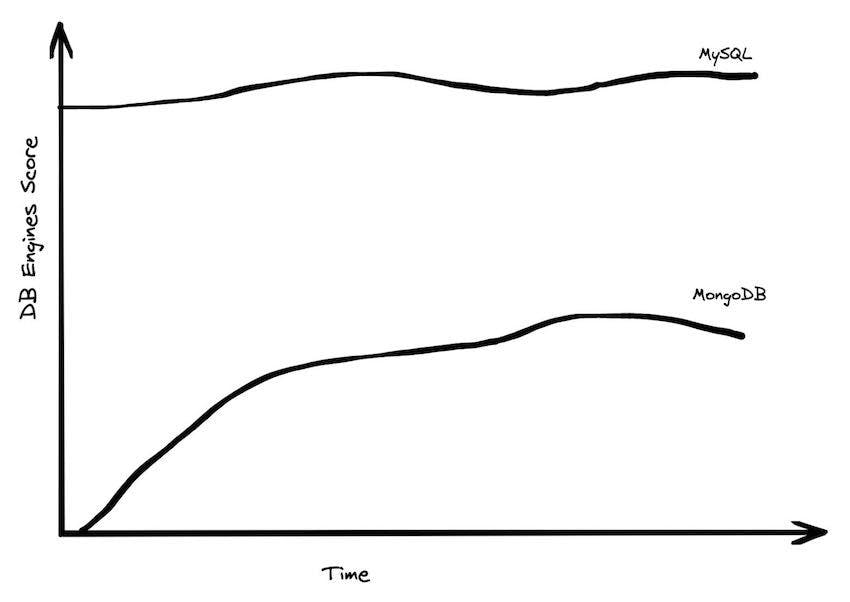
MongoDB is the highest ranked NoSQL or otherwise scale-out database, and while it had a nice run-up over the years, it has been declining slightly recently, and hasn’t really made much headway against MySQL or Postgres, two resolutely monolithic databases. If Big Data were really taking over, you’d expect to see something different after all these years.
Of course, the picture looks different in analytical systems, but in OLAP you see a massive shift from on-premise to cloud, and there aren’t really any scale-up cloud analytical systems to compare against.
Most people don’t have that much data
The intended takeaway from the “Big Data is coming” chart was that pretty soon, everyone will be inundated by their data. Ten years in, that future just hasn’t materialized. We can validate this several ways: looking at data (quantitatively), asking people if it is consistent with their experience (qualitatively), and thinking it through from first principles (inductively).
When I worked at BigQuery, I spent a lot of time looking at customer sizing. The actual data here is very sensitive, so I can’t share any numbers directly. However, I can say that the vast majority of customers had less than a terabyte of data in total data storage. There were, of course, customers with huge amounts of data, but most organizations, even some fairly large enterprises, had moderate data sizes.
Customer data sizes followed a power-law distribution. The largest customer had double the storage of the next largest customer, the next largest customer had half of that, etc. So while there were customers with hundreds of petabytes of data, the sizes trailed off very quickly. There were many thousands of customers who paid less than $10 a month for storage, which is half a terabyte. Among customers who were using the service heavily, the median data storage size was much less than 100 GB.
We found further support for this when talking to industry analysts (Gartner, Forrester, etc). We would extol our ability to handle massive data sets, and they would shrug. “This is nice,” they said, “but the vast majority of enterprises have data warehouses smaller than a terabyte.” The general feedback we got talking to folks in the industry was that 100 GB was the right order of magnitude for a data warehouse. This is where we focused a lot of our efforts in benchmarking.
One of our investors decided to find out how big analytical data sizes really are and surveyed his portfolio companies, some which were post-exit (either had IPO’d or been acquired by larger organizations). These are tech companies, which are likely going to skew towards larger data sizes. He found that the largest B2B companies in his portfolio had around a terabyte of data, while the largest B2C companies had around 10 Terabytes of data. Most, however, had far less data.
In order to understand why large data sizes are rare, it is helpful to think about where the data actually comes from. Imagine you’re a medium sized business, with a thousand customers. Let’s say each one of your customers places a new order every day with a hundred line items. This is relatively frequent, but it is still probably less than a megabyte of data generated per day. In three years you would still only have a gigabyte, and it would take millenia to generate a terabyte.
Alternately, let’s say you have a million leads in your marketing database, and you’re running dozens of campaigns. Your leads table is probably still less than a gigabyte, and tracking each lead across each campaign still probably is only a few gigabytes. It is hard to see how this adds to massive data sets under reasonable scaling assumptions.
To give a concrete example, I worked at SingleStore in 2020-2022, when it was a fast-growing Series E company with significant revenue and a unicorn valuation. If you added up the size of our finance data warehouse, our customer data, our marketing campaign tracking, and our service logs, it was probably only a few gigabytes. By any stretch of the imagination, this is not big data.
The storage bias in separation of storage and compute.
Modern cloud data platforms all separate storage and compute, which means that customers are not tied to a single form factor. This, more than scale out, is likely the single most important change in data architectures in the last 20 years. Instead of “shared nothing” architectures which are hard to manage in real world conditions, shared disk architectures let you grow your storage and your compute independently. The rise of scalable and reasonably fast object storage like S3 and GCS meant that you could relax a lot of the constraints on how you built a database.
In practice, data sizes increase much faster than compute sizes. While popular descriptions of the benefits of storage and compute separation make it sound like you may choose to scale either one at any time, the two axes are not really equivalent. Misunderstanding of this point leads to a lot of the discussion of Big Data, because techniques for dealing with large compute requirements are different from dealing with large data. It is helpful to explore why this may be the case.
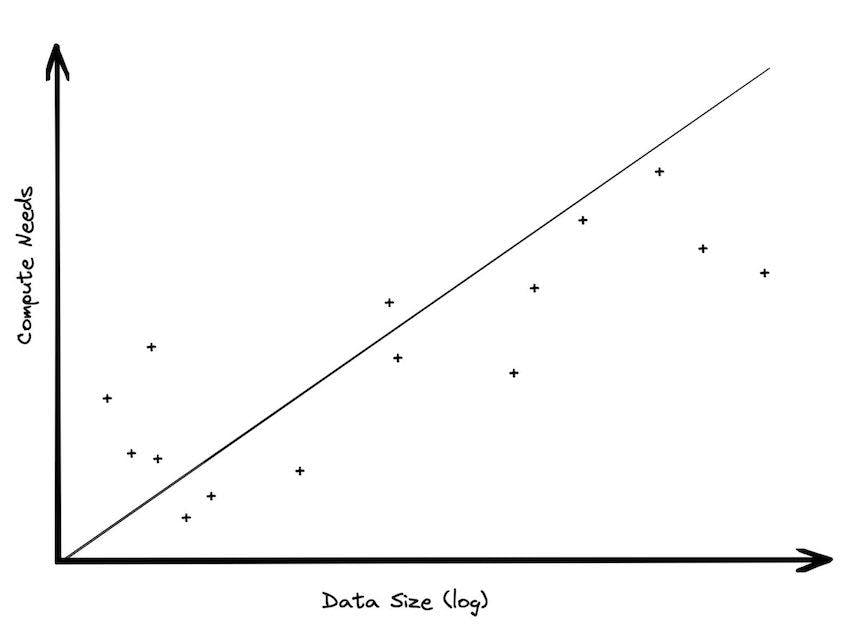
All large data sets are generated over time. Time is almost always an axis in a data set. New orders come in every day. New taxi rides. New logging records. New games being played. If a business is static, neither growing or shrinking, data will increase linearly with time. What does this mean for analytic needs? Clearly data storage needs will increase linearly, unless you decide to prune the data (more on this later). But compute needs will likely not need to change very much over time; most analysis is done over the recent data. Scanning old data is pretty wasteful; it doesn’t change, so why would you spend money reading it over and over again? True, you might want to keep it around just in case you want to ask a new question of the data, but it is pretty trivial to build aggregations containing the important answers.
Very often when a data warehousing customer moves from an environment where they didn’t have separation of storage and compute into one where they do have it, their storage usage grows tremendously, but their compute needs tend to not really change. In BigQuery, we had a customer who was one of the largest retailers in the world. They had an on-premise data warehouse that was around 100 TB of data. When they moved to the cloud, they ended up with 30 PB of data, a 300x increase. If their compute needs had also scaled up by a similar amount, they would have been spending billions of dollars on analytics. Instead, they spent a tiny fraction of that amount.
This bias towards storage size over compute size has a real impact in system architecture. It means that if you use scalable object stores, you might be able to use far less compute than you had anticipated. You might not even need to use distributed processing at all.
Workload sizes are smaller than overall data sizes
The amount of data processed for analytics workloads is almost certainly smaller than you think. Dashboards, for example, very often are built from aggregated data. People look at the last hour, or the last day, or the last week’s worth of data. Smaller tables tend to be queried more frequently, giant tables more selectively.
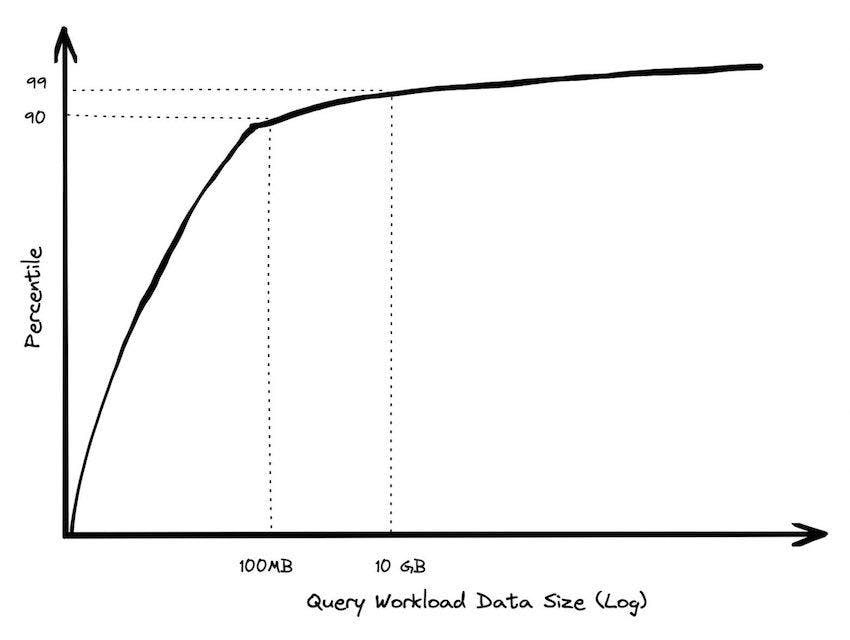
A couple of years ago I did an analysis of BigQuery queries, looking at customers spending more than $1000 / year. 90% of queries processed less than 100 MB of data. I sliced this a number of different ways to make sure it wasn’t just a couple of customers who ran a ton of queries skewing the results. I also cut out metadata-only queries, which are a small subset of queries in BigQuery that don’t need to read any data at all. You have to go pretty high on the percentile range until you get into the gigabytes, and there are very few queries that run in the terabyte range.
Customers with giant data sizes almost never queried huge amounts of data
Customers with moderate data sizes often did fairly large queries, but customers with giant data sizes almost never queried huge amounts of data. When they did, it was generally because they were generating a report, and performance wasn’t really a priority. A large social media company would run reports over the weekend to prepare for executives on Monday morning; those queries were pretty huge, but they were only a tiny fraction of the hundreds of thousands of queries they ran the rest of the week.
Even when querying giant tables, you rarely end up needing to process very much data. Modern analytical databases can do column projection to read only a subset of fields, and partition pruning to read only a narrow date range. They can often go even further with segment elimination to exploit locality in the data via clustering or automatic micro partitioning. Other tricks like computing over compressed data, projection, and predicate pushdown are ways that you can do less IO at query time. And less IO turns into less computation that needs to be done, which turns into lower costs and latency.
There are acute economic pressures incentivizing people to reduce the amount of data they process. Just because you can scale out and process something very fast doesn’t mean you can do so inexpensively. If you use a thousand nodes to get a result, that is probably going to cost you an arm and a leg. The Petabyte query I used to run on stage to show off BigQuery cost $5,000 at retail prices. Very few people would want to run something so expensive.
Note that the financial incentive to processing less data holds true even if you’re not using a pay-per-byte-scanned pricing model. If you have a Snowflake instance, if you can make your queries smaller, you can use a smaller instance, and pay less. Your queries will be faster, you can run more concurrently, and you generally will pay less over time.
Most data is rarely queried
A huge percentage of the data that gets processed is less than 24 hours old. By the time data gets to be a week old, it is probably 20 times less likely to be queried than from the most recent day. After a month, data mostly just sits there. Historical data tends to be queries infrequently, perhaps when someone is running a rare report.
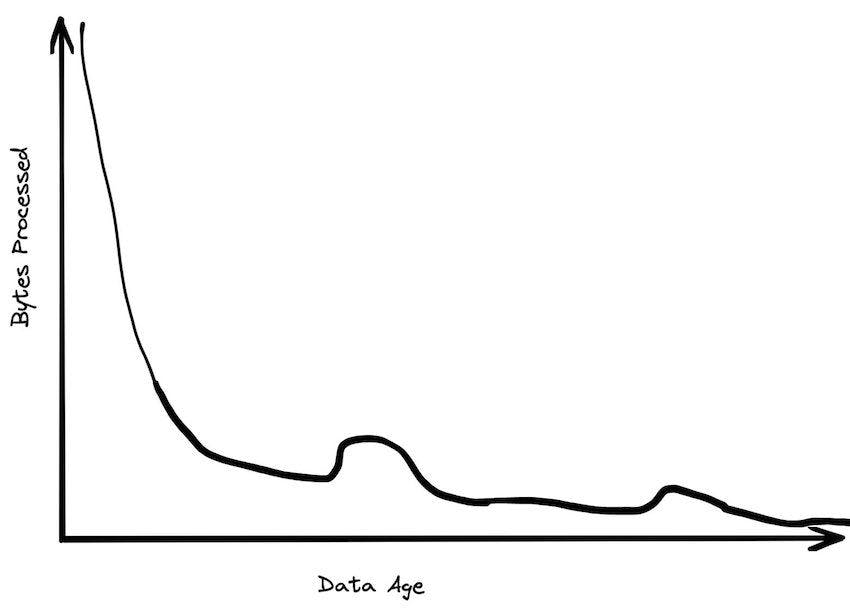
Data storage age patterns are a lot flatter. While a lot of data gets discarded pretty quickly, a lot of data just gets appended to the end of tables. The most recent year might only have 30% of the data but 99% of data accesses. The most recent month might have 5% of data but 80% of data accesses.
The quiescing of data means that data working set sizes are more manageable than you would expect. If you have a petabyte table that has 10 years worth of data, you might rarely access any of the data older than the current day, which might have less than 50 GB compressed.
The Big Data Frontier keeps receding
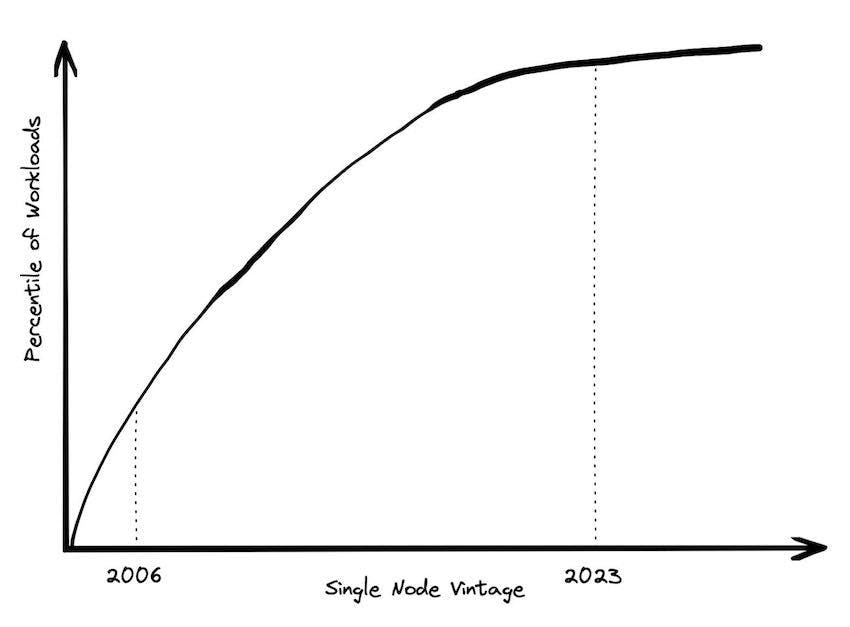
One definition of “Big Data” is “whatever doesn’t fit on a single machine.. By that definition, the number of workloads that qualify has been decreasing every year.
In 2004, when the Google MapReduce paper was written, it would have been very common for a data workload to not fit on a single commodity machine. Scaling up was expensive. In 2006, AWS launched EC2, and the only size of instance you could get was a single core and 2 GB of RAM. There were a lot of workloads that wouldn’t fit on that machine.
Today, however, a standard instance on AWS uses a physical server with 64 cores and 256 GB of RAM. That’s two orders of magnitude more RAM. If you’re willing to spend a little bit more for a memory-optimized instance, you can get another two orders of magnitude of RAM. How many workloads need more than 24TB of RAM or 445 CPU cores?
It used to be that larger machines were a lot more expensive. However, in the cloud, a VM that uses a whole server only costs 8x more than one that uses an 8th of a server. Cost scales up linearly with compute power, up through some very large sizes. In fact, if you look at the benchmarks published in the original dremel paper using 3,000 parallel nodes, you can get similar performance on a single node today (more on this to come).
Data is a Liability
An alternate definition of Big Data is “when the cost of keeping data around is less than the cost of figuring out what to throw away.” I like this definition because it encapsulates why people end up with Big Data. It isn’t because they need it; they just haven’t bothered to delete it. If you think about many data lakes that organizations collect, they fit this bill entirely: giant, messy swamps where no one really knows what they hold or whether it is safe to clean them up.
The cost of keeping data around is higher than just the cost to store the physical bytes. Under regulations like GDPR and CCPA, you are required to track all usage of certain types of data. Some data needs to be deleted within a certain period of time. If you have phone numbers in a parquet file that sit around for too long in your data lake somewhere, you may be violating statutory requirements.
Beyond regulation, data can be an aid to lawsuits against you. Just as many organizations enforce limited email retention policies in order to reduce potential liability, the data in your data warehouse can likewise be used against you. If you’ve got logs from five years ago that would show a security bug in your code or missed SLA, keeping old data around can prolong your legal exposure. There is a possibly apocryphal story I’ve heard about a company keeping its data analytics capabilities secret in order to prevent them from being used during a legal discovery process.
Code often suffers from what people call “bit rot” when it isn’t actively maintained. Data can suffer from the same type of problem; that is, people forget the precise meaning of specialized fields, or data problems from the past may have faded from memory. For example, maybe there was a short-lived data bug that set every customer id to null. Or there was a huge fraudulent transaction that made it look like Q3 2017 was a lot better than it actually was. Often business logic to pull out data from a historical time period can get more and more complicated. For example, there might be a rule like, “ if the date is older than 2019 use the revenue field, between 2019 and 2021 use the revenue_usd field, and after 2022 use the revenue_usd_audited field.” The longer you keep data around, the harder it is to keep track of these special cases. And not all of them can be easily worked around, especially if there is missing data.
If you are keeping around old data, it is good to understand why you are keeping it. Are you asking the same questions over and over again? If that is the case, wouldn’t it be far less expensive in terms of storage and query costs to just store aggregates? Are you keeping it for a rainy day? Are you thinking that there are new questions you might want to ask? If so, how important is it? How likely is it that you’ll really need it? Are you really just a data hoarder? These are all important questions to ask, especially as you try to figure out the true cost of keeping the data.
Are you in the BIg Data One Percent?
Big Data is real, but most people may not need to worry about it. Some questions that you can ask to figure out if you’re a “Big Data One-Percenter”:
- Are you really generating a huge amount of data?
- If so, do you really need to use a huge amount of data at once?
- If so, is the data really too big to fit on one machine?
- If so, are you sure you’re not just a data hoarder?
- If so, are you sure you wouldn’t be better off summarizing?
If you answer no to any of these questions, you might be a good candidate for a new generation of data tools that help you handle data at the size you actually have, not the size that people try to scare you into thinking that you might have someday.
Start using MotherDuck now!