You’ve probably heard the old Henry Ford quotation about customers wanting faster horses. Clearly he was full of horse-shit; what everyone needs is faster ducks. And with the recent DuckDB 1.4 release, we’re seeing an average of nearly 20% improvement in performance; that’s some faster ducks indeed.
When we started MotherDuck, we made a huge bet on DuckDB; it was already an amazing analytics engine, but what was even more impressive was how quickly it was getting better. You’d assume that after a while the pace of improvement would slow down, but three and a half years later, if anything they’re moving even faster.
At MotherDuck, we operate the largest, most complex fleet of DuckDB instances in the world. We push DuckDB hard, know where it reaches its limits, and work very closely with Hannes & Mark (the creators of DuckDB) and the rest of the DuckDB team to pinpoint where people run into problems. Every DuckDB release has gotten harder to break, thanks to improvements from memory management to concurrency.
There used to be a disclaimer on the DuckDB website about how they didn’t really care about performance; the goal was first to make a database that was correct, and then they’d make it fast. That disclaimer isn’t on the website anymore, because they’ve finally gotten around to working on performance. And, without ruining the surprise, they’ve made DuckDB damn fast.
Lies, Damn Lies, and Benchmarks
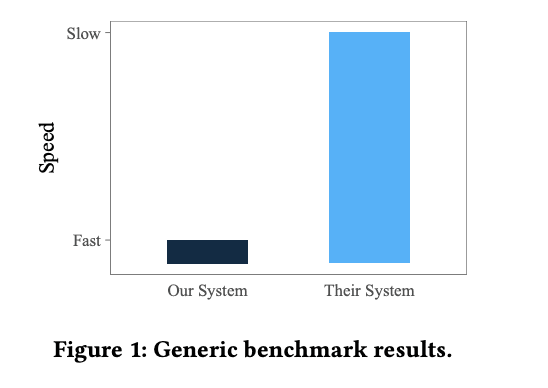
It is always a good idea to take database benchmarks with a grain of salt, especially when a vendor is sharing the results. Hannes and Mark even wrote a paper about how fair database benchmarking is difficult to do, which includes this famous satirical graph:
One way to get slightly more valid benchmarks is to look at benchmarks created by someone else. Hannes likes to call these “Away benchmarks”, since it is a lot harder to win when you’re playing on someone else’s home turf rather than your own. When your competitor creates a benchmark, it generally is done to make them look good vs their competition, and when things go well for you using that benchmark, it is probably a very good sign.
One such “away benchmark” is ClickBench. It was created by the folks at ClickHouse and includes a bunch of queries of the type that ClickHouse is good at. That said, for a vendor benchmark, it is pretty good at representing the types of queries that people actually run. It doesn’t use a huge amount of data, but then most people don’t actually use a ton of data in their day-to-day queries (see this analysis we did of public datasets). Database people tend to favor the TPC-H and TPC-DS benchmarks, but those are pretty well-known to be non-representative of real-world workloads. The other nice thing about ClickBench is that anyone can submit results, so dozens of vendors have tried their hands at claiming the top spot.
As of this morning, the MotherDuck Mega instance is #1 overall in ClickBench. While this is a nice result, there are a handful of systems that are only a few percent slower, and the rankings will almost certainly change over time. We try not to put too much stock in this kind of thing.
What is interesting to us, however, is that if you limit the results to the main Cloud Data Warehouses (BigQuery, Snowflake, Redshift, MotherDuck), the results are dramatic, and less likely to be overturned with a clever hack or tweak to the scoring.
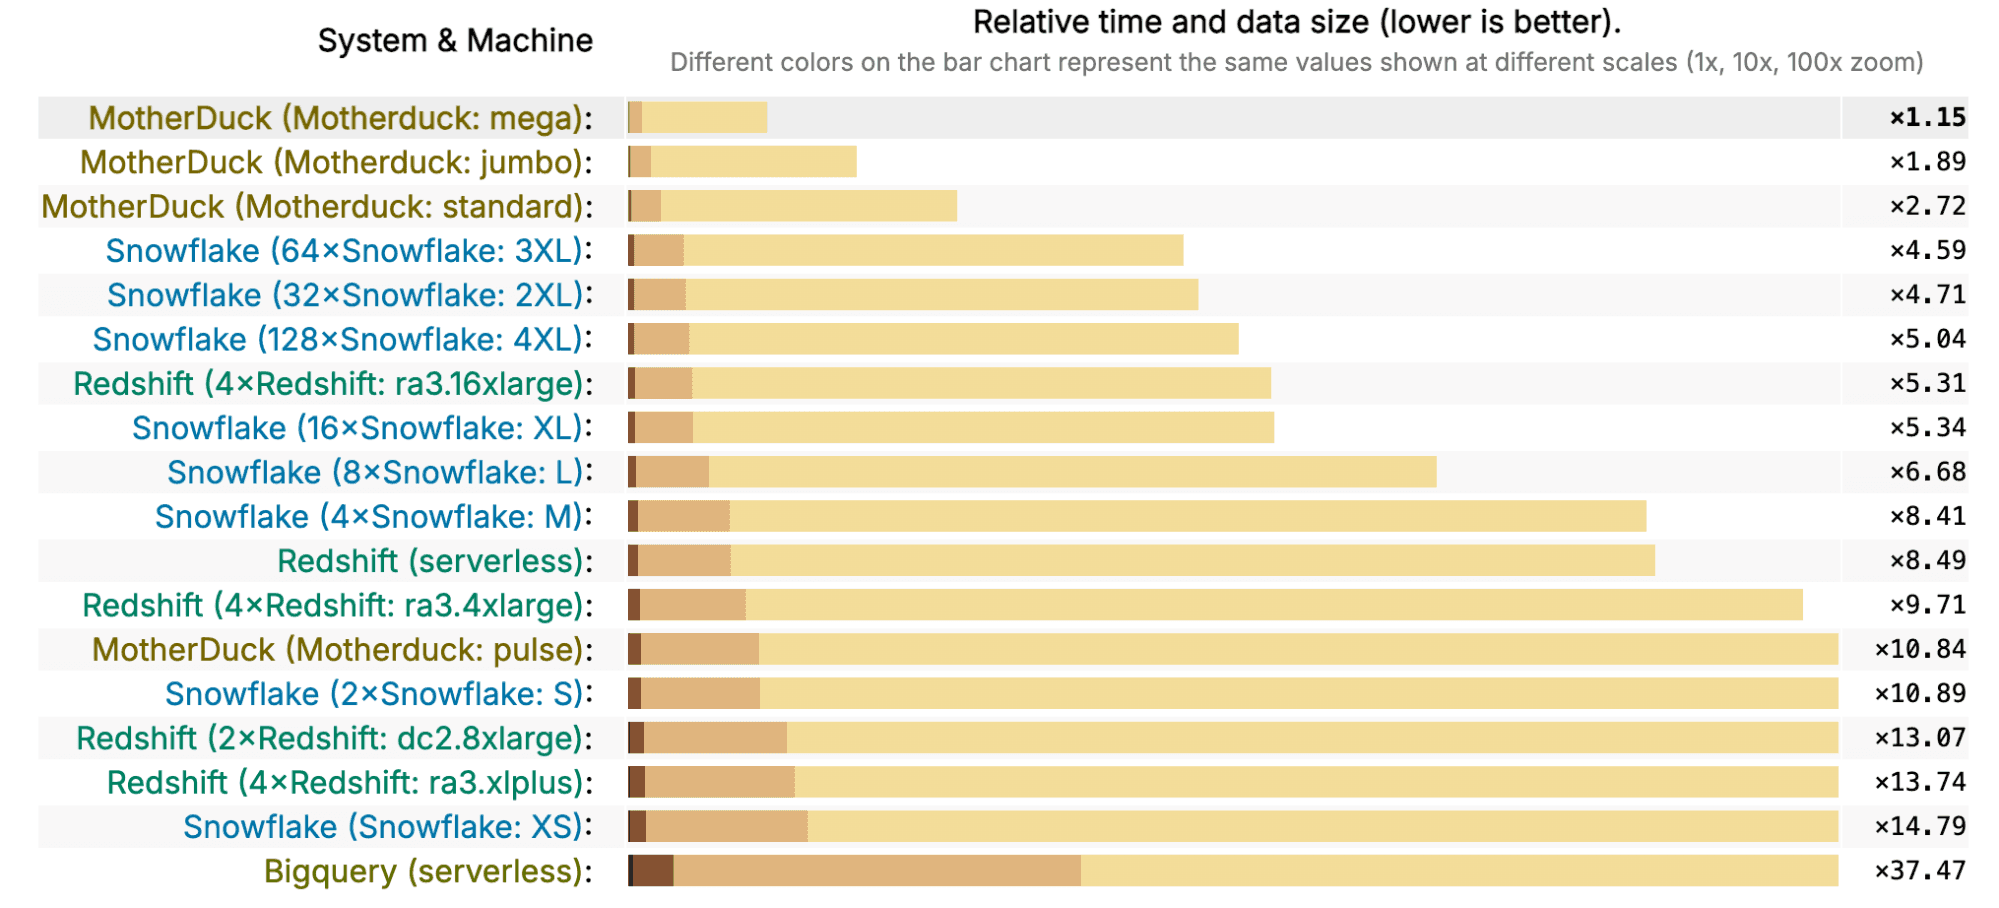
Let’s take a look at the MotherDuck Standard, at $1.80/hour, and see how it stacks up against the other vendors. The fastest Redshift cluster is the 4x ra3.16xlarge (that really rolls off the tongue), which costs 29 times as much, at $52/hour, and is just a little bit slower than the MotherDuck Standard. MotherDuck Standard is also faster than a Snowflake 3XL at only 1/100 of the price. This last comparison isn’t super fair because Snowflake doesn’t really get much faster after you get to the XL instance. However, a Snowflake XL at $32/hour is still 18 times more expensive than a MotherDuck Standard, while being half the performance.
Say we wanted to compare similarly priced options and how they score in the benchmark. MotherDuck Jumbo instances, at $3.20, are a little bit less expensive than a Snowflake S ($4), but are 6x faster. MotherDuck Mega instances at $10.80 are a little bit more expensive than a Snowflake M ($8), but are 7 times faster. If we’re looking at Redshift, the 4x ra3.xlplus costs $4.34 an hour, not too much more than a MotherDuck Jumbo at $3.20, but with less than 1/7th the performance. The Redshift 2x dc2.8xlarge is $9.60/hour, about 10% less expensive than a MotherDuck Mega, but 1/11th the performance.
Here is another way to look at it; let’s say you want to run the Clickbench workload, how much does it cost you to run it in MotherDuck, Snowflake, and Redshift? Let’s say we want to run it 100 times, and the first time we’ll use the time it took the ‘cold’ run, and the remaining times we’ll use the time for the hot run. After downloading the raw data from the results, I’ve summarized the cost to run this workload in the following chart (in dollars, lower is better unless you like spending more money):
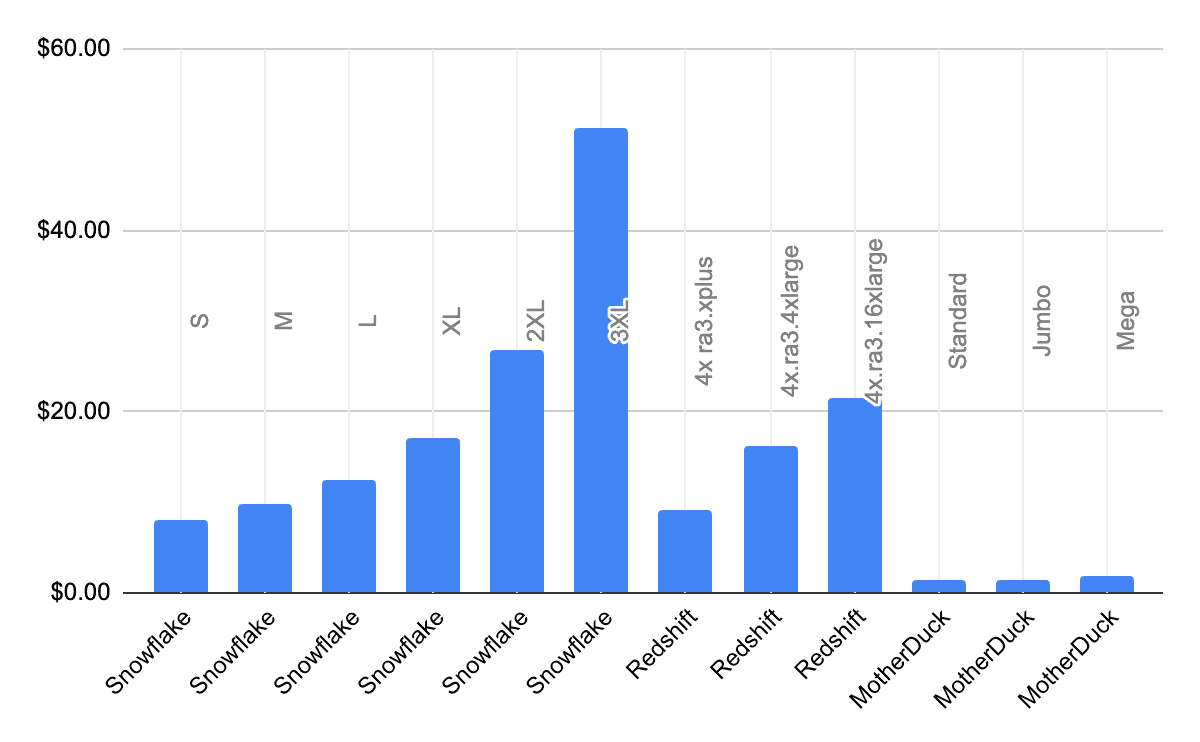
In general, database vendors give you the ability to “pay more to make it go faster”. That is, you can run on a larger instance and, in general, your performance will be better. In a perfect world, you could pay 2x more and get 2x the performance, so the actual cost wouldn’t change since it would run in half the time. In that case, the bars in this graph would be flat. The only one of these that looks mostly flat is MotherDuck; not only is it much less expensive to run, but it also scales nearly linearly. So if you pay 2x more, you can run your workload roughly 2x faster.
What about BigQuery? I spent a decade of my career working on BigQuery, so it pains me more than a little bit to see it not showing up better in the results. Looking at the code for the benchmark, my guess is that if someone from the BigQuery team updated the method of running the benchmark slightly, the results would look a lot better.
This goes to show that you don’t want to put too much credence on one benchmark. After all, benchmarks are not the real world. And I think it is always more useful to benchmark against past versions of yourself; if you’re accelerating faster than everyone else, then at the end of the day, you’ll end up in first place, no matter how you measure or where you started. And this is where we can really shine.
Keep on Flocking in the Real World
At MotherDuck, we track query statistics across our fleet. Since we rolled out DuckDB 1.4 a few weeks ago, we’ve been looking at the before and after performance to determine, in the real world, how much faster DuckDB 1.4 has gotten. And it is a lot.
We looked at a sample of around 100 million queries from before and after we released the new DuckDB version on our servers. We compared the performance of successful queries from paying users running in our cloud-hosted DuckDB instances.
The results are summarized below, with all times in seconds.
| average | median | 90%-ile | 99%-ile | 99.9%-ile | 99.99%-ile | |
|---|---|---|---|---|---|---|
| DuckDB 1.4.x | 0.42 | 0.011 | 0.342 | 5.47 | 43.53 | 283.69 |
| DuckDB 1.3.x | 0.50 | 0.011 | 0.375 | 6.22 | 51.94 | 412.22 |
| % change | 19% | 0% | 10% | 14% | 19% | 45% |
The average query got 19% faster. Of course, the average tends to be dominated by slower queries. The median query wasn’t faster but the median queries were already only 11 milliseconds; there wasn’t a whole lot of point in making them faster. Where you really start to see major improvements is when you look at the higher percentiles: the 99th percentile query got 14% faster, and the 99.99 percentile query got 45% faster.
This is all amazing news for users of DuckDB and MotherDuck, because typically, user experience is driven by the slowest queries. Most people won’t really notice performance improvements when queries are already under 100 milliseconds or so. But if one of your queries takes 4 minutes instead of 7, that’s a big difference.
Another way of looking at query performance is to ask, “What percentage of queries appear to be instantaneous?” Human reaction time is around 200 ms, so queries faster than that appear to be instant. When running DuckDB 1.3 on MotherDuck, 94% of queries were sub-200 ms. With DuckDB 1.4, more than 96% of queries were under 200 ms. This means that there was a 1/3 reduction in the likelihood a user had to wait for a query, and 24/25 of all queries appeared to be instantaneous.
The Pond Ahead
At MotherDuck, we strive to increase value for our customers; they get value when they can do more work faster for less money. In the last few weeks, their queries have taken less time to run, and in particular, their slowest ones have been a lot less slow. People have had to do a lot less waiting for queries to complete. This means they can spend more time figuring out what kinds of queries to run, or what to do with the results.
The exciting thing is that these improvements aren’t a one-time event; every release of DuckDB has both a bunch of new features as well as improved performance. That makes MotherDuck better and faster, too. We estimate that since DuckDB 1.0, MotherDuck performance has doubled. While we still believe that performance should not be the only criterion you use to choose a database, it certainly helps when your database keeps getting faster.
Start using MotherDuck now!
PREVIOUS POSTS
2025/10/08 - Mehdi Ouazza
Why Python Developers Need DuckDB (And Not Just Another DataFrame Library)
Understand why a database is much more than just a dataframe library

2025/10/09 - Alex Monahan, Garrett O'Brien
DuckDB 1.4.1 and DuckLake 0.3 Land in MotherDuck: New SQL Syntax, Iceberg Interoperability, and Performance Gains
MotherDuck now supports DuckDB 1.4.1 and DuckLake 0.3, with new SQL syntax, faster sorting, Iceberg interoperability, and more. Read on for the highlights from these major releases.