The agents have arrived in the data-verse, and there is no going back. The argument about whether business users will ever be able to meaningfully get answers to data questions on their own is over. (Spoiler alert: they can!) The age of self-service analytics is already here. As they say, the future is already here, it just isn’t evenly distributed.
Today we released what we’ve been calling the MotherDuck Answering Machine (you get it: a machine that answers queries!). It is an MCP server, which is probably the dullest way to describe something so surprisingly delightful. It lets you ask questions about your data from within Claude, Gemini, or ChatGPT and get high-quality answers.
You don’t need to know any SQL. Maybe you don’t even feel comfortable writing Excel formulas. It doesn't really matter…English (or, most likely, any other well-recorded human language will do; sorry, Klingon and Dolphin are not supported) is all you need. The only thing you have to do to set it up is to add the MotherDuck connector endpoint (https://api.motherduck.com/mcp) to the connector settings in your favorite LLM client (Claude, ChatGPT, or Gemini); then you can start to teach their chatbot and built-in agent to understand your data. That’s it!
It… just... works…
You might be skeptical. When I first started playing with the MCP server, I was skeptical, too. I thought it was going to be interesting for small, well-curated datasets, but not super useful for real-world data. Literally four minutes after we enabled this in our Claude account, after playing with it against our real-world, messy, internal data warehouse, I sent a Slack message to the team:

I asked Claude a couple of questions about our business tier users and revenue, and with no additional context provided, it gave the right answers. More surprisingly, it went beyond what was asked for to provide additional analysis. I was stunned.
Let’s try it out on a new question and see it in action. This morning I was on a plane, waiting to take off, so I was using Claude on my phone. I asked it:
Can you use MotherDuck to find out how customer usage varies by day of the week? How much of an impact do US holidays have?
My spelling on my phone isn’t great, but Claude didn’t judge me. I should also note that this information isn’t trivially available in our data warehouse, and we didn’t do anything at all to make our data easy to query. We have very good data engineers, but there are still awkward irregularities, ambiguous fields, vestigial table names, and other trappings of a data warehouse in the real world.
I won’t include the full transcript of the agent because it is fairly long, but it basically followed the path that a human analyst would take when being presented with an unfamiliar dataset. First, it looked at the databases I have attached in my MotherDuck account. They all have reasonably cryptic names, but it figured out that the one called ‘mdw’ is the MotherDuck data warehouse:
I see the "mdw" database, which looks like it might contain MotherDuck warehouse data. Let me explore its tables.
It then checked the tables, figured out that there are some that look like they are useful for finding usage information, and dug into the columns. Note that if we had added comments to the schema, we could have provided additional help, but we didn’t, because, well, we haven’t gotten around to it.
It showed the weekly patterns and impact of US holidays, which it was asked to do, in a detailed way. It then summarized the results with the following insights:
- Strong workweek pattern: Usage peaks mid-week (Tue-Thu) and drops ~20% on weekends
- Holiday impact varies significantly: Summer holidays (Memorial Day, July 4th, Juneteenth) see 30%+ drops, but Thanksgiving week is surprisingly busy
- Overall holiday reduction: Across all holidays, you see an average 8.6% reduction in active organizations and 16.3% reduction in query volume
- Weekends remain active: Nearly 80% of weekday organization count still use the platform on weekends, suggesting significant 24/7 data workloads
I was a little bit surprised by the Thanksgiving result. I know that we saw a usage dip on Thanksgiving. So I asked:
What if you filter it to only paying users? Is there a way to display the results visually?
First, here is the graph it showed for day-of-week impact for paying users:
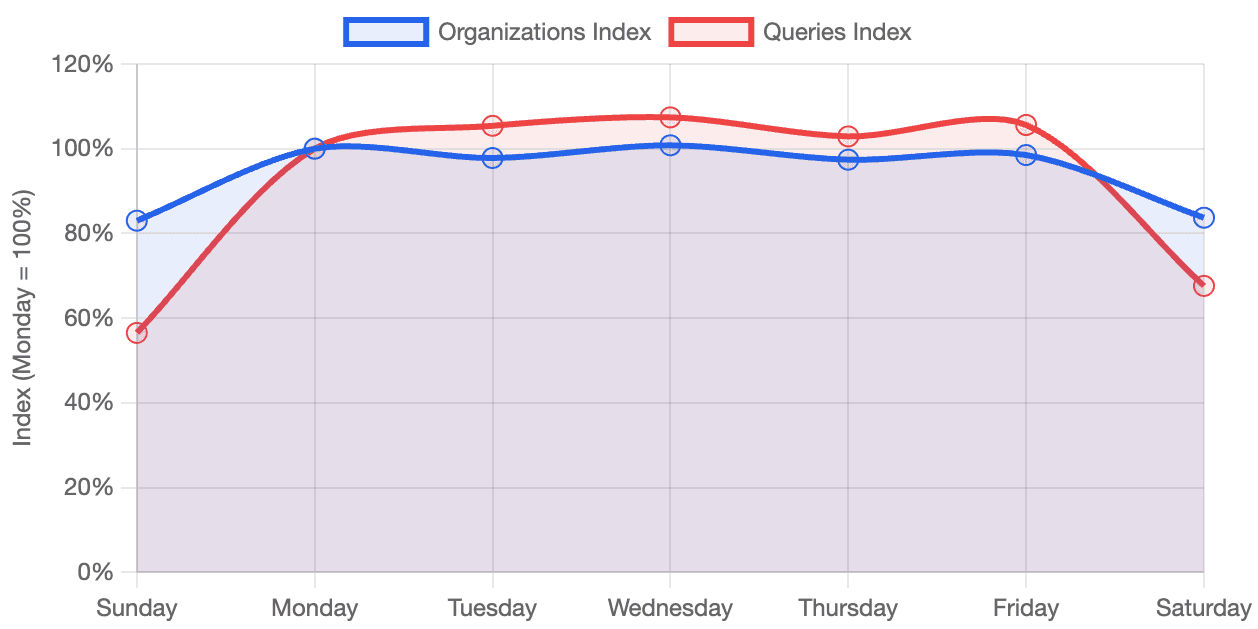
On the question of holiday impact, there was another surprise; it said: “Holiday Impact: Virtually Zero”. However, when you think about it, it makes sense; it was reporting the number of orgs, and most paying orgs have automated ingestion processes that run every day. So the “daily active” count wouldn’t really be impacted.
Of course, Claude figured that out, too:
This [the minimal holiday impact of paying users] contrasts sharply with all users (which showed -8.6% on holidays), suggesting that:
1. Automated/production workloads dominate paying customer usage
2. Data pipelines don't take holidays
3. Free users are more likely to be individuals/students who do take holidays off
This is pretty remarkable; it doesn’t just report the findings, it also comes up with reasonable hypotheses about the results.
I also asked Claude to investigate the intensity of usage (without defining what that meant) on the holidays, and Claude noted that there was more ingestion traffic on the holidays, as noted by the increased HTTP reads, which indicate the data comes from an external source. This is something that we hadn’t noticed.
So with a couple of very basic prompts and essentially no pre-work, we’re getting insights that we humans poking at the data with SQL queries and BI dashboards had not noticed on their own.
So you want to talk to your data?
Stepping back a bit, the skepticism that data people have about natural language queries comes from a long history of false hopes about the ability to bring self-service analytics to the Excel-wielding masses.
More than a decade ago, ThoughtSpot burst on the scene with natural language-based BI. They had demos that were mind-blowing. Data nerds all over thought, “You can just talk to your data? That’s like some Star Trek shit!” I was at Google at the time, and we quickly spun up a team to add similar support in BigQuery. Meanwhile, a handful of other startups sprung up trying to apply natural language to data.
The problem was that despite some cool-looking demos, it was hard to make this work in the real world. The state-of-the-art Natural Language Processing wasn’t quite there; you had to ask some pretty well-constrained questions. It could kind of, sort of work with small, well-manicured datasets. But the preparation needed to set things up and make it work well made it hard to generalize to large data warehouses, which are full of weird data points, ambiguous tables, and echoes of past data bugs.
LLMs and the rise of Text-to-SQL
After ChatGPT came out in late 2022, the Natural Language part was solved. Large Language Models (LLMs )could do magical things, turning human text prompts into code. It was exciting enough for me to spend a long weekend writing my first DuckDB extension to send analytical prompts to OpenAI to write queries. With a simple table function, you could turn text into a SQL statement, or if you were feeling lucky, skip right to the results. Magic!
Unfortunately, while the results were initially promising, it was still demo-ware. So while we’d solved the ability to turn text into some kind of SQL, there was still something missing. AI was pretty good at guessing which columns to use, which filters to apply, and which tables to join, but if you’re going to make decisions based on your data, you need to do better than guess. On benchmarks, the best models were right about 80% of the time. That’s not nearly good enough to trust with your business decision-making.
It became clear, however, that the gap wasn’t because the models weren’t good enough. Models were getting better fast, but waiting for OpenAI or Anthropic to come out with a bigger, better model wasn’t going to help. If you poke at the problem, it turns out that the art of data analytics with real data sets involves a lot of things that are institutional knowledge. Special incantations that the data teams know about, but are just not present in the data or metadata. You need a way to understand the irregular things in the data, as well as the conventions in the organization.
As a simple example, if you ask to show results broken down by quarter, how does the model know whether to use a fiscal quarter or a calendar year? Or trying to calculate recognized revenue, taking into account customers on different payment plans, with different currencies, different discounts, promotional credits, refunds, taxes, etc is impossible without understanding core business logic that translates how data is recorded in the database to how the data needs to be used. Moreover, the model may also need to take into account bugs that have crept up over time but were never corrected, like where some data got double-ingested, or some other data was missing.
Semantic Models are Not Enough
The “obvious” answer to these problems was semantic models, which can provide a translation layer between the physical data stored and the “semantics,” or what the data actually means.
In the past couple of years, semantic models, having hovered around the periphery of the modern data stack, seemed finally poised to become highly relevant. After all, if you build a semantic model describing your dataset, specify how the tables join together, and encode your business logic as metrics, you can provide enough context so the LLM can figure out how things actually work.
I should also mention that I’ve been a proponent of semantic models since I was at Google. I helped to make the case to acquire Looker, in large part because of their semantic model, LookML. I was following the Malloy project closely, and that was one of the key things that led me to DuckDB. I’ve even applauded Snowflake’s attempt to create an open semantic model standard.
However, despite their promise, semantic models have not taken off the way people had hoped. If they were really going to bridge the gap to self-service analytics, you’d expect them to be adopted much faster. There are both technical and organizational reasons for this. The technical problem is that LLMs don’t really know how to write semantic modeling code. There is a decent amount of it that exists, but there isn’t nearly the breadth of examples to train on that there is for something like Python or even SQL.
The organizational problem is just as much of a blocker. It is hard to get people to build databases well and keep them up to date. Databases rely on having someone whose job it is to maintain them, and it is easy for them to get stale or inaccurate. They often don’t integrate with all of the tools that the organization uses, which means that information needs to be duplicated in other locations, which undermines the “write it once and use it everywhere” idea.
What would the data analyst do?
Let’s say a new human analyst joined your data team. What would they do? They’d read docs, look at existing queries, and talk to people. The primary technique they would use to understand the data would be to actually run some queries. What is actually in this table? Is it up to date? They’d try things, look at the results, and then if the results didn’t look right, they’d adjust. The customer id, is that a GUID? Is that the same thing as the billing table? Does it look like the products tables are using Slowly Changing Dimensions? If so, which type?
If you then asked the new analyst a question, like, “How is this customer’s usage ramping? Does it look like they’re going to exceed their credits?”, how would they solve the problem? They’d probably start by writing some small queries that pulled pieces they needed. The first part might figure out how many credits the customer has. The second part might be to look at their usage over time. They might realize that patterns were cyclical every week, so the usage should be smoothed out. Then they’d join the usage to the credits. And finally, they might plot a trend line to understand usage.
It turns out that we were thinking about the problem of using natural language to query our data the wrong way around. We’ve been making an assumption that the LLM is going to need to one-shot the problem; that is, you ask a question, it figures out the perfect SQL, and then runs it. After all, this tends to be how things like GitHub Copilot work; if you ask an LLM to write a function to compute a CRC32, you expect it to just work.
Hello, Mr. Anderson
“But wait,” you say, “it is all agents these days!” When I asked Claude Code to build me an app, it didn’t just spit out the code; it tried a bunch of things, it wrote some tests, ran those tests, tried some things that didn’t work, but tried some others that did, and finally gave me something that wasn’t beautiful code but solved the problem asked of it.

So why are we still trying to one-shot our SQL statements? What if we took an “agentic” approach? What would that look like? Well, to start, an agent could follow the same approach as a human analyst. You point the agent at your docs, whatever you have, in whatever format. The agent would also probe the tables to try ones that looked reasonable. They’d run some queries to see what the tables actually contain. Maybe the documentation would have some sample queries; the LLM can crawl the docs and build on those examples.
The agent will write some SQL, but will also inspect the output. Does it look right? Is the last day cut off because the data isn’t complete? Is there an unexpected gap? Or does it look like this table wasn’t updated recently? It can then continue to iterate until it has an outcome that both seems like it should work and also passes a sniff test.
Analytics Secret Agents

I showed earlier that I was able to get some really good results armed with just Claude and the MotherDuck MCP server, but I don’t exactly qualify as non-technical. What if we gave it to our sales force?
Logan Toskey leads our west coast sales team. I’m not sure he has ever written a SQL query. Here is what he said based on his first five minutes:
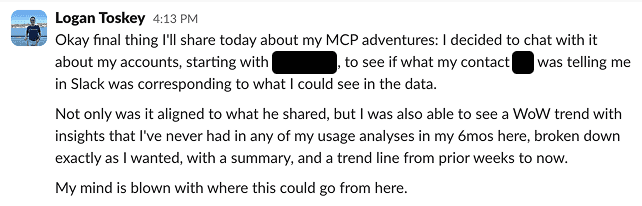
In the week or so we’ve had this ability internally, several folks have picked it up, including one of our product managers. She’s helping us “end-of-life” some very old DuckDB versions that, unfortunately, some of our customers and partners are still using. With a couple of minutes’ interaction with Claude, she built a dashboard showing which customers were still using antique versions of the DuckDB client:

This would have been the work of a couple of hours and would have involved a lot more thinking, if not for Claude’s analysis and, might I add, well-designed dashboard artifact.
Looking Ahead
Is this perfect? No, obviously. Are there problems? Yes, of course. Can it hallucinate? Yes, of course. But it also has a bunch of internal checks, like, “Does it look right?” It gets the answer right a lot more than I expected. And there are plenty of opportunities to make it work better, like adding a knowledge base about the local business logic.
Given this experience, my feeling is that something has changed. Agents, when given access to a query engine and some thoughtful guardrails, work really freaking well. It works on real-world data. It works when driven by semi-technical people who don’t know how our data warehouse is laid out. It can handle things that often fool human users. And it can analyze and help unpack not just the “what” but the “why.”
Seeing is believing; until a week ago, I thought that the data industry was going to be largely immune to the AI-induced transformations taking place in other areas of technology. After seeing that it was a lot easier for me to write English descriptions of what I wanted than to write the SQL, and that non-technical members of our team were able to get great results themselves, it is clear that this is something new.
I estimate that things are going to start moving quickly once people realize what is possible when the agents already built into your favorite chatbot start doing analytics on your data. At MotherDuck, we’re buckling up and looking forward to the ride. We hope you’ll come with us; head over to our documentation to get started.
Start using MotherDuck now!