The future of BI: Exploring the impact of BI-as-code tools with DuckDB
2023/12/18Featuring:The "BI as Code" movement applies software engineering practices like version control and automated testing to analytics, solving the rigidity of traditional UI-driven BI tools. This guide explores how MotherDuck and DuckDB provide an ideal data backend for BI as Code and offers a hands-on comparison of three popular BI as Code tools: Evidence, Rill, and Streamlit.
Developing and maintaining analytics dashboards can be painful. Your data lifecycle (ingestion, transformation, and storage) might be running smoothly, but the final step often introduces human error and technical debt through traditional, UI-driven business intelligence (BI) tools.
What if we treated dashboards like any other software asset? That's what "BI as Code" does.
BI as Code defines every component of the analytics process in source code, from data transformation to visualization. Unlike traditional BI tools that rely on proprietary drag-and-drop interfaces, this code-first approach enables versioning, collaboration through Git, and automated testing.
In this guide, we'll explore why DuckDB and MotherDuck power this movement effectively. Then we'll get hands-on, comparing three popular BI as Code tools (Evidence, Rill, and Streamlit) by building the same dashboard with each.
The Pain of Point-and-Click Analytics
Data engineering has seen significant advancements, yet the analytics chain hasn't always kept pace. Business analysts typically extract data from a warehouse and build dashboards using UI-driven tools like Tableau or Power BI.
While these tools lower the technical barrier to entry, they weren't designed with a developer's workflow in mind:
- Versioning and Rollbacks: Rolling back a change made in a complex UI isn't straightforward. Viewing the history of a chart's definition requires workarounds.
- Testing and Environments: A dashboard presenting key business KPIs is a critical software asset. Testing and promoting this asset through staging and production environments is cumbersome and error-prone in a point-and-click world.
- Collaboration and Code Review: Git-based workflows are the cornerstone of modern software development. Traditional BI tools don't integrate naturally with pull requests, code reviews, and collaborative branching strategies.
The BI as Code movement addresses these issues by treating dashboards as code, enabling versioning, automated testing, and integration into CI/CD pipelines.
Why DuckDB and MotherDuck are the Ideal Backend for BI as Code
BI as Code requires a data backend that's as flexible and developer-friendly as the tools themselves. DuckDB and MotherDuck excel here.
1. The Local-First Advantage with DuckDB
DuckDB is an embedded, in-process OLAP database perfect for local analytics. It's incredibly easy to install (pip install duckdb) and requires no external dependencies. This approach dramatically shortens the development loop. You can do everything locally, from building the dashboard to testing queries, without relying on a cloud data warehouse.
2. The Hybrid Power of MotherDuck
MotherDuck provides a serverless, shareable analytics platform built on DuckDB's architecture. You can develop and test your entire dashboard locally against a DuckDB file, then with a one-line change, point it to your MotherDuck instance to run on scalable cloud infrastructure.
This combines the speed of local development with the power and collaboration of the cloud.
Comparing BI as Code Tools: Evidence vs. Rill vs. Streamlit
We'll compare three open-source tools that embody the BI as Code philosophy. Each has a different approach but all offer excellent support for DuckDB and MotherDuck.
- Evidence (SQL + Markdown): A lightweight JavaScript framework for building data apps. You write SQL queries inside Markdown files and use pre-built components to render charts and text. The final output is a static website that can be hosted anywhere.
- Rill (SQL + YAML): An opinionated framework from Rill Data for creating dashboards from metrics defined in YAML. It comes with a convenient CLI for local development. Fun fact: Rill itself is built using DuckDB.
- Streamlit (Python): A popular Python framework for building data apps. It allows you to stay entirely within the Python ecosystem, using familiar libraries like Pandas to create interactive applications.
Hands-On Lab: Building a PyPI Stats Dashboard, Three Ways
We'll build a simple dashboard to visualize PyPI download statistics for the duckdb package. We'll use a local duckdb_stats.db file for development. You can find all the code and data for these examples in this GitHub repository.
For each tool, we'll walk through setup, data connection, visualization, and deployment.
1. Evidence: The SQL and Markdown Approach
Evidence is perfect for those who think in SQL and want to quickly create beautiful, static reports.
A. Setup & Project Structure
You can bootstrap an Evidence project with a single command. The Makefile in our demo repo simplifies this process to:
Copy code
# Install dependencies
make evidence-install
# Run the local development server
make evidence
The project structure is simple:
pages/: Contains your Markdown files, where each file becomes a page in your app.evidence.plugins.yaml: Manages plugins and component configurations.
B. Connecting to DuckDB & MotherDuck
Once the local server runs, you can configure your data source in the settings UI at http://localhost:3000/settings.
- For Local DuckDB: Provide the path to your
.dbfile. - For MotherDuck: Select DuckDB, and in the "Filename / DSN" field, enter your MotherDuck connection string:
md:?motherduck_token=YOUR_TOKEN_HERE.- Note: For production applications, manage credentials like your MotherDuck token using environment variables or a secrets manager rather than hardcoding them in your connection string.
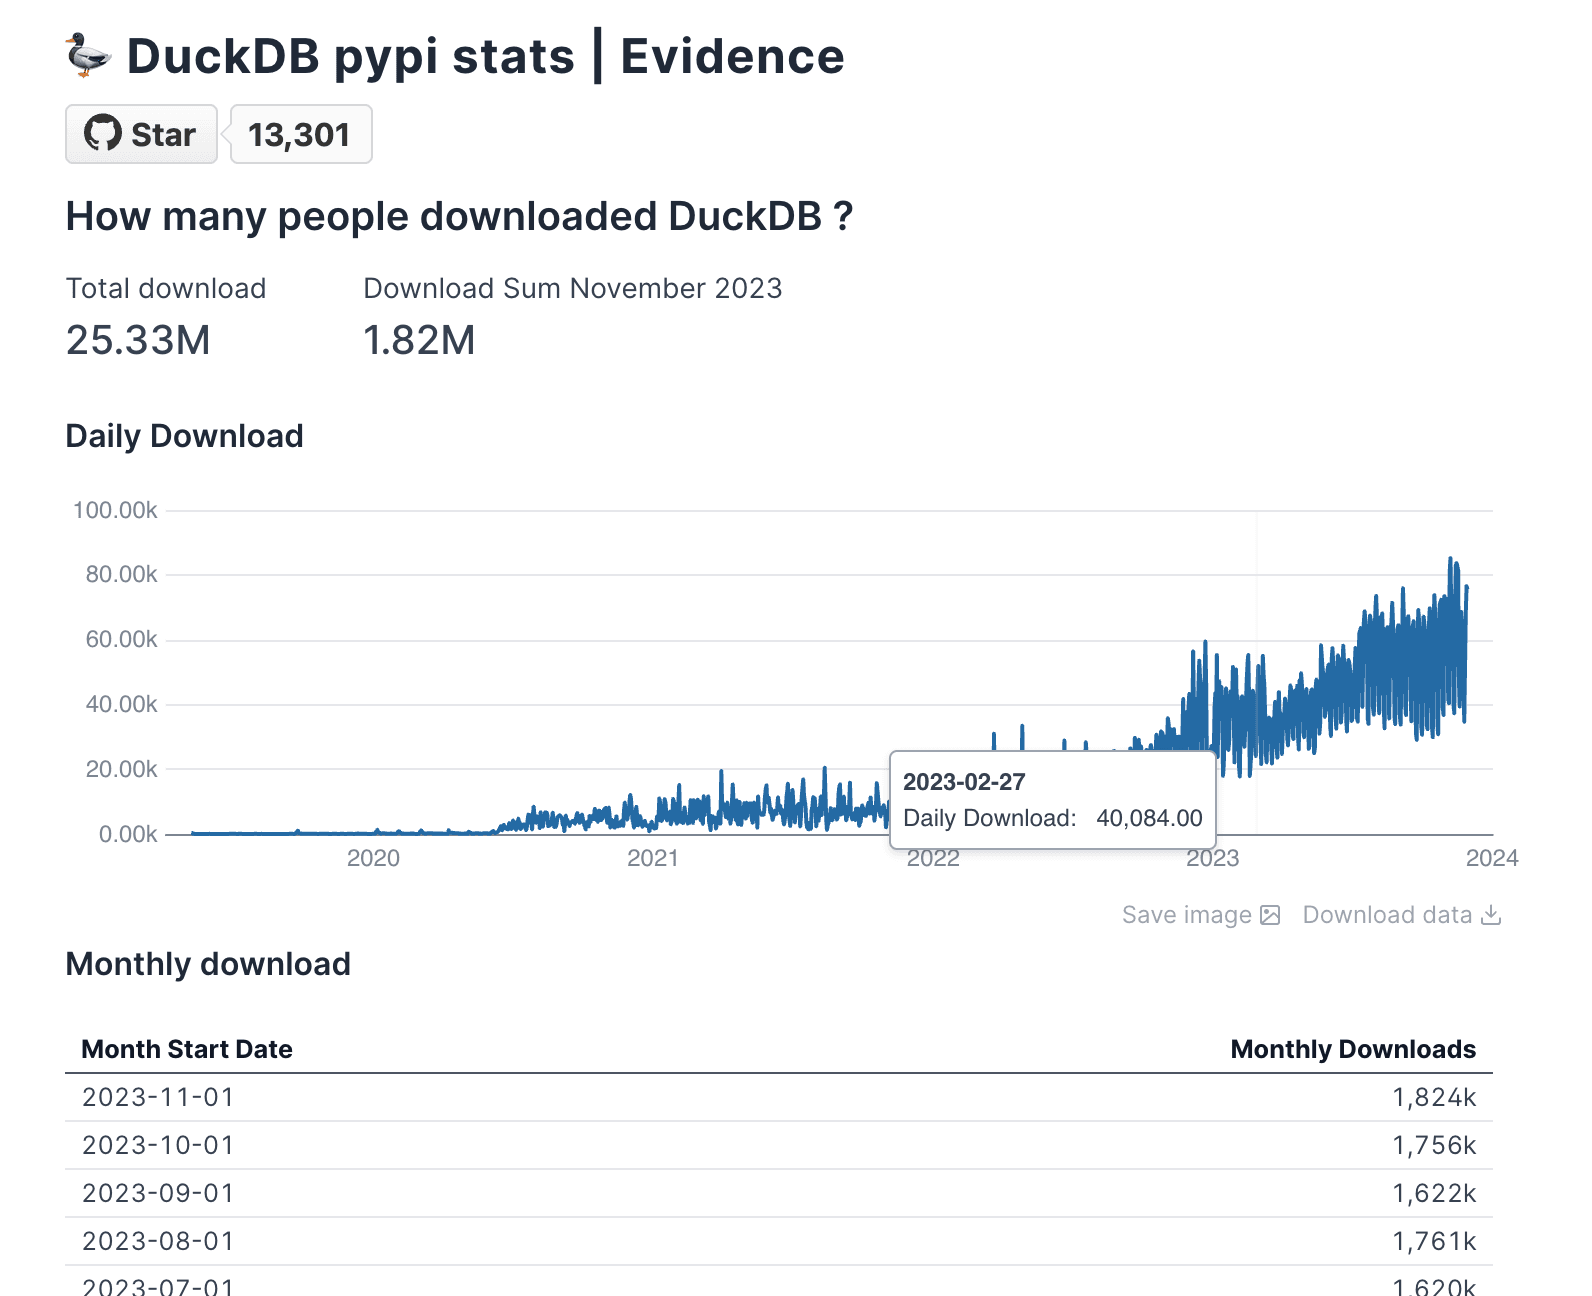
C. Creating a Visualization
In Evidence, you embed SQL queries directly into your Markdown files using fenced code blocks. You then pass the query result to a component.
Here's how to display the total download count and a line chart in pages/index.md:
Copy code
---
title: DuckDB pypi stats | Evidence
---
## How many people downloaded DuckDB?
<BigValue
data={total_downloads}
value='download_count'
fmt='#,##0.00,,"M"'
/>
### Daily Downloads
<LineChart
data={daily_downloads}
y=daily_download
x=timestamp_day
/>
```sql total_downloads
SELECT SUM(daily_download_count) AS download_count
FROM daily_stats
Copy code
SELECT
SUM(daily_download_count) AS daily_download,
timestamp_day
FROM
daily_stats
GROUP BY
timestamp_day
ORDER BY
timestamp_day DESC;
The <BigValue> and <LineChart> components automatically render the data returned by the total_downloads and daily_downloads SQL queries.
2. Rill: The Opinionated Metrics Framework
Rill provides a CLI and an opinionated structure for turning SQL queries into fast, interactive dashboards.
A. Setup & Project Structure
Rill uses a single Go binary for its CLI. The demo repo's Makefile handles the installation.
Copy code
# Install the Rill CLI
make rill-install
# Start the local development server
make rill
This command starts the Rill UI and points it to our local DuckDB database. The project structure is organized into:
sources/: YAML files defining your data sources.models/: SQL files that transform your source data.dashboards/: YAML files that define the metrics and dimensions for your dashboard.
B. Connecting to DuckDB & MotherDuck
- For Local DuckDB: Start Rill using the command
rill start rill/rill-project. Then, in the web interface, add theduckdb_stats.dbfile location as a source. - For MotherDuck: Set an environment variable with your token before running
rill start:export MOTHERDUCK_TOKEN=<YOUR_TOKEN>. Rill will automatically detect and use this token.
C. Creating a Visualization
First, we create a "model" to expose our table to Rill. This model is a simple SQL file, models/model.sql:
Copy code
select * from duckdb_stats.main.daily_stats
Next, we define the dashboard in dashboards/model_dashboard.yaml. Rill automatically generates a dashboard based on the measures (aggregations) and dimensions (group-by columns) you specify.
Copy code
# Visit https://docs.rilldata.com/reference/project-files to learn more
title: Pypi Download Stats
model: daily_stats
timeseries: timestamp_day
measures:
- label: Total Downloads
expression: sum(daily_download_count)
name: total_records
description: Total number of records present
format_preset: humanize
dimensions:
- name: python_version
label: Python_version
column: python_version
- name: system_name
label: System_name
column: system_name
Rill uses this definition to create a full-featured dashboard with a time-series line chart, leaderboards for each dimension, and filtering capabilities, all without you needing to configure individual components.

3. Streamlit: The Python Data Workflow
For those who live in the Python ecosystem, Streamlit allows you to build data apps using pure Python scripts.
A. Setup & Project Structure
Getting started is as simple as installing the required Python packages. Our Makefile uses Poetry:
Copy code
# Install Python dependencies
make streamlit-install
# Run the Streamlit app
make streamlit
For a simple app, your entire project can be a single app.py file.
B. Connecting to DuckDB & MotherDuck
Connecting to your data is done with standard Python code inside your script.
Copy code
import streamlit as st
import duckdb
import pandas as pd
# For Local DuckDB:
con = duckdb.connect(database='duckdb_stats.db', read_only=True)
# For MotherDuck:
# con = duckdb.connect(database='md:?motherduck_token=YOUR_TOKEN_HERE')
# Note: For production applications, manage credentials
# using Streamlit's secrets management or environment variables.
C. Creating a Visualization
The workflow is straightforward: query data into a Pandas DataFrame, then pass that DataFrame to one of Streamlit's many charting or display components.
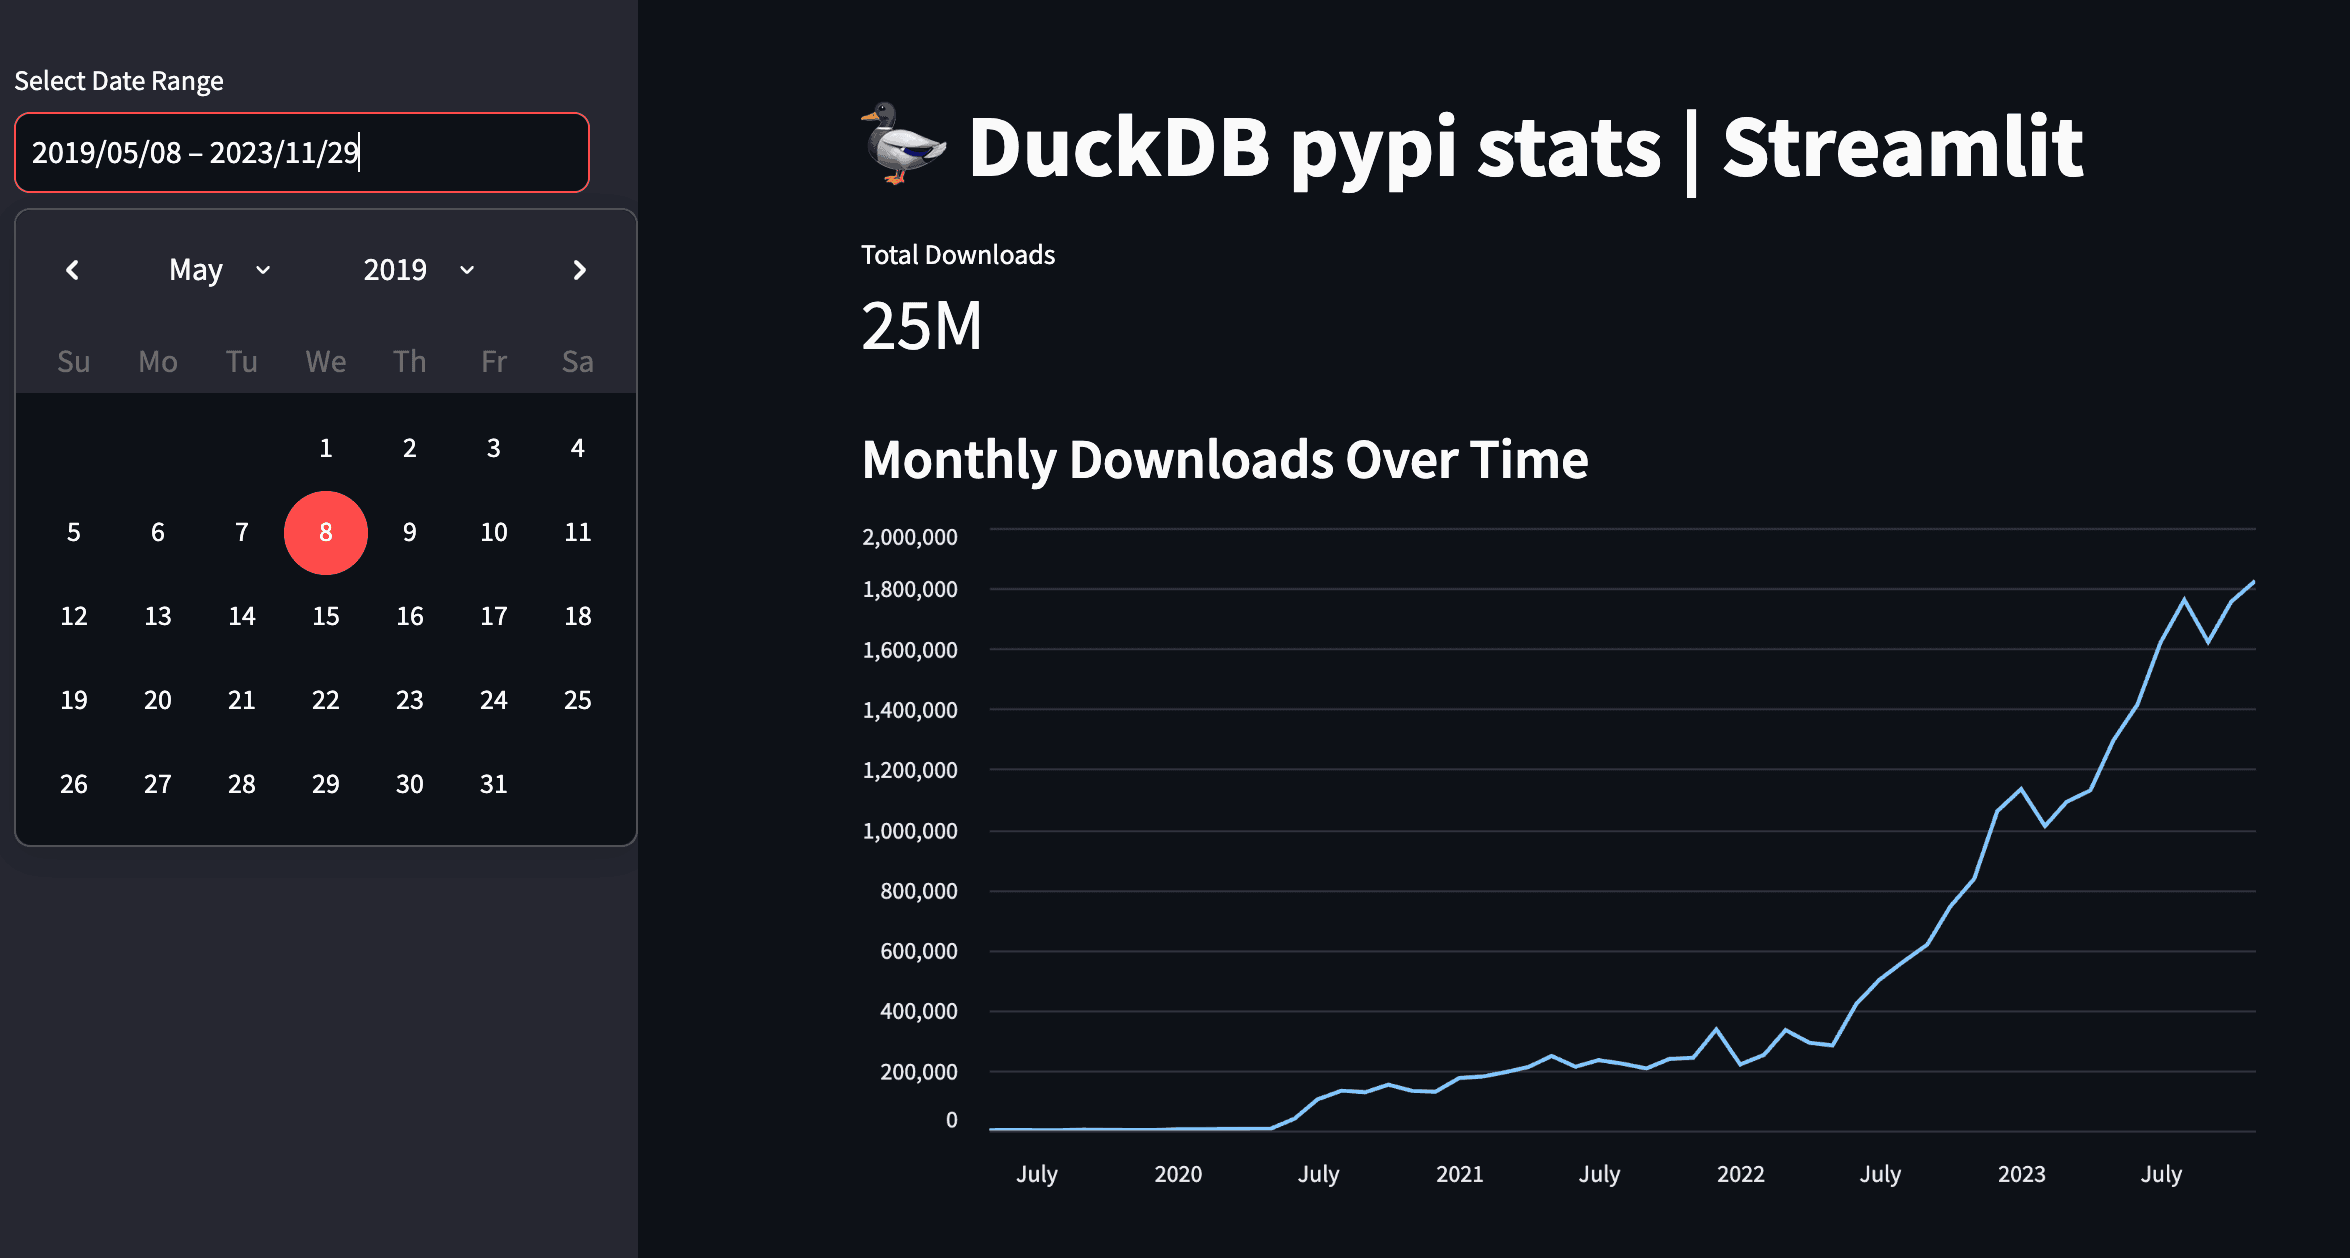
Here's the code from streamlit-demo/app.py to show the total downloads metric and a monthly line chart:
Copy code
import streamlit as st
import duckdb
import pandas as pd
# Connect to your DuckDB database
con = duckdb.connect(database='duckdb_stats.db', read_only=True)
st.title("DuckDB pypi stats | Streamlit")
# Query for data (simplified)
query = "SELECT timestamp_day, daily_download_count FROM duckdb_stats.main.daily_stats"
df = con.execute(query).df()
# Total Downloads Metric
total_downloads = df['daily_download_count'].sum()
st.metric("Total Downloads", f"{total_downloads / 1_000_000:.2f}M")
# Line Graph of Downloads Over Time
st.subheader("Monthly Downloads Over Time")
# Resample data by month for the chart
df['timestamp_day'] = pd.to_datetime(df['timestamp_day'])
df_monthly = df.set_index('timestamp_day').resample('M')['daily_download_count'].sum().reset_index()
st.line_chart(df_monthly, x='timestamp_day', y='daily_download_count')
This approach gives you the full power of Python to manipulate data before visualization.
Conclusion: The Future of Analytics is Code-First
We've explored three powerful tools that each offer a unique, developer-centric approach to BI as code. By embracing these workflows, your analytics dashboards become first-class software assets. You can use Git for version control and collaboration, implement CI/CD for automated testing and deployment, and manage your dashboards with the same rigor as your application code.
BI no longer has to be a tedious series of clicks in an expensive UI. With the local-first speed of DuckDB and the hybrid power of MotherDuck, the BI as Code movement is changing how developers build and share data insights, making analytics a fully integrated part of the modern software development lifecycle.
Frequently Asked Questions
What is BI as Code?
BI as Code manages and defines business intelligence assets (like dashboards, data models, and reports) using code, rather than manual, UI-based tools. This practice allows teams to use software development best practices such as version control (Git), automated testing, and CI/CD for their analytics workflows.
Why use DuckDB and MotherDuck for BI as Code?
DuckDB offers a fast, embedded database ideal for local development, allowing you to build and test analytics dashboards without relying on a cloud warehouse. MotherDuck extends DuckDB by providing a serverless, shareable cloud platform, creating a hybrid workflow from local development to cloud deployment.
What is the main difference between Evidence, Rill, and Streamlit?
The main difference lies in their core workflow. Evidence is best for those who prefer SQL and Markdown to create static data websites. Rill is an opinionated framework that uses SQL and YAML to quickly generate interactive dashboards from defined metrics. Streamlit is a Python-native framework for building interactive data apps, ideal for those who want to work within the Python data science ecosystem.
Transcript
0:00developing and maintaining analytics dashboard can be painful while the data life cycle can be well engineered for data ingestion and transformation analytics dashboard tools aren't necessarily created with this in mind these are user interfaces with extensive clinking involved that can lead to a higher risk of human error and provides a fewer injuring options the emergence of B code tools addresses long-standing
0:28challenges that we have in this field they enable to create beautiful analytics dashboard while still embracing software engineering best practices in this video we'll first understand why these trends of bis code is happening and then we'll cover three of these tools evidence real and streamly we will also understand why duck DB plays actually a crucial role in
0:53this new paradigm of bis code so let's get started before diving into into the different tools let's take a step back to understand why such a tools are popping up well dangering has seen significant advancement yet the rest of the analytics chain often hasn't kept p and typically business analytics user extract data from data rarehouse and build their dashb using UI tools such as
1:22tblo porbi Excel un nameit and what's the issue with that well they were designed with a user interface is first Focus to lower the technical barrier to entry which is great however this approach can lead to increased technical death for instance how do you roll back a new UI dashboard or prevent it from breaking at the end of the day the
1:45dashboard that presents your kpi is a software asset too and that means you must go under testing be appropriately versate and exist in various environment including staging and production during its development stages so let's consider what some new tools offer today along with their advantages remember the choice is yours but they all share some common features they are open source
2:11needer cloudbased service for hosting and B code approach meaning you can version test it through a standard CI pipelines and they all have compatibility with both dgdb and mother duck and by the way if you're not familiar yet with dgdb I would recommend you checking first our video on tgb introduction you will feel more comfortable with the rest of this video
2:35so let's first understand at a higher level what those three tools brings to the table first evidence SQL and markdown so evidence is a lightweight JavaScript framework designed for building data apps using markdown and SQL you simply constr your dashboard using existing components and then encorporate them using SQL within your marown and you're all set the end
2:58product is the static website that can be hosted anywhere veral nly or evidence
3:04Cloud real SQL plus Yano Real by real data allows you to create dashboard using only SQL and yaml files they offer a convenient CLI to run it locally and using a local web UI to draft queries and dashboards or for deploying on their cloud and here is a fun fact real is actually built using dougb I'll put also
3:28that blog in the description if you're interested streamlit python streamlit has been in the market for quite a few years and was acquired by snowflake in 2022 the primary advantage and possibly the disadvantage of streamlit is that it allows you to stay within your python data workflow it used the same ecosystem to develop your data apps so that means
3:50you build your data apps with python and you need at the end of the day a python run time for hosting so how are these quacking so why did DB and mother duck is interesting into this B code movement while duck DP is an embedded database which is great for local analytics it's super easy to install and it enables you
4:11to lower the development loop as you can basically do everything locally building your dashboard and then push everything to the cloud when you are ready to share which is something that is a bit hard with classic dashboarding tools are they mostly relying on cloud databases for data and Cloud service for the bi tool all the dashboard that we are going to
4:33build can be run locally without any Cloud dependency all right so what are we going to build yes we'll do the same dashboard using PPI statistics data on the python package of ddb and yes I double check how to pronounce AC by pi for each project we're going to check it up the setup the project structure in
4:54connection to duck DB or mother duck creating data visualization and finally the deployment and again feel free to check out the source codes link in the description to the GitHub repository evidence so to quickly start an Evidence project as we just saw earlier you essentially need to copy a JavaScript template and you can do this either by
5:15using no GS and the digit package or their container image using the dev container feature from PS code so this will install the notes models and run a local server so let's understand the project structure and connection to ddb there are essentially three main important parts in the project that has been generated the dot evidence which is
5:36evidence configurations and Pages where we're going to write our markdown and SQL and finally evidence. plugins. which is to configure evidence plugins once the local server is running you can connect to dgdb to the UI setting page for a local ddb database you will just need to provide the path and the extension for a mother database you will
6:01need to specify your mother duck token the mother token can be easily retrieved from the web application if you have an account already otherwise just create an account it's pleasingly fast so creating visualization so what evidence do is rendering markdown files into web page and When developing the markdown file for example at page example. MD is going
6:26to be rendered at Local Host SL example evidence has a collection of components that you can check out on their website to build your dashboard you can Define your SQL query attached to these components for instance here I have a big value which is just big numbers and this is the query I'm running which is the total sum of the download of the P
6:49pii packages from De DB and that would display this big insane number that's sum up how you can create your components and of course there is much much more to it such as reusing SQL queries templating filtering but I let you dive more into their documentation let's talk about the deployment so when you generate a static website you have
7:11the flexibility to allate anywhere that support JavaScript static website so evidence also provides its own cloud service called evidence Cloud to streamline the deployment process from local to production but you can also use ntif fly or versal for hosting all right let's talk about real now by real data so for the setup we provide a common line interface which is essentially a
7:36binary written in goala so it's pretty straightforward and there is a single command line that execute the installation for you once this CI is installed real should be available in your terminal to start a new Fresh project you can do real start my real project and when you start the project it will launch a local server and when
7:57you browse to the page you will see this this you have multiple example that you can click and this will generate automatically for you yam and SQL file example for this specific topics you can click on any of those examples and it will generate yamama and SQL files attached to this specific example so let's look at the folder structure you
8:19have essentially three main part the dashboard the model and the sources in sources you define any supered Source from real using yo model will contain your SQL query that will be used in your dashboard and dashboard is where you specify your Matrix in ymo you can also edit this through the real UI coming back to our BBI stats use case since we
8:44have ddb database containing the data we can proceed as follows and we start our project we do real start the name place of the project and we pass apply DB where the path of our DU DB database is and to connect to mod deck you would need to export the mod deck token as an environment variable and more
9:06information on how to connect to mod deck in the description there is a small work around to do as of now meaning the release of this video it won't be displayed as a source table in the real UI however we can still query it in the model part so here I just have a simple query that gets my table containing the
9:28data so now that I have this we can now Define some metrics in our model dashboard. the overall goal of real is to provide you with a tate opiniated dashboard based on the Matrix you want to see rather than offering an endless collection of Shard that you have to construct yourself the deployment is done to real Cloud offering you use the
9:50CLI to publish your code under Cloud it's also Worth to mention that compared to the other Solutions will offer user access manager mement out of the box all right let's go to streamlit so for someone familiar with python getting started with streamlit is really simple all you need is a python environment and common packages like streamlit dgdb
10:14pandas and here math blot Le for the data visualization and running the app is pretty straightforward you just execute stream LS run and Target your python file for the project structure and the connection to dug DB it's also straightforward you have to free to structure your python application as you see fit however for beginners everything can be contained into a single script
10:37and connecting to duck DB or mod duck is the standard python way so I would refer you to Ed or getting started video guide or mod duck documentation but basically quickly for local connect to our PBI stats dgdb database you just use the following you import TB create a connection and you specify the PA of your ddb database and finally to connect
11:02to mod de you will have to add your token so creating realizations so streamlit offer a vast array of competent including interactive features for audio video or llms among others we
11:17are only scratching the surface here the library is pretty big the general strategy involves using a bnda data frame and in our case here we're going to use the building chart uh from stre so let's build the pandas data frame first and as you can see dgb supports natively conversion of result to pandas data frame so pretty straightforward to
11:39get that up running and here is our first chart it's a line graph of number of the loads over time and as you can see I'm just passing to this chart object AAS data frame with a group bu all right let's talk about the deployment so stream leads offer a community Cloud where you can deploy your app application for free since it's
12:00a python app it can works on any python runtime that allows you to expose a web service all right it's time to wrap up so we have explored three different tools that each offer a unique approach to bi as code you can conduct all tests locally and use git for Version Control and cicd for testing and deployment your
12:21dashboard can easily be deployed or rolled back all while embracing software best practices so bi doesn't have to be a tidious clickr expensive UI and it's really refreshing to see New Perspective even if those tools are still in the early stage they show great promises that's it for today keep coding keep
12:48quacking
FAQS
What is BI-as-code and why is it replacing traditional dashboarding tools?
BI-as-code is an approach where analytics dashboards are built using code (SQL, markdown, YAML, or Python) instead of point-and-click UI tools like Tableau or Power BI. This brings software engineering practices like version control with Git, CI/CD testing pipelines, and the ability to roll back changes, things that are difficult or impossible with traditional UI-first BI tools. BI-as-code treats dashboards as software assets that can exist in staging and production environments.
What are the best open-source BI-as-code tools that work with DuckDB?
Three leading open-source BI-as-code tools that support DuckDB and MotherDuck are Evidence (SQL + Markdown, generates static websites), Rill (SQL + YAML, built on DuckDB itself), and Streamlit (Python-based data apps). All three let you develop dashboards locally, version control them with Git, and deploy to the cloud. Evidence and Rill produce static or lightweight web apps, while Streamlit requires a Python runtime for hosting.
Why is DuckDB important for BI-as-code development workflows?
DuckDB is an embedded analytics database that is easy to install and runs locally, which shortens the development loop for BI-as-code tools dramatically. You can build and test your entire dashboard locally without any cloud dependency, then push to production when ready. This is a big advantage over traditional BI stacks that rely on cloud databases for data and cloud services for the BI tool. To get started with DuckDB, check out the DuckDB tutorial for beginners.
How do you connect Evidence dashboards to MotherDuck?
To connect Evidence to MotherDuck, you configure the MotherDuck token in the Evidence settings page by navigating to the data source configuration and pasting your service token. The token can be retrieved from the MotherDuck web UI under your profile settings. Evidence uses a DuckDB JavaScript client under the hood that uses the MotherDuck extension to authenticate and query your cloud data. For more details, see the MotherDuck getting started guide.
How do you deploy BI-as-code dashboards to production?
Each tool has different deployment options. Evidence generates a static JavaScript website that can be hosted on Netlify, Vercel, Fly, or Evidence Cloud. Rill has its own cloud service via a CLI publish command with built-in user access management. Streamlit offers a free community cloud for deployment, or you can host on any Python runtime that exposes a web service. All three approaches support standard CI/CD pipelines for automated testing and deployment.

Related Videos

43:41
2026-03-26
Beyond Charts: Building Interactive Data Apps with MotherDuck Dives
Learn to build interactive data apps with MotherDuck Dives. Go beyond static charts with live SQL, React components, and shareable URLs.
Webinar
MotherDuck Features
BI & Visualization

1:00:14
2026-03-11
Building an Analytics Chatbot for your SaaS app in 1 day
Learn how to build a conversational AI chatbot for your SaaS product using the MotherDuck MCP server, with scoped data access and streaming responses.
Webinar
AI, ML and LLMs
Tutorial
MotherDuck Features
2026-01-27
Preparing Your Data Warehouse for AI: Let Your Agents Cook
Jacob and Jerel from MotherDuck showcase practical ways to optimize your data warehouse for AI-powered SQL generation. Through rigorous testing with the Bird benchmark, they demonstrate that text-to-SQL accuracy can jump from 30% to 74% by enriching your database with the right metadata.
AI, ML and LLMs
SQL
MotherDuck Features
Stream
Tutorial