AI agents are now the easiest way to build a custom interactive data visualization. The flexibility is enormous and despite the name "Claude Code", coding is no longer required.
However, building a great data viz is all about feedback loops - we don't want a black box! The faster I can see the impact of my own changes, the faster I can build my visual. The easier I can inspect how the visual was built, the easier I can trust it enough to share. The quicker I can share with my teammates or customers, the quicker they can fix my flawed assumptions. We'll dig into why MotherDuck Dives and Claude Code are a great combo for solving all of those problems at once.
What you imagine is just 1 prompt away!
First, what can you build with a Dive? Definitely beautiful charts, sharp looking tables, and slick interactivity. However, the possibilities are really wild! This was built from scratch in a Dive:
This is not a pre-canned pivot table component - it is a fully custom Dive. I started by saying "I want to create a MotherDuck Dive that is an interactive pivot table experience, similar to an Excel pivot table...[plus a few paragraphs of picky specifications]". In 3 prompts I had a usable pivot table. While you may not be as crazy of a pivot table fan as I am, this goes to show that you can build a huge range of interactive user interfaces in Dives. Let's see how easy it is!
But wait, can't the Claude UI already create visuals?
Yes, Claude can build charts, but have you tried sharing them? What about finding the ones your team already built last week?
What about refreshing the data behind them? When it recreates the whole visual from scratch, did it subtly change anything? How can you inspect the logic?
And how long did it take to rebuild the whole thing? All I wanted today was to pull some new data and bump up the font size!
MotherDuck's Dives are visualizations that you build by chatting with an AI agent (of your choice!) in a natural language (also of your choice!) that are shareable and refreshable. They are powered by React and SQL, which AI agents are excellent at building these days (but you don't need to be an expert at those anymore!). We support a variety of agents including the Claude UI, Claude Desktop, ChatGPT, Cursor, Zed, and more. That means both technical and non-technical folks can make Dives! When you pick Claude Code as your AI agent, your feedback loops can be even faster.
Things we'll need up front
- A MotherDuck account
- Claude Code
- Opus 4.5+
Connecting to the MotherDuck MCP Server
The MotherDuck MCP server gives Claude the ability to understand the available data in MotherDuck, run SQL queries, and both build and share Dives. We host the MCP server on your behalf, so setup is especially straightforward:
- Tell Claude Code about the MCP endpoint by running
claude mcp add MotherDuck --transport http https://api.motherduck.com/mcp - Start Claude Code with
claude - Authenticate with MotherDuck
- Type
/mcp, select MotherDuck from the list, and press Enter - Select Authenticate and confirm the dialog in your browser
- Type
For more options when setting things up, check out our MCP docs.
Now Claude will know how to access your data and how to build Dives to visualize it.
Ask Claude to Explore
The first step in a Dive workflow is to provide Claude some context around the datasets you are investigating. This is as easy as asking a few open ended questions, one per table you are interested in:
What data is in the ambient_air_quality table in MotherDuck? Summarize it.
Claude Code will then do a few things on your behalf, asking your permission a few times during the process:
- Look for the tables you mentioned in your prompt, here the
ambient_air_qualitytable- We didn't need to specify the database name or schema, it just searched for us
- Explore those tables
- Pull a list of columns, their data types, and any SQL comments added to them
- Grab a small sample of the table
- Run some summary queries on those tables
This step hydrates Claude's context with key information about your data so that the SQL queries it writes later will be more accurate. It can also be a good first step for learning about a new dataset.
Diving in
Once Claude has some context, you can ask questions and receive a Dive visual to explore! You can be very direct, but if you leave things open ended, Claude can even explore without an explicit question to answer. All you need to do is ask for a Dive.
I want to visualize data in the MotherDuck table ambient_air_quality.Which cities in the United States have the best and worst air pollution?Create a Dive.
Claude will run a variety of SQL queries and analysis to answer the questions you posed.
Then, Claude will ask you if you want to visualize directly in MotherDuck or use a local preview. It may even begin creating a local preview automatically on your behalf! That is where some of the super powers of using Claude Code specifically come into play, so let's choose that option.
Once you confirm that Claude is allowed to make some local folders and run some npm commands, you will have a local preview environment set up. You will receive a message like this:
The preview is running at http://localhost:5177/.Open that in your browser to see the Dive with live data from MotherDuck.
So, cmd + click on that localhost URL (or ctrl + click if you are in Windows-land), and you'll have a live preview in your browser of the Dive you just created.
At any point when you are ready to publish, just ask Claude to save my Dive to MotherDuck. We will see what that looks like a little later on!
Shaping the visual
That first iteration of the Dive may be beautiful! It may answer every question you had on the subject! Usually though, seeing an initial visual compels me to adjust. I either want to improve how the story can be conveyed or I have derived some new insight into the data and want to explore in a new direction. Just ask something like:
The data looks odd in Arizona.Why does it look like that?What is different about Arizona?
This is where Claude Code shines.
Not only do you get deep analysis from Opus, but the output of each iteration is just a tweak of the existing Dive file. The preview will have already created a dive.tsx file (or similar) that includes the SQL queries needed to analyze your data, as well as the React logic for building charts, tables, and interactivity. Each change will just be a diff to that file, just like any other file that Claude Code would change. These tweaks are way faster than having to recreate the artifact from scratch.
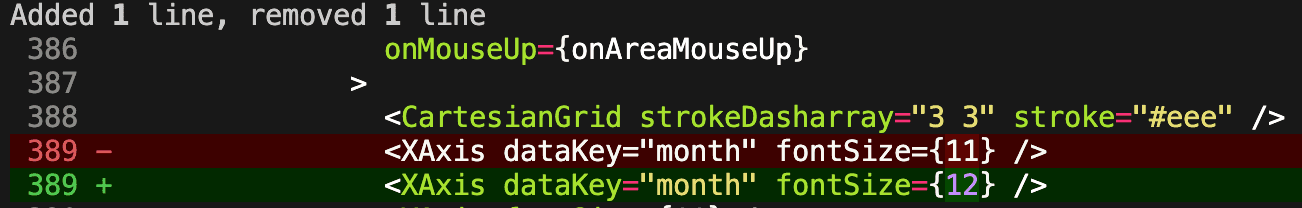
Want a larger font size? That's a 1 line diff in Claude Code, but a full re-write of the entire artifact in the Claude UI.
As a note, we are constantly improving the experience in all agents, and now previews in the Claude UI can be edited with just the diff. Once you want to publish to MotherDuck is the only remaining time the whole artifact is rebuilt!
Diving deeper into the data
The first type of change I like to ask for is around the data. Once I see high level metrics, I ask for details broken out by other dimensions. I'll often keep it open ended. Things like, "What other columns are correlated with revenue? What other interesting patterns should I investigate?"
I find myself often including both time series oriented visuals and categorical summaries since both can be useful for different purposes. Dives can use a huge range of plotting capabilities thanks to the power of Recharts and D3.
Boosting interactivity
Even beyond the charts and visuals themselves, there are so many ways to enhance your Dive. Every type of custom interaction you've seen on the web is available to you. This is a full React environment after all, not some pre-canned set of charts!
Want a drilldown to a completely different visual? Just ask Claude.
Want clicking on one chart to filter all the others? Just ask Claude.
Need to be able to zoom in or get details in a hover tooltip? Should every table column be sortable and filterable? Just ask Claude.
You can easily take this to some fun extremes. You can prompt your way to a fully functional pivot table, complete with drag and drop interactivity. Want slicers? Just ask for them! Search, filter, expand, collapse, drag, drop - the limit is only your creativity! Do you want your customer experience score to be converted into emojis? Smiles all around.
Sometimes, adding some of that interactivity will have you looping back to ask more follow up data questions, so don't save it all to the end! If clicking to drill down would speed up your investigation, ask for it early on.
Peeking behind the scenes
Explore the preview's dive.tsx file that Claude Code generated to see all of the SQL queries that power your Dive. Just look for the calls to useSQLQuery. If you have some context that Claude does not, feel free to correct it with natural language, or just go make the SQL tweak in the file directly! The preview will update live as soon as you (or Claude!) save the changes.
If you want to add some more process around your Dives, these same artifacts can be added to Git for version control too!
Once you feel confident in the logic, you are ready to publish!
Publishing to MotherDuck
Once you've completed your quick turn iterations with preview mode, you can publish to MotherDuck and share your visual to your teammates. This too is straightforward:
Claude, save my Dive to MotherDuck
Behind the scenes, Claude will double check that you are using the hooks that make your queries refreshable and that your Dive is ready to be deployed in the MotherDuck sandbox. You'll soon see a message like:
Dive saved! You can view it here:US Air Quality: Best & Worst Cities
Give that a click and you will head to the MotherDuck Web UI where your Dive will be rendered! On the left hand side, you will see a list of the Dives that you have viewed before along with your SQL Notebooks and database tables. For a full screen experience, feel free to minimize the left hand object explorer pane.
Sharing a Dive is as easy as sharing a URL. Find the Dive you want to share in the left hand object explorer pane, then click on the triple dot menu button and select "Share". Share that link anywhere your team collaborates! Once a teammate clicks on that link, they will have that Dive in their object explorer menu where they can view that Dive any time. Data will be queried live whenever they load it!
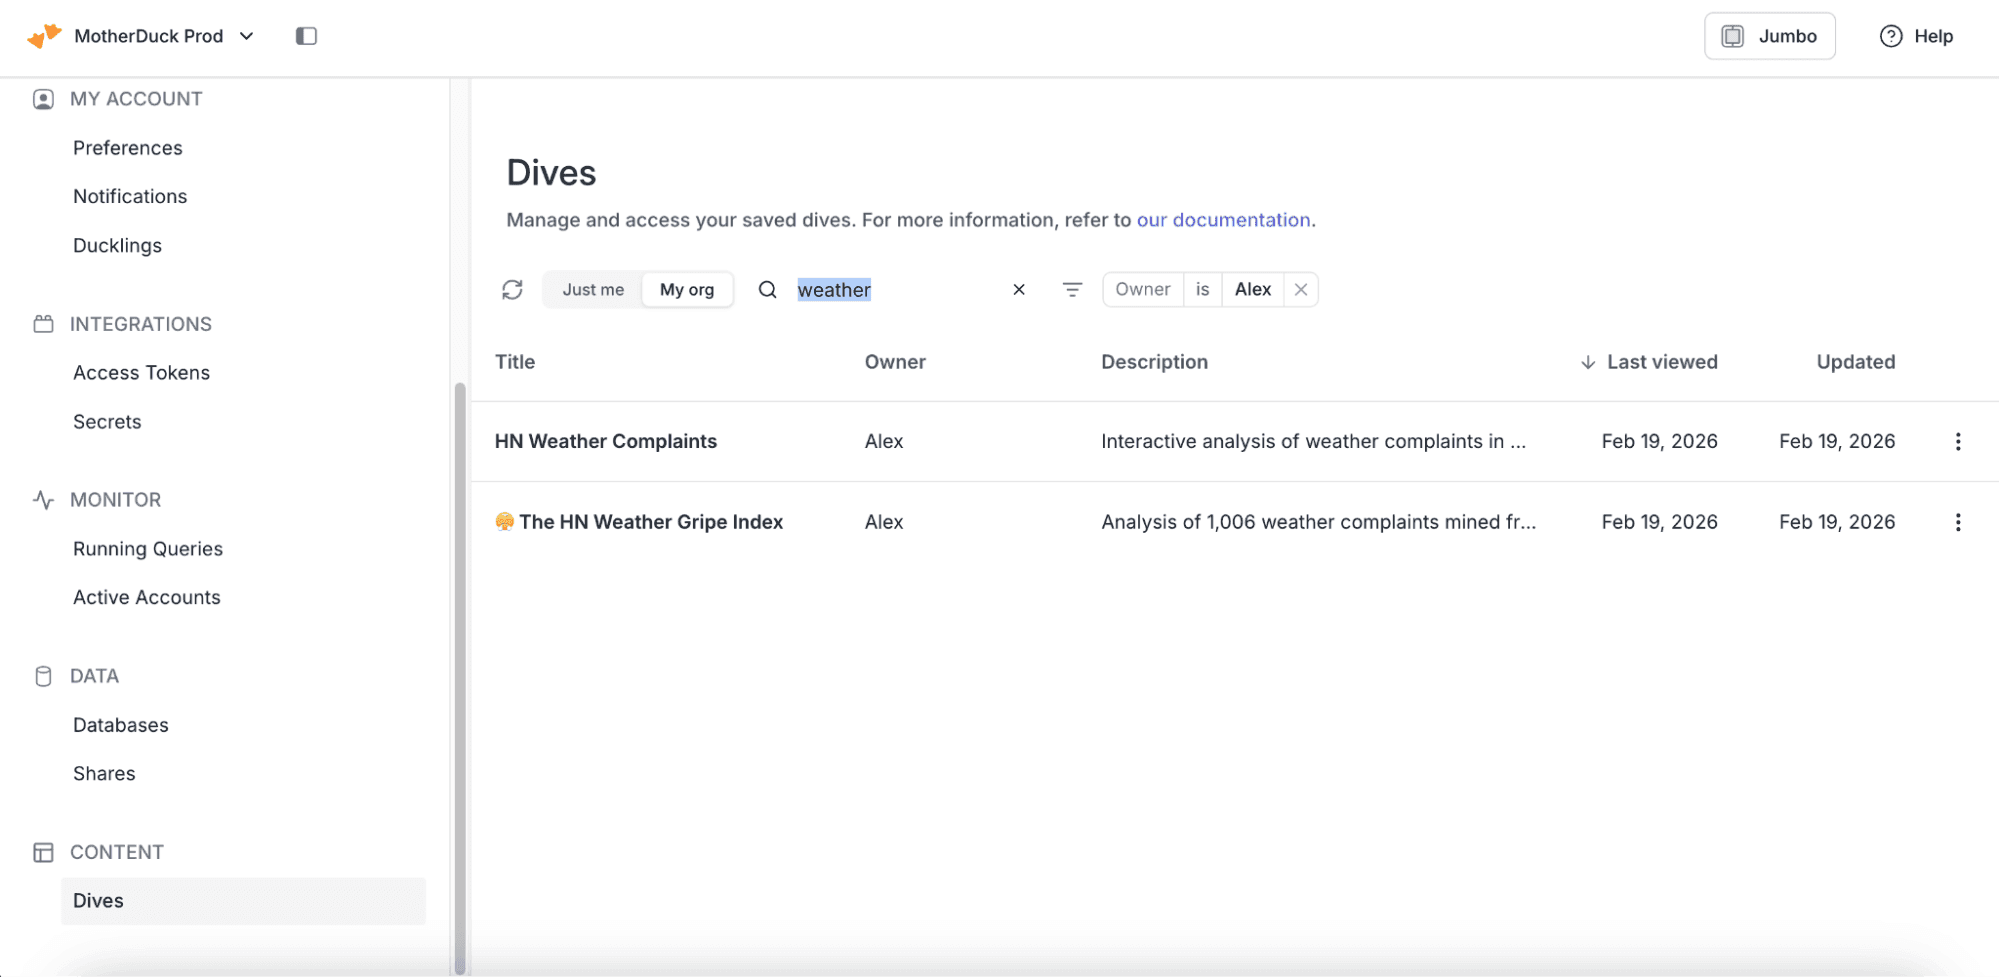
What about finding existing Dives from your team? Head over to the Dives page in Settings where you can search and filter Dives from across your organization. If you have access to the data, you will be able to click on the Dive to view it! It will automatically save to your list of Dives. You can see which Dives you have not seen before, as well as key info like how recently they were updated. Title and description are searchable, and defaults are auto-populated when the Dive is built based on an AI summary, so things are easy to find.
Make your team a Dive-ing team!
Ask Claude Code some questions in plain language and get answers to those questions and ones you didn't even think to ask. Second level questions are notoriously difficult to answer with traditional visualization tools - Dives can be as interactive as you can imagine. And Claude Code makes the iteration process fast. Easy sharing turns Dives from a single player exercise to a multiplayer collaboration.
Remember, to get the most out of Dives:
- Ask broad follow up questions about the data
- Ask for any interactivity you can dream of
- Share your Dives with a quick link
- Explore all the Dives your team is building
Get started with a free MotherDuck account, load some data, and Dive in! Bring Claude along for the swim.
Start using MotherDuck now!