If you have a website these days you might be missing out on a lot of valuable data. You used to be able to just drop a simple widget on your site and track your visitors. While the accuracy of that has steadily declined with ad blockers and legislative requirements, it has been the go to for identifying users on your website or app. Now there is a new way of interacting with your online content that doesn't care at all about your carefully crafted web analytics setup: agents. When you ask your favorite AI tool like Claude or ChatGPT to research a topic, product or site they will request purely the content of your site. Your JavaScript tracking widgets and events are never executed, tracking pixels are completely ignored by agents. Your Google Analytics, Adobe Analytics or PostHog instance has no clue a visitor has even passed by.

But not all is lost. Let me show you how to get insights into the behaviour of these agents directly into MotherDuck. If you are using Vercel, it's easy as duck. A quick warning though, we'll be drinking from the firehose, the stream of requests coming directly to your server. These requests contain a lot of information, but not all of it might be relevant to you. Many of these requests come from bot traffic (legitimate and not-so legitimate) and storing all of it for a long time can quickly add up in storage costs. I'll show you how to filter and turn the firehose into a more manageable garden hose, but make sure to apply it to your needs.
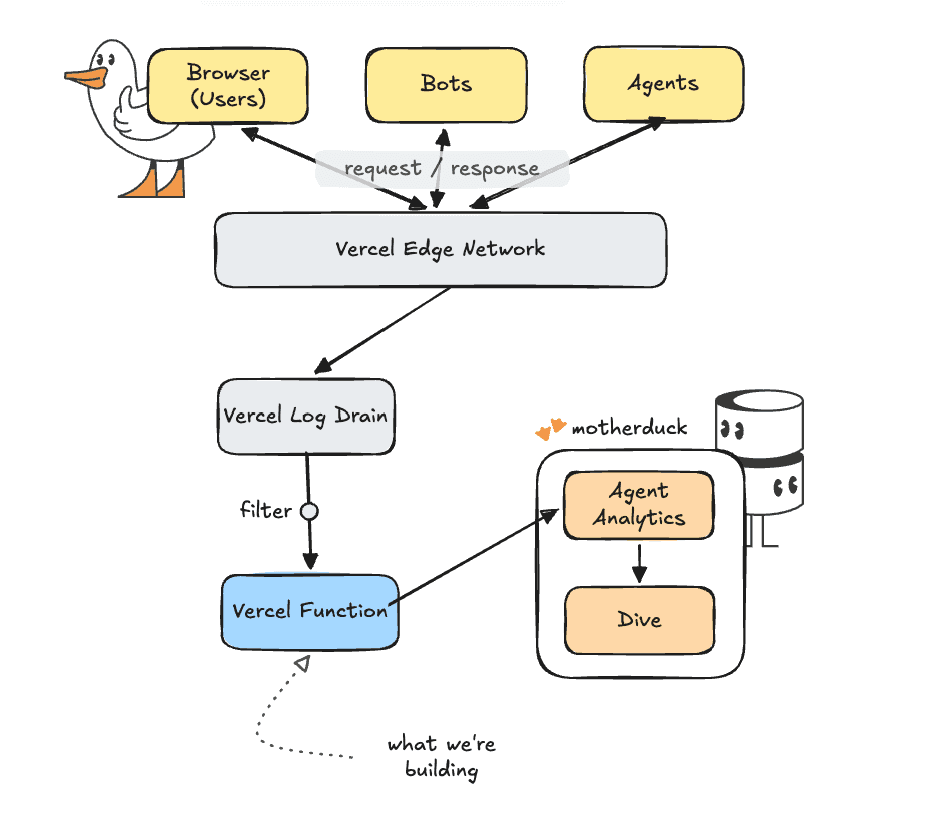
INFO: Want the code? If you can't wait to get started, here's the code in our examples repository.Architecture
For this project we will use Vercel's Log Drains. A log drain is basically a dump of raw logs to another system. Vercel handles batching and some filtering of the logs for us already.
TIP: Plan requirements Log Drains are available on the Vercel Pro plan. If you don't have that, you can achieve a similar setup by using routing middleware and calling your logging endpoint with `request.waitUntil(Our setup will be to connect the log drain of requests to a processing function in typescript that loads the batch into MotherDuck.
A word about tracking AI
There are various ways in which you can track AI. Just like for normal web analytics we can track the 'user-agent' string, the header with which a browser or other tool identifies itself to the server. There are mainly three ways in which AI can be used to access your site.
- Just like Google, the big AI labs have their own crawlers that go through the entirety of the internet and read and store the pages they come across. These are normally identified as 'bots', for example Claude will identify itself as
ClaudeBot/1.0; +claudebot@anthropic.com - Agents running on the user's behalf can make requests from ChatGPT, Claude Code, or whichever tool is being used. These agents will identify themselves with strings like
ChatGPT-User/1.0; +https://openai.com/botorClaude-User (claude-code/2.1.118; +https://support.anthropic.com/) - Users can click through from browser sessions with claude.ai or chatgpt.com. These will show normal browsers as the user-agent, but the referer header will contain something like
claude.aiorchatgpt.com. For things like referenceschatgpt.comwill explicitly add autm_source=chatgpt.comparameter to the URL as well. These should normally also show up in your web analytics since they are used in real browsers.
Let's Build
Before we connect our log drain, we need to create our processing function. The goal of our processing function is to:
- Filter out requests that are not important to us, like requests to fonts, CSS files, JavaScript files, etc.
- Classify the incoming user agents to determine if they are humans, bots or agents.
The processing function will live on its own path in our application and can be called with a POST request to my-site.com/api/drain. We start with the entry point api/drain.ts.
Copy code
import type { IncomingMessage, ServerResponse } from "node:http";
import { handleDrain } from "../src/handler.js";
export const config = {
runtime: "nodejs",
};
export default async function handler(
req: IncomingMessage,
res: ServerResponse
): Promise<void> {
if (req.method !== "POST") {
res.statusCode = 405;
res.end("method not allowed");
return;
}
// Read the incoming request (headers + body)
const rawBody = await readBody(req);
// We use the signature to make sure not everyone can just call this API randomly
const sigHeader = req.headers["x-vercel-signature"];
const signature = Array.isArray(sigHeader) ? sigHeader[0] : sigHeader;
// We use the 'handleDrain' function to process and store the logs we want
const { status, body } = await handleDrain(rawBody, signature);
res.statusCode = status;
res.end(body);
}
function readBody(req: IncomingMessage): Promise<string> {
return new Promise((resolve, reject) => {
const chunks: Buffer[] = [];
req.on("data", (c: Buffer) => chunks.push(c));
req.on("end", () => resolve(Buffer.concat(chunks).toString("utf8")));
req.on("error", reject);
});
}
Next up is the actual processing with the handleDrain function. We will skip over the signature part here, just make sure you set VERCEL_DRAIN_SECRET with an empty string for now as an environment variable in the Vercel settings of your project. We'll get the secret when setting up our log drain so that no one but our log drain can call this function.
The core logic of handleDrain is straightforward: we parse and classify the raw logs into rows to insert. If we only want AI related rows, we filter out everything else. If any rows are still left we insert those rows.
Copy code
const AI_ONLY = (process.env.AI_ONLY ?? "false").toLowerCase() === "true";
const rows = parseAndClassify(rawBody);
const toInsert = AI_ONLY ? rows.filter((r) => r.ai_category !== null) : rows;
if (toInsert.length === 0) {
return { status: 200, body: `ok 0 of ${rows.length}` };
}
try {
await insertRows(toInsert);
} catch (err) { ... }
The crucial part of course is the parsing and classifying. Again, you can see the full logic in our example repo, but I'll highlight a few things.
Copy code
// We loop over all items in the payload and push them to a rows object.
const rows = [];
for (const item of items) {
if (shouldSkipPath(path)) {
// For certain requests (styling, JavaScript, images, etc.) we skip the request to save on storage/processing
continue;
}
// Request specific details can be either directly in the request (e.g. 'user-agent') or in the proxy object if the request is proxied
const userAgent = pickString(line, [
"proxy.userAgent",
"userAgent",
"request.headers.user-agent",
]);
const category = classify(userAgent);
rows.push({
// we use the available identifiers and timestamps
event_id: asString(line.id),
received_at: now,
event_ts: eventTs,
event_hour: new Date(Math.floor(eventTs.getTime() / 3_600_000) * 3_600_000),
project_id: asString(line.projectId),
deployment_id: asString(line.deploymentId),
source: asString(line.source),
// We capture the request specific details directly or when proxied
host: pickString(line, ["proxy.host", "host"]),
path,
method: pickString(line, ["proxy.method", "method"]),
status_code: pickNumber(line, ["proxy.statusCode", "statusCode"]),
user_agent: userAgent,
referer,
// It is common practice to nullify the last three digits of an IP address for anonymization
client_ip: anonymizeIp(pickString(line, ["proxy.clientIp", "clientIp"])),
region: asString(line.region),
request_id: pickString(line, ["proxy.requestId", "requestId"]),
ai_category: category,
ai_name: name,
// Optionally you can keep the raw JSON object, especially convenient for debugging or re-classification
raw: JSON.stringify(line),
});
}
The actual inserting of rows happens in db.ts. This makes sure the database and tables exist, a connection is ready, and then inserts the remaining rows into MotherDuck.
Connecting to MotherDuck
Since MotherDuck is available on the Vercel Marketplace connecting is as easy as making a few clicks. By going to integrations and searching for MotherDuck, you can get a dedicated MotherDuck organisation directly connected to your Vercel project. If you are already using MotherDuck, you can of course use your own MotherDuck token within your existing MotherDuck organisation.
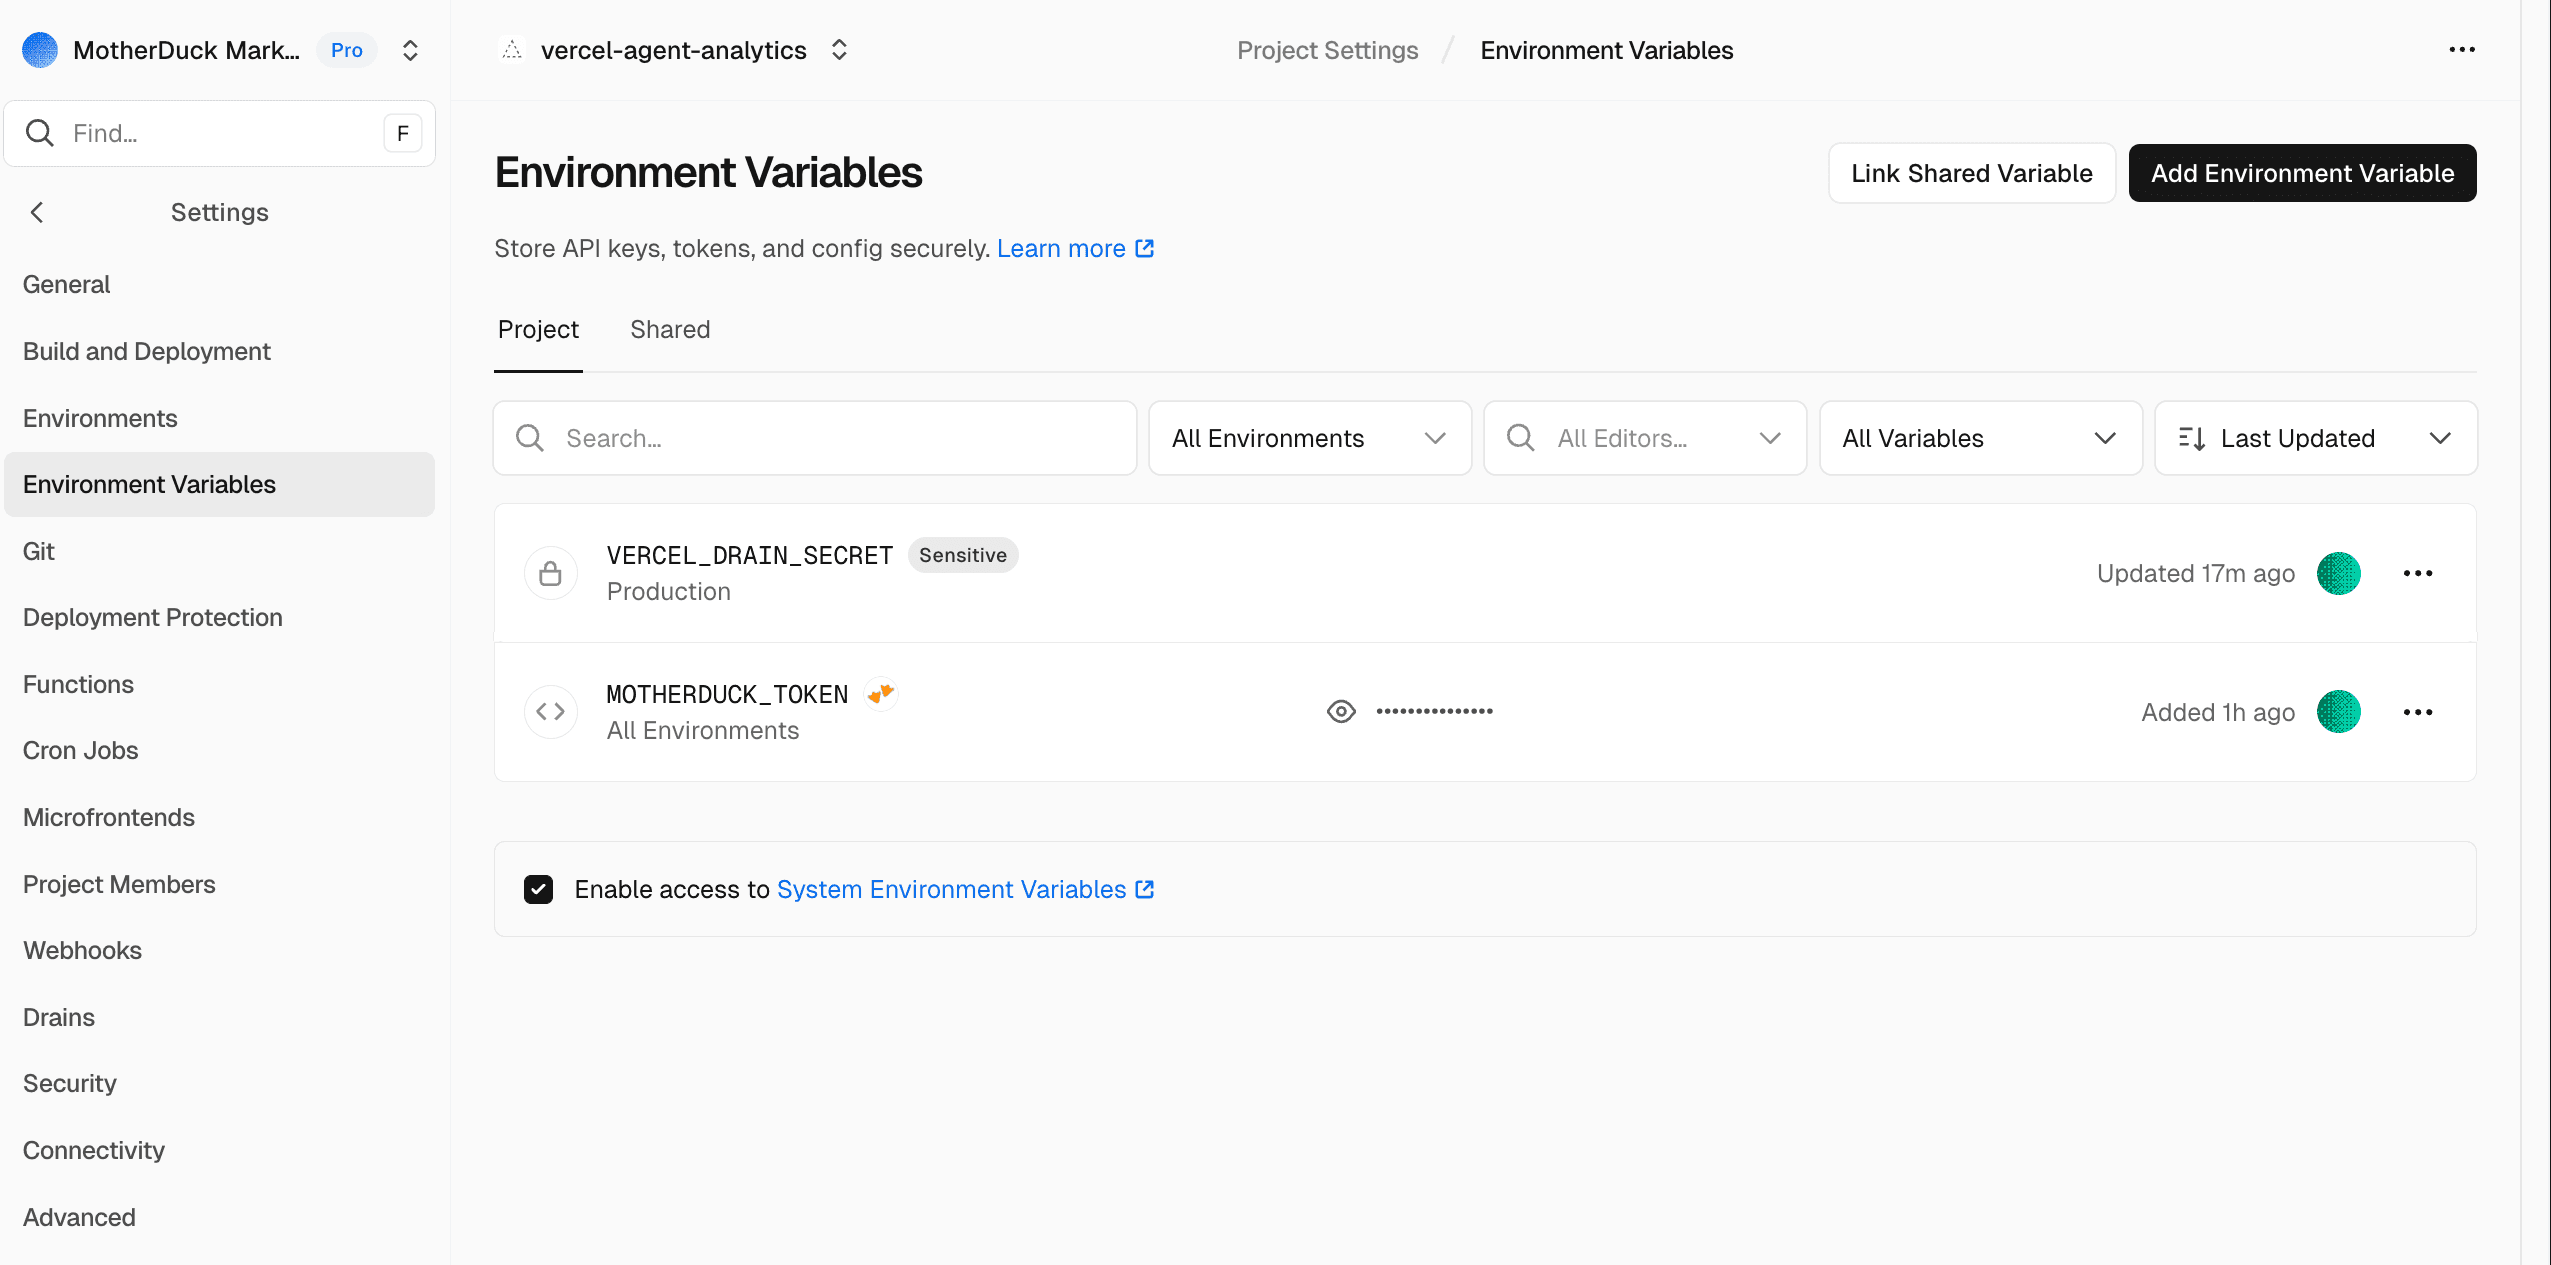
When you have connected to MotherDuck through the Vercel marketplace, you will see a MotherDuck token show up in the environment variables of your project.
Connecting the drain
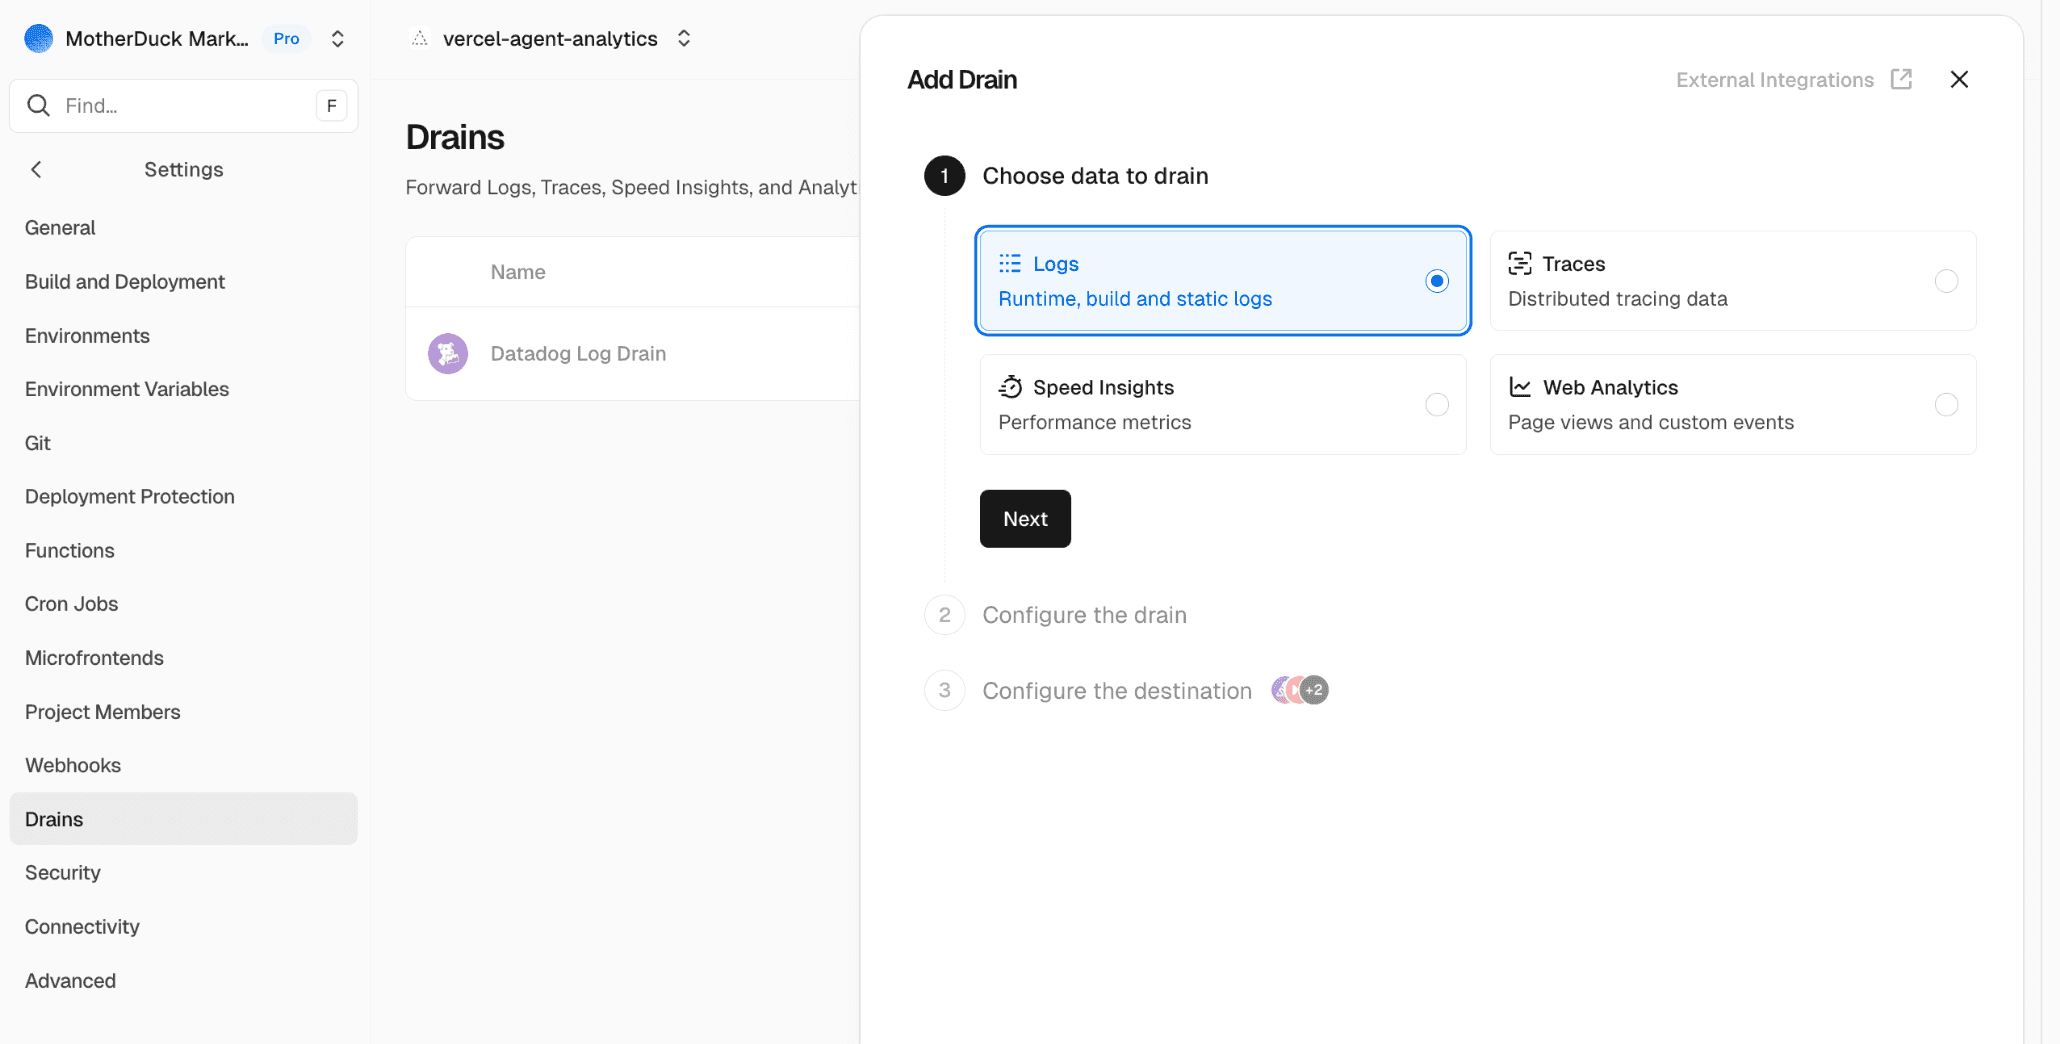
We now have everything we need to set up our system. So let's connect our log drain and get that data in. To set up a new log drain go to your project settings, create a new drain and choose 'Logs'.
Click 'Next' to configure the drain. Here you can select the projects from which you'd like to take data as well as the sources. At the very least you should select 'Static Files', but if you use functions or rewrites in your project you might need to select those too.
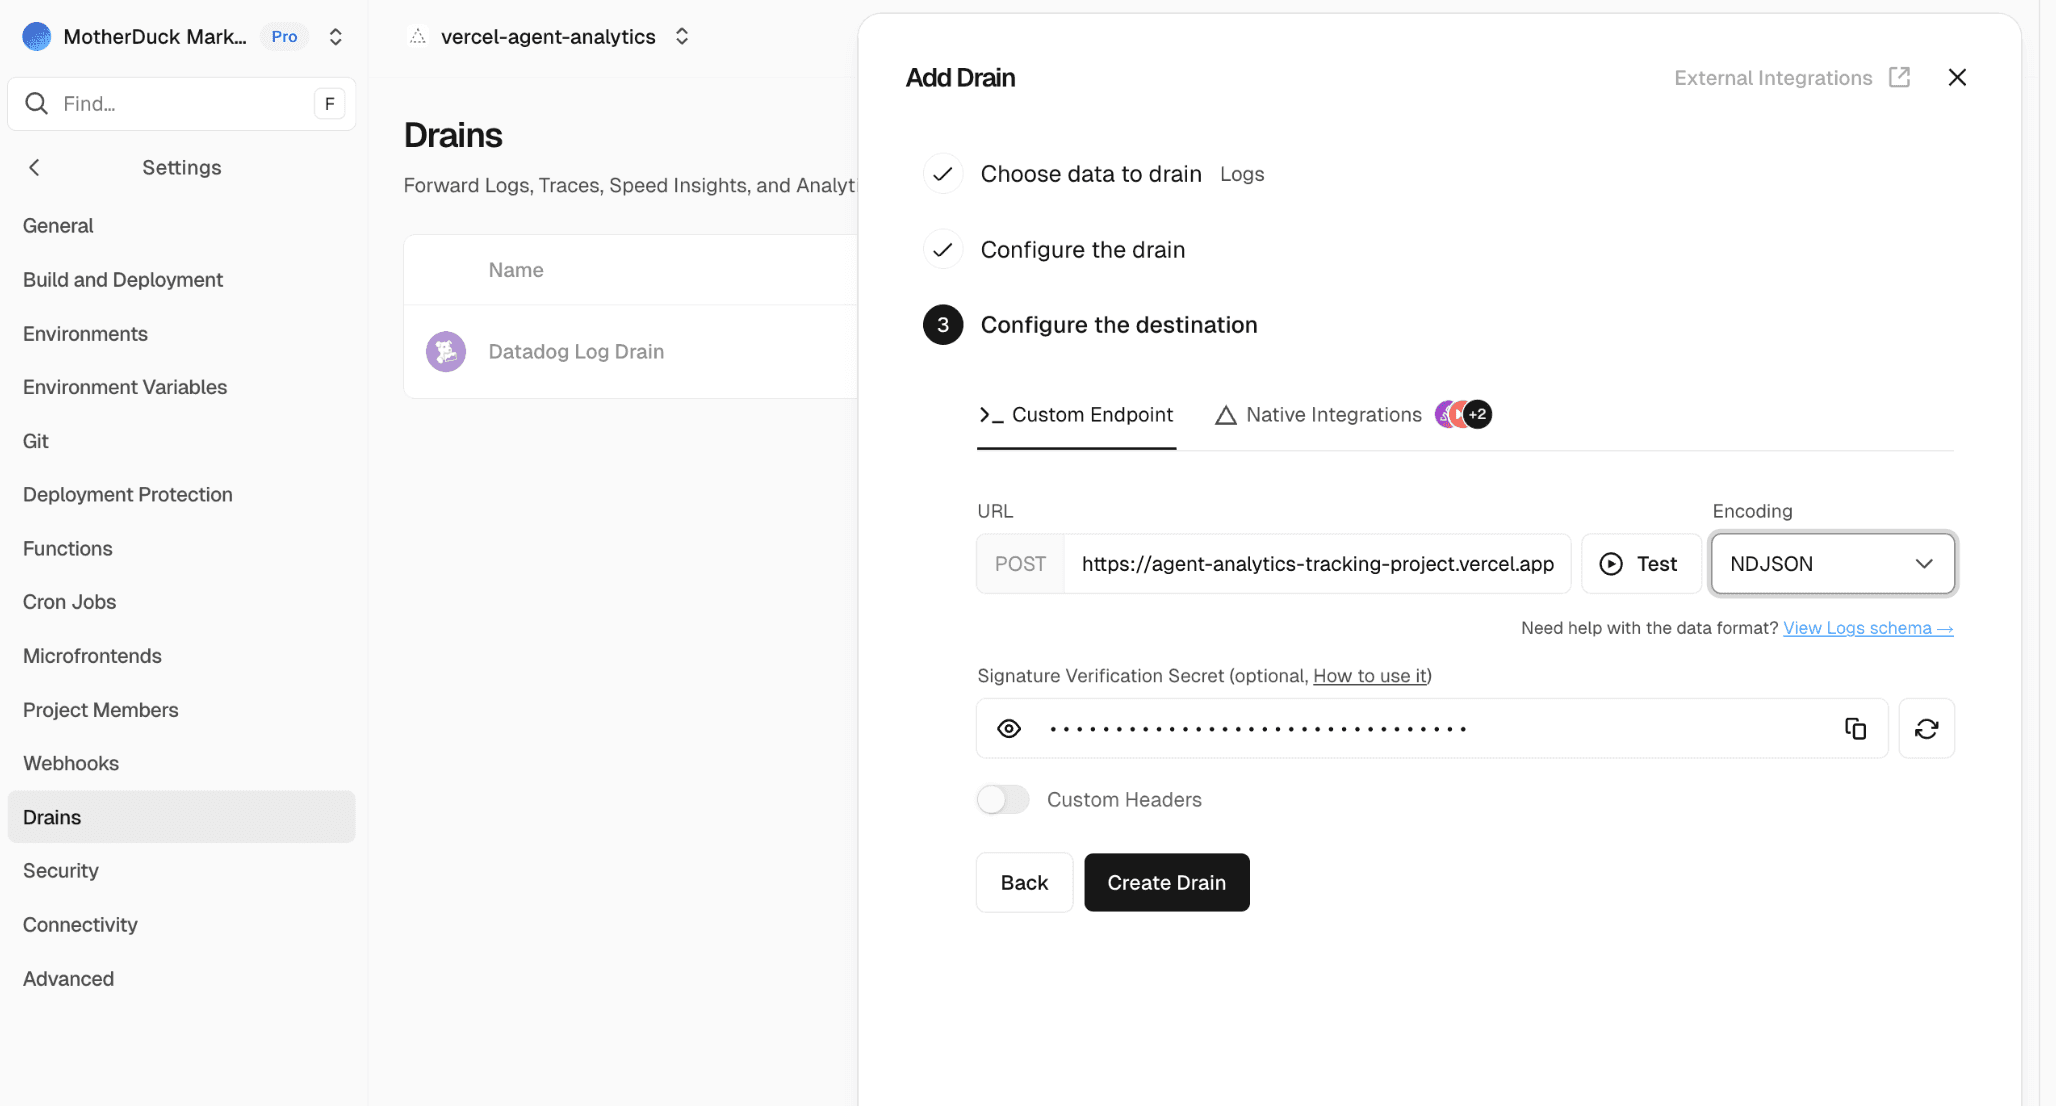
Finally we connect it to our function. The URL will be your-project.vercel.app/api/drain and for batching you'll need to set the encoding to NDJSON. This will send multiple JSON objects in one request separated by newline delimiters. For verification we can now store the secret we get here in the VERCEL_DRAIN_SECRET environment variable that we set up earlier.
Checking for incoming results
To see what data is coming in, you can query the ai_requests view. If that doesn't work, you always query agent_analytics.raw.vercel_request_logs to look at the raw data coming in.
Copy code
from agent_analytics.raw.ai_requests
select
ai_category,
ai_name,
status_code,
split(path, '/')[2] p1,
split(path, '/')[3] p2,
path,
count(*) ct
group by all
order by ct desc
| ai_category | ai_name | status_code | p1 | p2 | path | ct |
|---|---|---|---|---|---|---|
| agent | ChatGPT-User | 200 | docs | getting-started | /docs/getting-started/sample-data-queries/... | 701 |
| agent | ChatGPT-User | 200 | docs | concepts | /docs/concepts/... | 443 |
| agent | ChatGPT-User | 200 | docs | about-motherduck | /docs/about-motherduck/... | 354 |
| agent | ChatGPT-User | 200 | docs | sql-reference | /docs/sql-reference/... | 279 |
Final thoughts
There's no denying the impact that AI is making on our lives and our work. Whether you use it yourself or not, others will use it to access your website and your products. There is a lot to still figure out around measuring the impact of AI and agents and the experience they have using your product. You don't need to fly blind though. You can take a simple approach like this to see what pages are queried by agents and get a feeling for where you might need optimizations and improvements.
If you'd like to run this in production there are a few caveats to be aware of.
- Logging requests can be like drinking from a firehose. Traffic on your site can explode or at the very least go up and down wildly. Make sure that you are aware of limits both in infrastructure and in terms of budget so you don't get an unwanted credit card bill
- We are currently classifying bots and agents before ingestion based on the current state of AI labs. This is good for keeping storage and ingestion low, but it means that you might miss new bots and agents that are added. If you want to keep track of those, you'll have to move your classification stage further down for example in the
ai_requestsview itself - Tracking requests on a production website with continuous traffic means you will likely have a Vercel compute function running 24/7. Since our function is very light, Vercel Fluid Compute is a perfect solution since it only charges for active CPU and scales down to 0. Still, you will get charged for the compute you do use.