Vibe coding came for software development a year ago. It's here for analytics now, too. The agent writes the React, the agent writes the SQL. This comes with fear of what's next - How does my work change? Do I even have a job? I would argue that we need great analysis more than ever, and our job merely changes shape. Next is a tactical guide on how to prepare for this reality.
That being said - at least two jobs are still yours. Design: chart type fit with question type, narrative arc, the data viz fundamentals that don't care the agent is typing. And then the data layer underneath: schema, views, macros, comments — what the agent reads to write the SQL.
Below is the 20-minute talk version of this, itself a Dive. The rest of this post is the same story in prose, for readers who'd rather read than click through.
Why this matters
Gartner has been saying for years that BI adoption tops out at around 30%. Two decades of self-service analytics, billions of dollars in tooling, and yet, the other 70% of your company never logs in. The dashboard answers the first question and never the next set (sometimes export to excel helps). Then, someone has to maintain (and hopefully deprecate) the stale ones. And of course, the dashboards need bespoke training nobody has time for. Ultimately, the workflow lives in a tool you log into instead of where work happens.
Three things changed recently. LLMs got reliably great at SQL. MCP tools gave agents a standard way to discover schemas and run queries. And visualization went from "thing you build in Tableau" to "thing the agent generates as code."
That last one is a Dive: a React + SQL component your agent writes for you, on top of live MotherDuck data. You can read it, edit it, and version it.
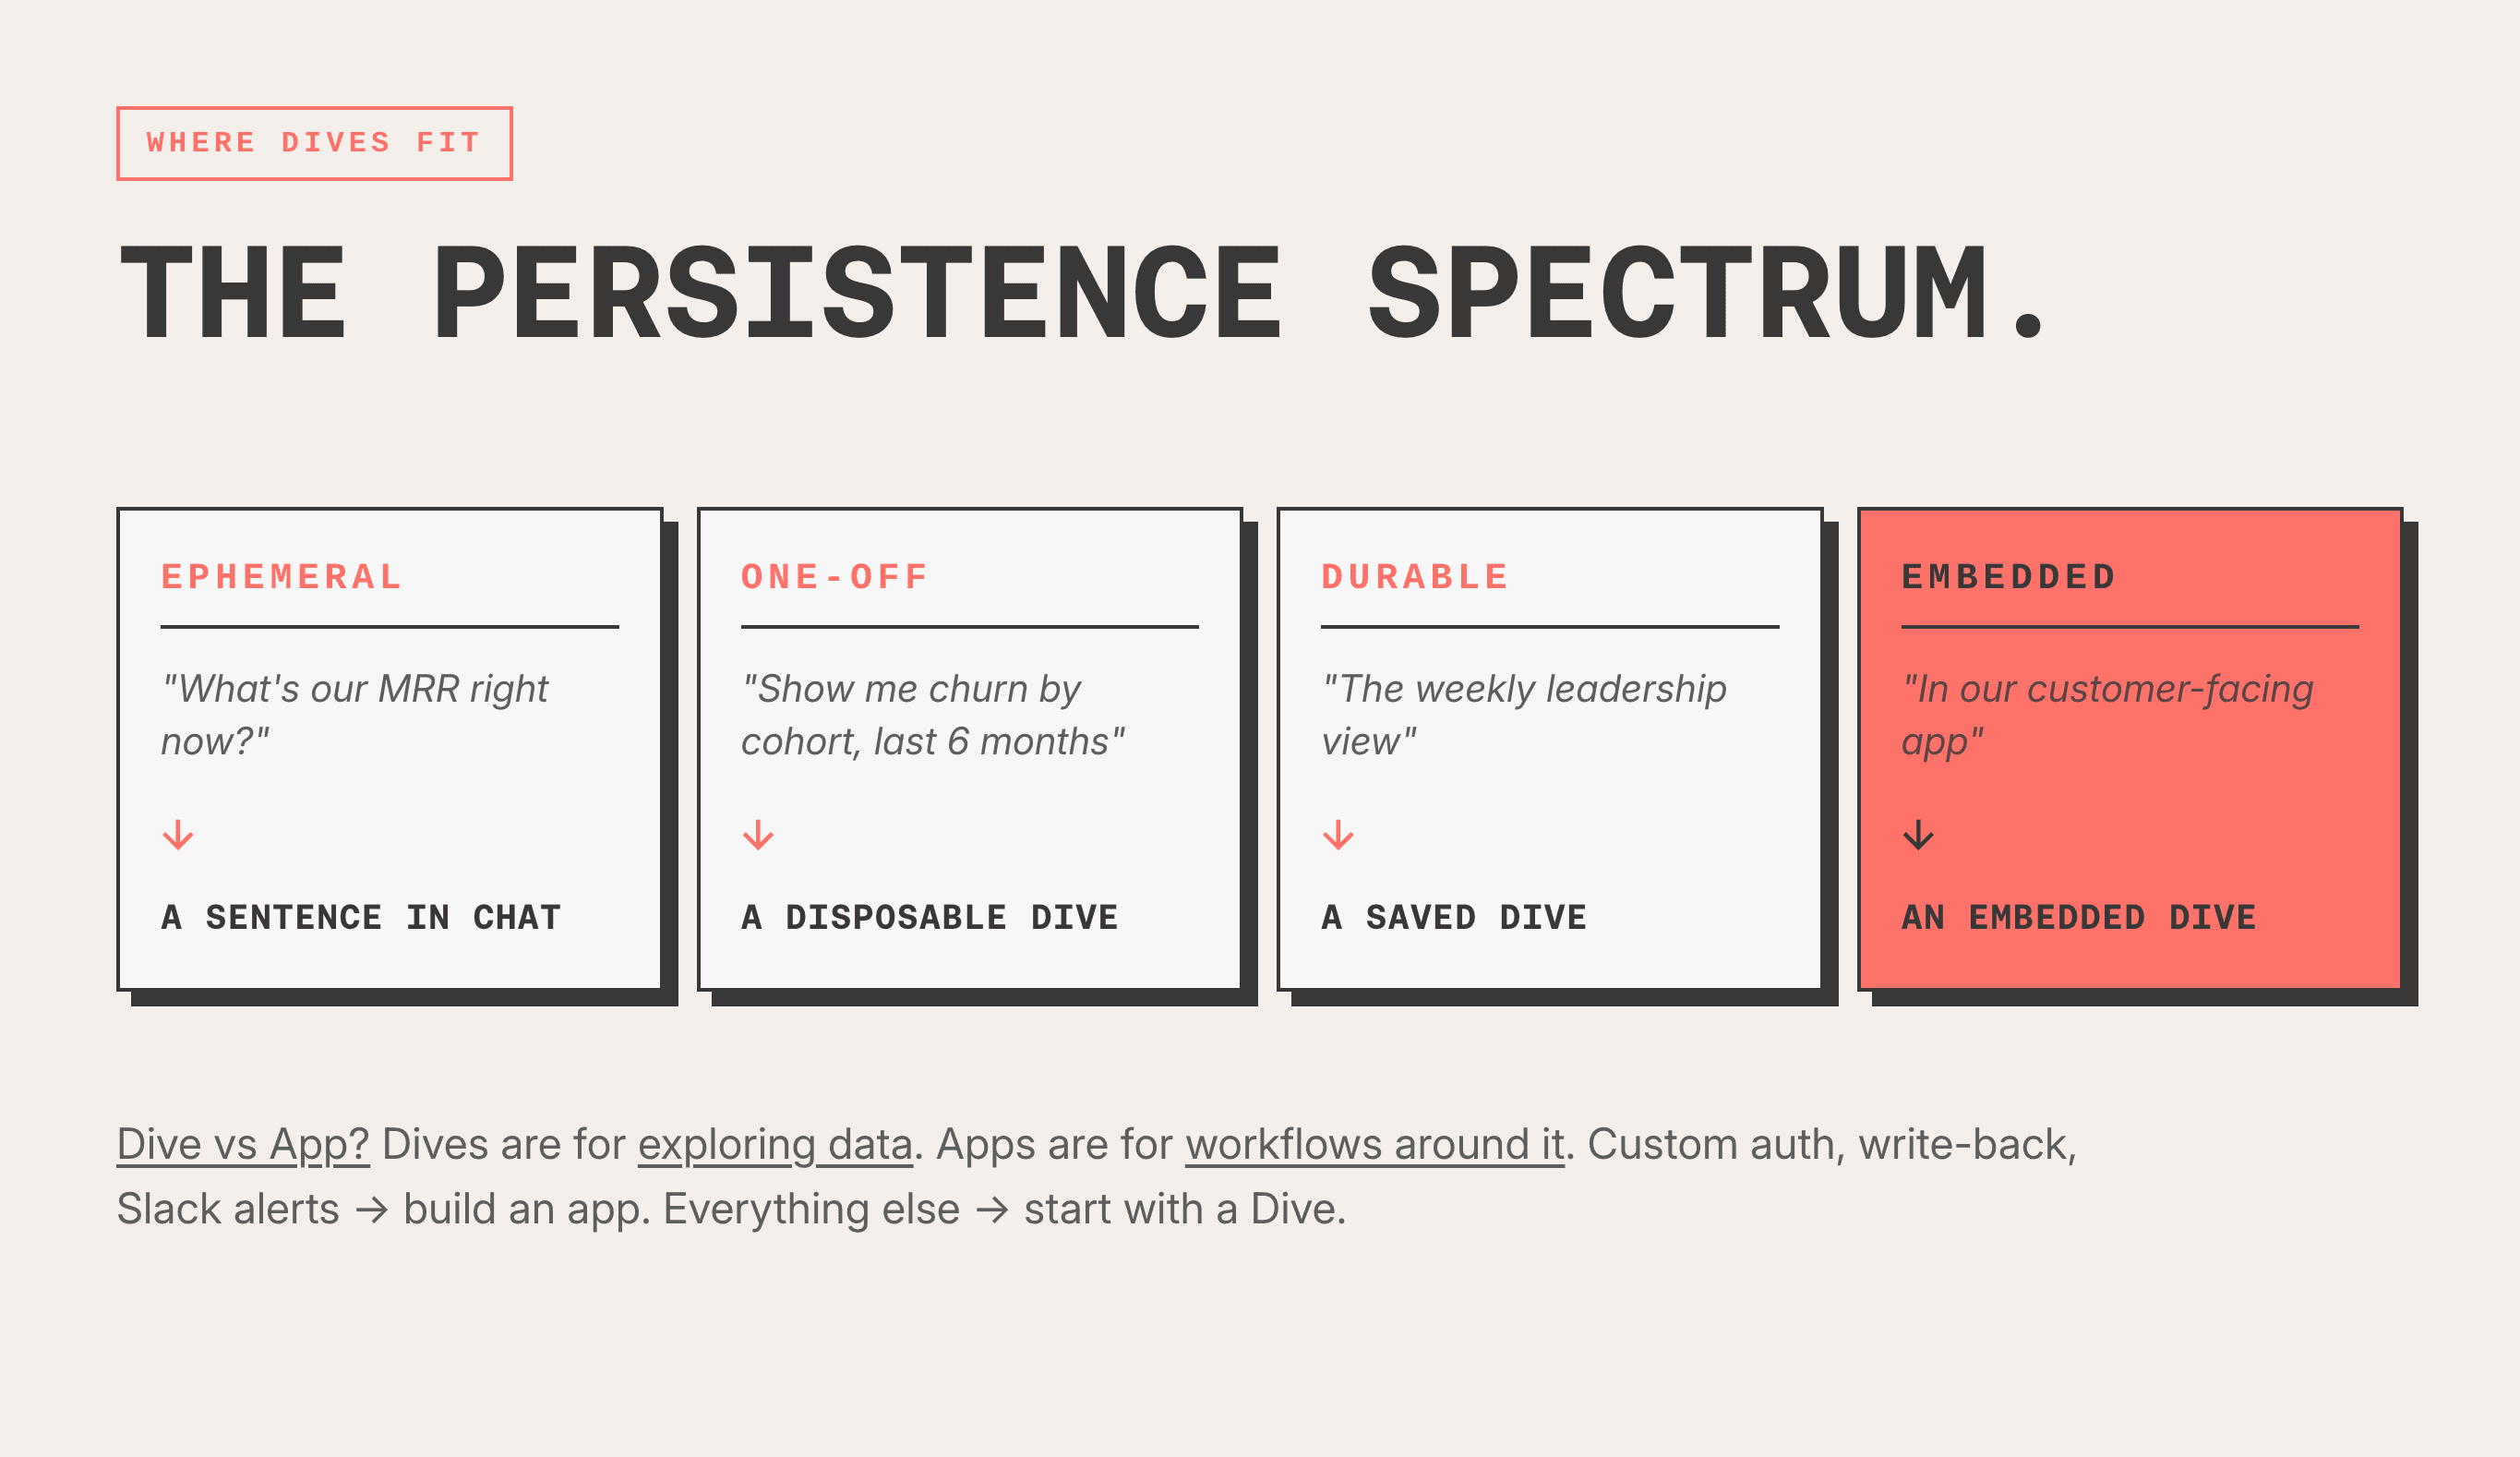
The persistence spectrum
Once an agent can build a visualization cheaply, you get a spectrum that didn't exist before:
All four are built the same way. Persistence gets decided after the visualization exists, not before. You don't predict which questions justify the engineering up front. Simply ask. If it's worth keeping, keep it.
The five-minute Dives are the ones that wouldn't have happened in the old world - half a day of dashboard development is too expensive for a question you might only ask once.
It's just code
A Dive is one React file: dive.tsx. The NBA Game Quality Explorer I built is about 800 lines. It exports a React component and a constant called REQUIRED_DATABASES. Data comes from a hook called useSQLQuery — pass it a SQL string, get back rows.
There's no proprietary DSL. No drag-and-drop builder hiding behind your back. You can cat it. You can git diff it. You version-control it like any other code.
I've written about the full workflow (explore, find the story, iterate, design, ship) in How I Dive. Short version: chat with the agent, watch the preview, give vague feedback like "I don't love this" or "getting warmer," and chip away across sessions. The NBA Dive took eight sessions over a week.
These principles below aren't new, and they aren't Dive-specific. We've written an accompanying data viz best practices that applied long before the agent was writing the code:
Start with a question, not a chart.
Match chart type to question type.
Design with intention — color, clutter, hierarchy, context.
Build a narrative arc — setup, tension, insight, action.
Make interactivity last.
Your AI follows the rules, but doesn't really understand them, so the final check is human.
Collaboration and maintenance
Because a Dive is text file, the collaboration tooling your team already uses just works. Branches, PR review, CI previews, git revert, and so on are all included. A Dive slots into the same source control and CI/CD pipeline as the rest of your application code.
The pattern is blessed-dives-example: pull dive.tsx into a repo, edit, open a PR, get a CI-built preview Dive on the PR, review the rendered Dive instead of the raw diff, merge to deploy. It should be a very similar review loop that your engineers run on the rest of the codebase.
Additionally, bigger Dives should be split into multiple files. One example internally breaks one Dive into seven parts: an index.tsx, three tab components, and shared components.tsx/constants.tsx/utils.tsx. esbuild bundles them into a single Dive at build time. This way, reviewers get small per-file diffs, not a wall, and its easier to reason about. As a side benefit you can also share components between Dives this way.
For the in-app side: treat saved Dives list like a curated gallery. In the Dives Gallery, you can publish internal-only Dives for your org, to better organize them and share knowledge.
The data layer is the leverage point
We ran DABstep on 352 hard payment-processing questions. It contains Multi-table joins, arcane business rules, and trap question that takes an experienced analyst to solve. Using the the same model for each experiment and evolving our prompts and data structures, we evaluated the impacts of various changes:
Hand-crafted column comments. Grain warnings, NULL semantics, business rules. Improvement: +0.3 percentage points. Rounding error. I figured comments would be the big lever. They weren't.
Then we built views. Same multi-table joins, baked into DDL. Named the columns to preserve lineage (payments_merchant, derived_fee_amount). Wrote view comments saying what to aggregate and what not to. 86.6%. Plus 56 percentage points from one DDL change.
Then macros. DuckDB table macros, named as the answers (merchants_affected_by_fee(id), not get_merchants_for_fee_id). The model reads the name and knows when to call it. 93.2%. Best tier is also the cheapest, at four dollars per run.
That number would put us at #1 on the DABstep leaderboard, ahead of NVIDIA, Google Cloud, and AntGroup. This used a worse model than others (Gemini 3 Flash) but a better data layer.
We didn't make the AI smarter - in fact we used a pretty dumb model. Instead, we made the data model better.
The full research is in MotherDuck's Guide to BI in the Agentic Era — methodology, the rest of the numbers, and the broader LLM+SQL work behind this post.
What to actually build
Priority order for your warehouse:
A compact, well-named schema. Boring star schemas beat metadata engineering. fct_orders joined to dim_customers on customer_id is self-explanatory. If your schema needs a glossary to navigate, the agent will need one too.
COMMENT ON the confusing stuff. Skip customer_name. The agent doesn't need help with that. Use comments for grain warnings, NULL semantics ("NULL means matches all volume tiers"), business rules.
Views for complex logic. The single highest-leverage DDL change you can make. Encapsulate the multi-table join so the agent never has to reconstruct it. Name view columns with prefixes that preserve lineage (payments_merchant for passthrough, derived_fee_amount for computed). Comment what to aggregate and what not to.
Macros named as answers.merchants_affected_by_fee(id) beats get_merchants_for_fee_id. The model reads the name and knows when to use it.
Bonus: Spend some tokens mining your query history. MD_INFORMATION_SCHEMA.QUERY_HISTORY plus SUMMARIZE turns the implicit knowledge in your analysts' heads into column comments the agent can read. The agent stops running exploratory queries because it already knows.
Three things to take with you
A Dive is just code. Read it, edit it, and version it. You don't lose ownership to a BI black box.
Knowing the question is still your job. The AI follows the rules; it doesn't understand them. Use it to write even better questions.
The data layer is the leverage point. If its intuitive to a human, it also is to an LLM.
Friction killed asking the questions that were just outside the reach of canned analytics. Start there.
April 2026 at MotherDuck: Duckling compute monitoring, Embedded Dives, agent Skills, DuckLake 1.0 support, and Power BI + Tableau via the Postgres Endpoint.
Track AI agent traffic that bypasses your web analytics. Stream Vercel Log Drains into MotherDuck to see how ChatGPT, Claude, and other agents browse your site.