Business Knowledge Is Still King: Agentic Data Analysis Without a Data Team
· 30 min read
Let's say you are new to data analytics and need a report or data analysis of a file, multiple files, or a query from a data warehouse. How do you start? What do you do? The common path is probably to ask ChatGPT or use the chatbox available, paste the exported CSV into Excel, and make some edits. But how do you share it, schedule it, and have a central pipeline for all, not manually in a spreadsheet function, and how would you scale the Excel sheet if it's slow to crunch a lot of data?
With the latest introduction of Claude Dashboards and other ChatGPT visualization features we have available, people might call it the death of BI (again), but to me, it clearly shows the opposite: that dashboards are still needed, and they probably always will be. Some dashboards might be replaced by a chatbox, asking specific questions and visualizing autonomously when needed, something MotherDuck perfected with Dives, or Claude Dashboards, or other agentic integrations into BI tools.
This article gives you a guideline on how to use AI when you don't know anything about data warehouses or analytics technologies, but you know a lot about your business. It helps you end-to-end while staying in control. Great tooling improves the data analyst's workflow and makes complex problems simple. Everything is iterative, asking questions from the very start.
I talk a lot about non-technical users, business experts, or domain experts in this article. To clarify, when I say these, what I mean is a person who knows the domain, the subject of a business, best. Not the power user who can query the data, but the one who knows from experience when a number is wrong.
There's also the term 'Data Intelligence Engineer' in Jordan's recent blog article, published after I wrote this article, where he came to a similar conclusion that there are tasks that the "model can intuit from data or history", and business experts are still needed, which we go into in detail in this article.
The Barrier to Entry Is Getting Lower and Lower
What certainly has changed with the Claude Dashboards announcement and generally with the agentic revolution is the barrier to entry for data analysts. In the early days, you needed to request a new data source or a specific report months in advance, and the BI team would implement it if you were lucky.
Later, the role of 'Analytics Engineer' popped up with the rise of dbt. We called them 'BI power users' before, but these were technical people who were familiar with SQL first, and even more technical, as they needed an understanding of some software engineering best practices: to work with git, understand .envs to define different dbt data environments (dev/test/prod), and maybe even understand what deployment means.
Enabling Domain & Business Experts to Do Analytics Autonomously
Today, if you know the domain of your business very well, you might not even need that data analyst anymore, and you have a lot of leverage: nobody knows the data as well as you. Therefore, you want a direct way to ask a chatbot, your BI tools, your Dives: "What are my new customers that signed up but never tried?", or "What's the profit over the last months compared to the previous 3 years?".
These are traditionally complex SQL queries joined over many tables, aggregated and cached usually in a data warehouse. You need to understand how to aggregate measures, how to join different tables to not create a Cartesian product (duplicates with wrong joins), you need to understand grain and cardinality, and you might need to understand facts and dimensions, depending on whether you access a modeled data warehouse (yay, you are lucky) or just raw dogging directly on the source tables, a fully normalized database schema with potentially 100s or 1,000s of database tables.
With rising agentic capabilities, a Model Context Protocol (MCP) and/or a DuckDB zero-copy SQL data connection, agents know all of the basic concepts (grain, normal form, full outer join, etc.) as part of the training data, and can start understanding the data by just querying ahead, exploring the data schema with SELECT * FROM INFORMATION_SCHEMA.tables, then joining and getting some sample data with LIMIT 100, interpreting, and maybe asking some clarification questions to the domain expert, who is the best person to ask anyway. So the feedback loops are really fast and of high quality, as the answer, with data interpreted and shown by the agents and then signed off by a domain expert, is really powerful.
Dangers of AI-Driven Data Analytics
Obviously, there are also dangers to it4. Querying the source database, letting the agents run heavy queries, either on production or in the data warehouse, can bring down the whole application that users are using, or the analytics platform (which might be less critical, but in some cases just as important, depending on your company's function). However, you still can't put your quickly generated dashboard on the internet where everybody can attack it.
Then there's the danger of permissions, and of deleting or updating data that shouldn't be3, as the agents need quite high permissions to do the exploration work. This also might be a problem if you have PII or other sensitive data that people are not allowed to query. Are the agents allowed to read them - potentially uploading them to a cloud? Who is using the agents? These are hard questions. There are other limitations of AI or LLMs, such as hallucinating, which happens less and less as the agents can actually see all the data and the source schema, but they might still miss critical information that is only in people's heads. A less direct danger is that generative AI might build complex data stacks and tooling that work well in the beginning, but a week or a month later are very hard to maintain or extend.
AI has been getting better at using memories to also accumulate knowledge that the domain expert might input, but the downside is that AI models have a hard time forgetting. They have a hard time knowing what is important, what is older but still relevant, and what new information might just be noise, or not relevant to the current problem. There are more unsolved problems with security or others, but there are also a ton of upsides, which we want to analyze and get into.
The Chance for Less Technical, but Business Experts
If we take MotherDuck as an example, they have a history of making data analytics as simple as it gets. DuckDB does the heavy work of reading files, using it as an interface to any data we want to read, whether on S3, locally, on the web via HTTPS or an Excel file.
But on top, if we want to bring the data to the cloud, share it with others, create an analytics dashboard, or crunch large tables or joins, MotherDuck is the best way to easily scale without changing your toolset. Just change the connection from local DuckDB to MotherDuck, and the rest is done for you.
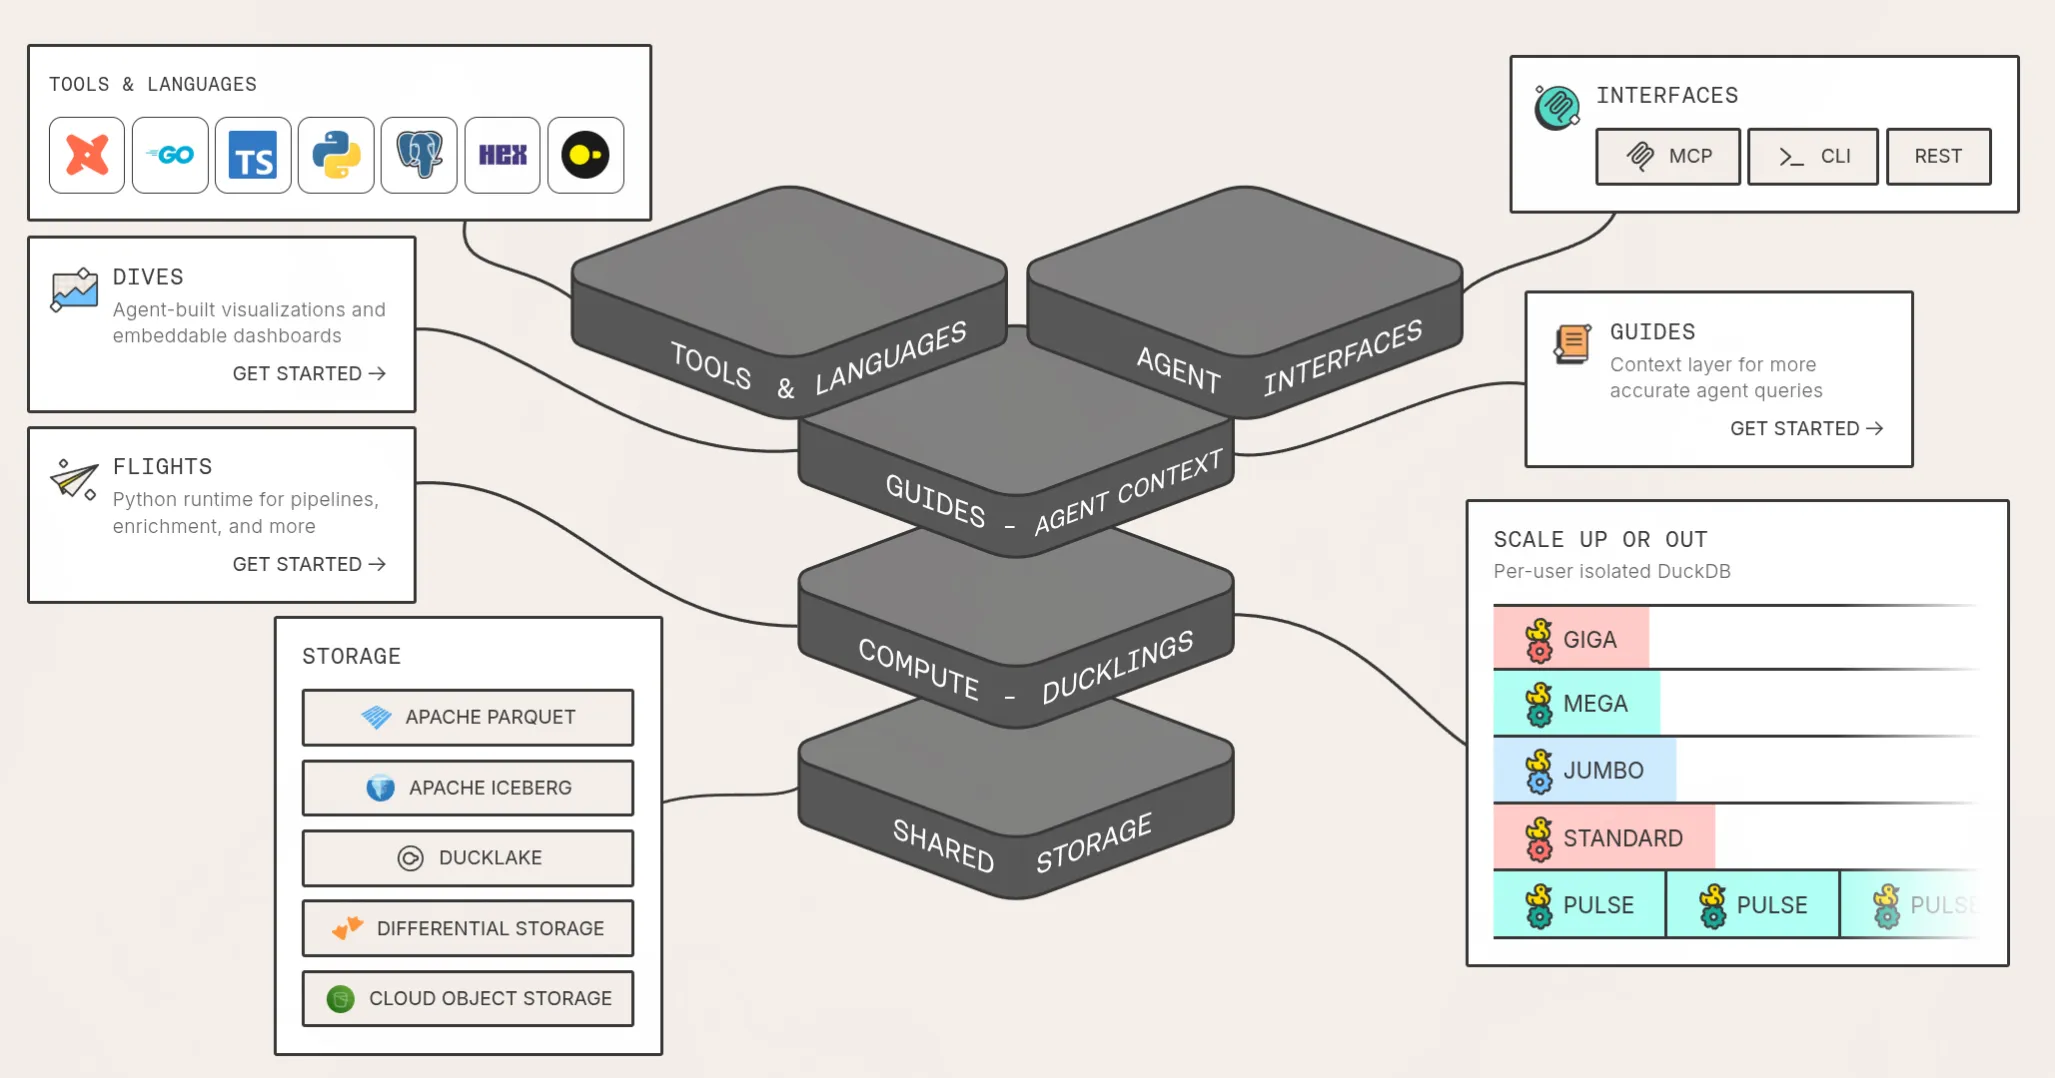
With the recent additions of MotherDuck Dives (Dashboards), MotherDuck Guides (versioned context), and MotherDuck Flights (ETL, Python jobs), everything is integrated into a nice notebook with agent help at every level. And you won't need to worry about scaling or compute, which is a really big part of data engineering: making sure that a job scales out (when it's 1,000s of files), or up if it's a big table or file.
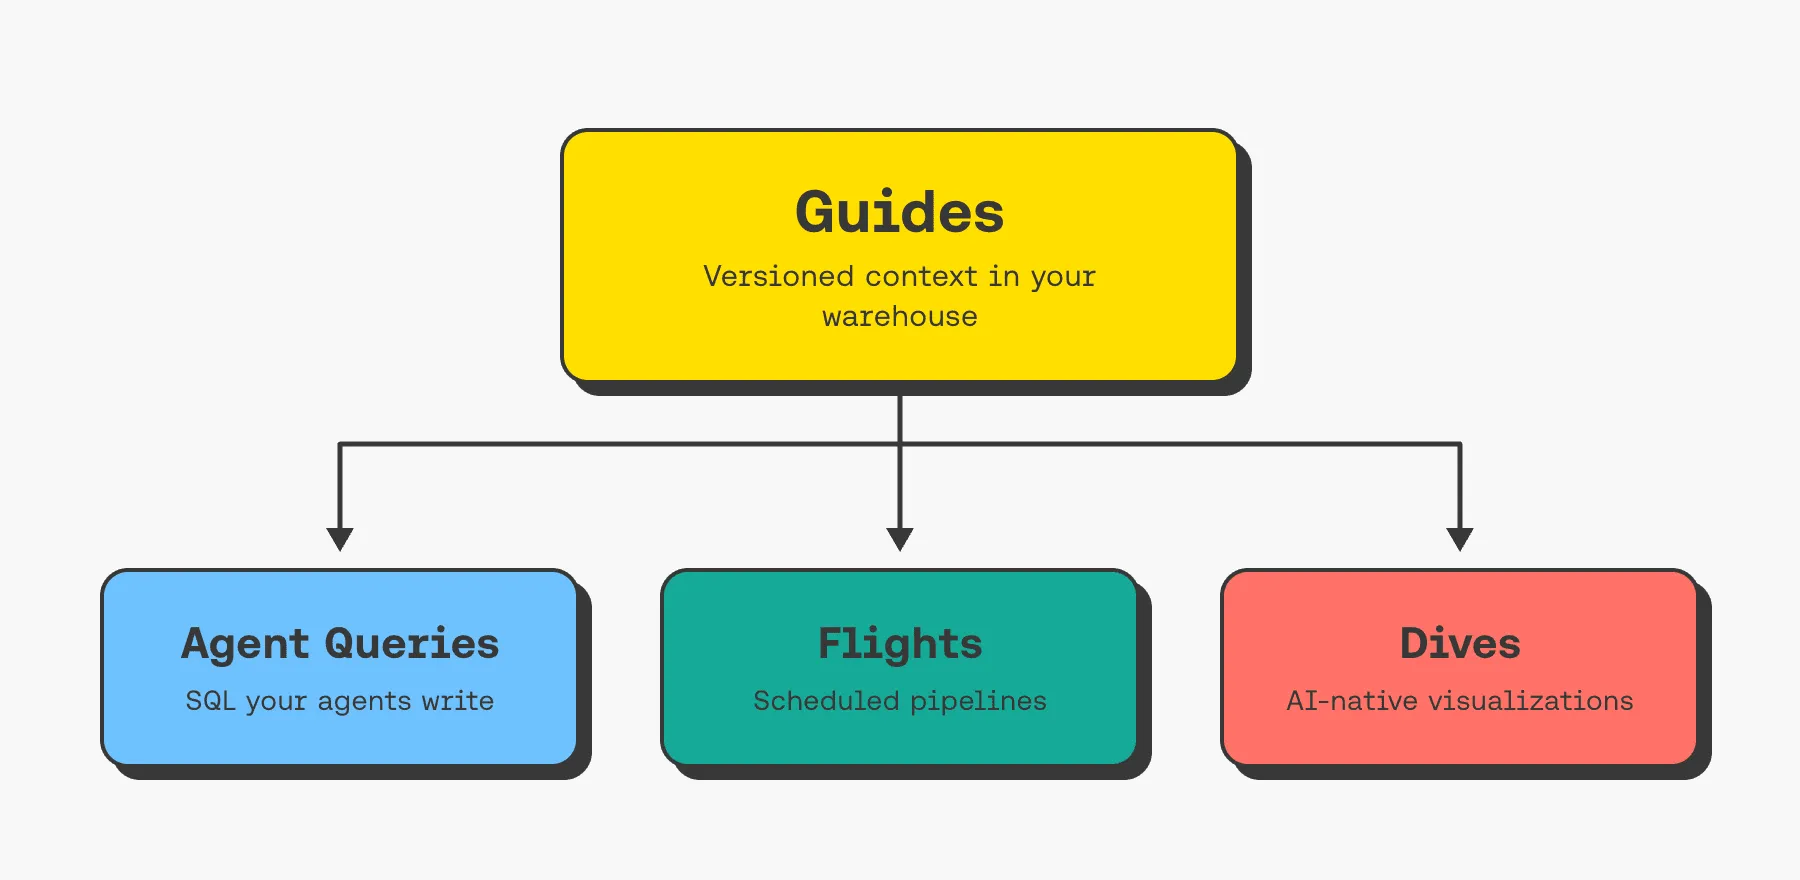
Now that you are a person closer to the business than to the data engineers, DevOps platform, or all the other heavy lifters, you might just use the MotherDuck Web UI, connect it to your data or warehouse, and off you go. You can do similar things with other providers or tools, but it almost can't get simpler or more beautifully implemented than this.
Let's go through an example and actually showcase the possibilities.
Steps a Business Analyst Needs for Doing Data Analysis
So what are usually the steps when you analyze data?
- First, we need to get the data:
- A simple but large file to analyze, or multiple files, either on an FTP or a data lake
- Multiple sources that you want to integrate into one dashboard and get answers from
- So we need to read the data, either directly or by importing it into our data warehouse/analytics solution (whether to import or not is already something you don't need to care about when you start agentically)
- Because this is the heart of data engineering: do I full-load it or load it incrementally, what time slice, etc. So there's a lot, but with an AI agent, just to explore data, we won't answer these questions and just see what the agents come up with
- And then we ask questions about the data. Usually, as the domain experts, we know exactly what the data means, what's in there. We do what data scientists did before: we explore and digest data (slice rows, dissect them, get a feel or visual for the data), just that now, we do it by asking questions and the LLMs do the translation.
- What often happens, though, is that AI agents are also very good at catching gaps: we think we have certain data, just to find out that it is not captured, or that the quality of the column or such data is poor.
- Once we have found the answer, or some new insights that we didn't have before, we typically still want to have a visualization of it, to share with colleagues or higher management
- Lastly, if the dashboard or the numbers are approved by higher management and users, we want to make it auto-update, daily, or if possible in real time (everyone wants real time 😉)
What You Can Do, and What the Data Engineering Team Still Needs to Do
The last step, number 5, when you want to automate it, integrate it into the existing stack, make sure the queries are fully joined in time and the answers come back fast, add an index, or potentially materialize an intermediate table to speed it up, all these are still tasks that you should hand over to your data team.
But before agents, a pure business person, as you might be, would have needed to ask the BI team or data team for support from task one, and it might have taken many iterations and a lot of time, just to find out that the data is missing, or that the question was formulated wrongly. Whereas now, you can go from points 1-4 yourself quickly. That's really the power of agents and enabling the business, and where real money is saved.
So let's see how we can do this with MotherDuck, a data warehouse that is now built around agents.
How a Business Expert Is Doing Data Analytics in 2026 (With AI Support + MotherDuck)
Let's say you are less technical, and you start with task 1 above, reading data from Open Data (OGD) Switzerland, a platform that provides open data free to use by governments and others, and from an external dataset hosted online. Let's go through the steps above.
To start with, I simply open the MotherDuck UI. You create a free account that gives you a free 7-day trial with serverless compute, efficient storage, and the tools, all with a SQL or natural language interface. This is how it looks when you are logged in:
 MotherDuck Web UI interface | app.motherduck.com
You see, MotherDuck already provides all the steps, from loading (1), to visualizing (2), sharing it with others (3), and inviting others to the workspace (4). Plus, you can connect external tools (5) or query in a notebook (6).
Usually I would do that directly in the command line with Claude Code, connecting to the MotherDuck MCP, but this is not showcasing my use case, but the less technical domain expert workflow explained above. Maybe we can show later what the terminal-first workflow would look like. And there's also MotherDuck Try, a simple chat interface that gets you started directly.
Using MotherDuck, an Agent-First Data Warehouse and UI
So let's get started and set up the agent before we fire the prompts.
Setting up the Agent, Once
First, before we start, we connect our agent of choice, e.g., I use Claude for this example:
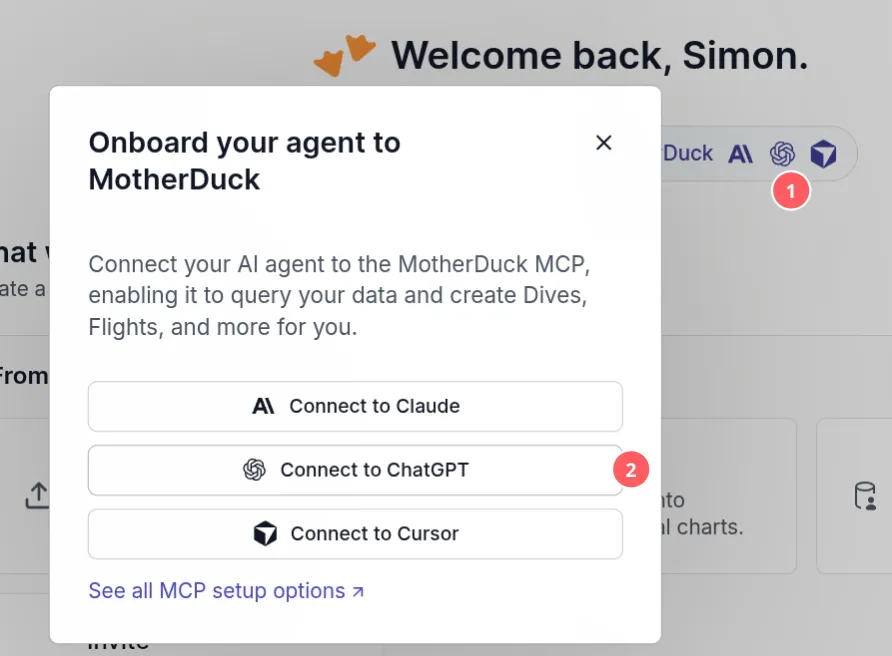
The setup is self-explanatory: you use your MotherDuck account, give permission, and get redirected to Claude. See all options in the MCP setup docs.
Let the Domain Expert Drive the Story, and the Agent Execute the Rest
In this showcase, we go from nothing, the initial prompt and query, to a fully automated report and analytics solution end to end.
Initial Query: Outline the Questions and Share the Data Sources
So what are usually the steps when you analyze data, pretending to be a domain expert, an energy analyst at a Swiss utility, who knows how to buy electricity ahead on the day-ahead market and knows the yearly forecasting errors in the shoulder season, when heating kicks in?
To bring you along on the journey of being a data expert in Swiss temperature, these are the data points that are publicly available. Three sources with different formats: MeteoSwiss SMN (weather stations) + Swissgrid Excel + cantons GeoJSON:
| Source | Format / access |
|---|---|
MeteoSwiss automatic weather stations (ogd-smn) | CSV on data.geo.admin.ch (HTTPS), 159 stations, 10-min / hourly / daily / monthly, now refreshed every 10 min |
| Swissgrid "EnergieUebersichtCH-2026.xlsx" | Excel over HTTPS, 15-min load profiles, per-canton consumption |
| Swiss cantons GeoJSON (26 polygons) | HTTPS, ST_Read works in MotherDuck |
With data from:
- Stations meta: 159 stations, 24 cantons plus Liechtenstein, WGS84 lat/lon included (WGS84 is a global standard geodetic reference system used in GIS, without needing polygon data).
- Bern (capital city of Switzerland) has a 10-min history 2020-2025: 315,648 rows per station per decade file. With 159 stations, that is about 50M rows for 10-min data if all are loaded.
- Bern daily since 1864: 59,170 rows (data for 162 years)
- The Swissgrid Swiss Energy overview has 2026 with 26,204 15-min rows, Jan 1 → end Sept.
- We can join data spatially with
stations → cantons. The temp-vs-energy correlation we have: April -0.72, July +0.24 (heating vs. cooling).
So with the overview and the knowledge of us being the expert, we can ask something like this in natural language:
I'd like to understand how strongly temperature drives Swiss electricity consumption this year. I have two data sources. Swissgrid publishes the "Energieübersicht Schweiz" as an Excel file every month, you'll find it here: https://www.swissgrid.ch/dam/jcr:805e525c-44fe-4701-a227-6144193257ac/EnergieUebersichtCH-2026.xlsx. The sheet "Zeitreihen0h15" contains 15-minute values in kWh. The column I care about is "Summe endverbrauchte Energie Regelblock Schweiz" (end-user consumption), not total consumption, because the total includes pump storage and grid losses. The sheet also has consumption per canton further to the right, but note that Swissgrid groups some cantons together, for example BE with JU and ZH with SH.
For the weather, MeteoSwiss publishes all its automatic stations as open data here: https://data.geo.admin.ch/browser/index.html#/collections/ch.meteoschweiz.ogd-smn. Every station has a folder with daily, hourly and 10-minute files. The daily files are what I need. The parameter for daily mean air temperature at 2 metres is called tre200d0. There's a station list with coordinates and canton in ogd-smn_meta_stations.csv.
Please start with Bern (station BER) as a proxy for the Swiss Plateau. Give me the daily end-user consumption against the daily mean temperature for 2026 so far, and tell me from which temperature downwards consumption starts rising. In our industry we call that the heating threshold, we usually assume around 12 °C. I want to see if that still holds.
Also tell me if anything in the data looks off before you trust it.
As you can see, the query is very specific2. That's on purpose, as the domain expert knows exactly what he wants or needs.
If you click on Load -> Build with AI -> Open in Claude in MotherDuck, MotherDuck will add the following prompt:
Let's create a new MotherDuck Flight together, a Python job that runs on a schedule or on demand against my MotherDuck data.
Please start by calling theget_flight_guidetool from the MotherDuck MCP to learn the format. Then ask me what I want the Flight to do, use the MotherDuck MCP tools (list_databases, list_tables, query, etc.) to explore my data as needed, and create it for me with create_flight.
I've added my prompt from above just below:
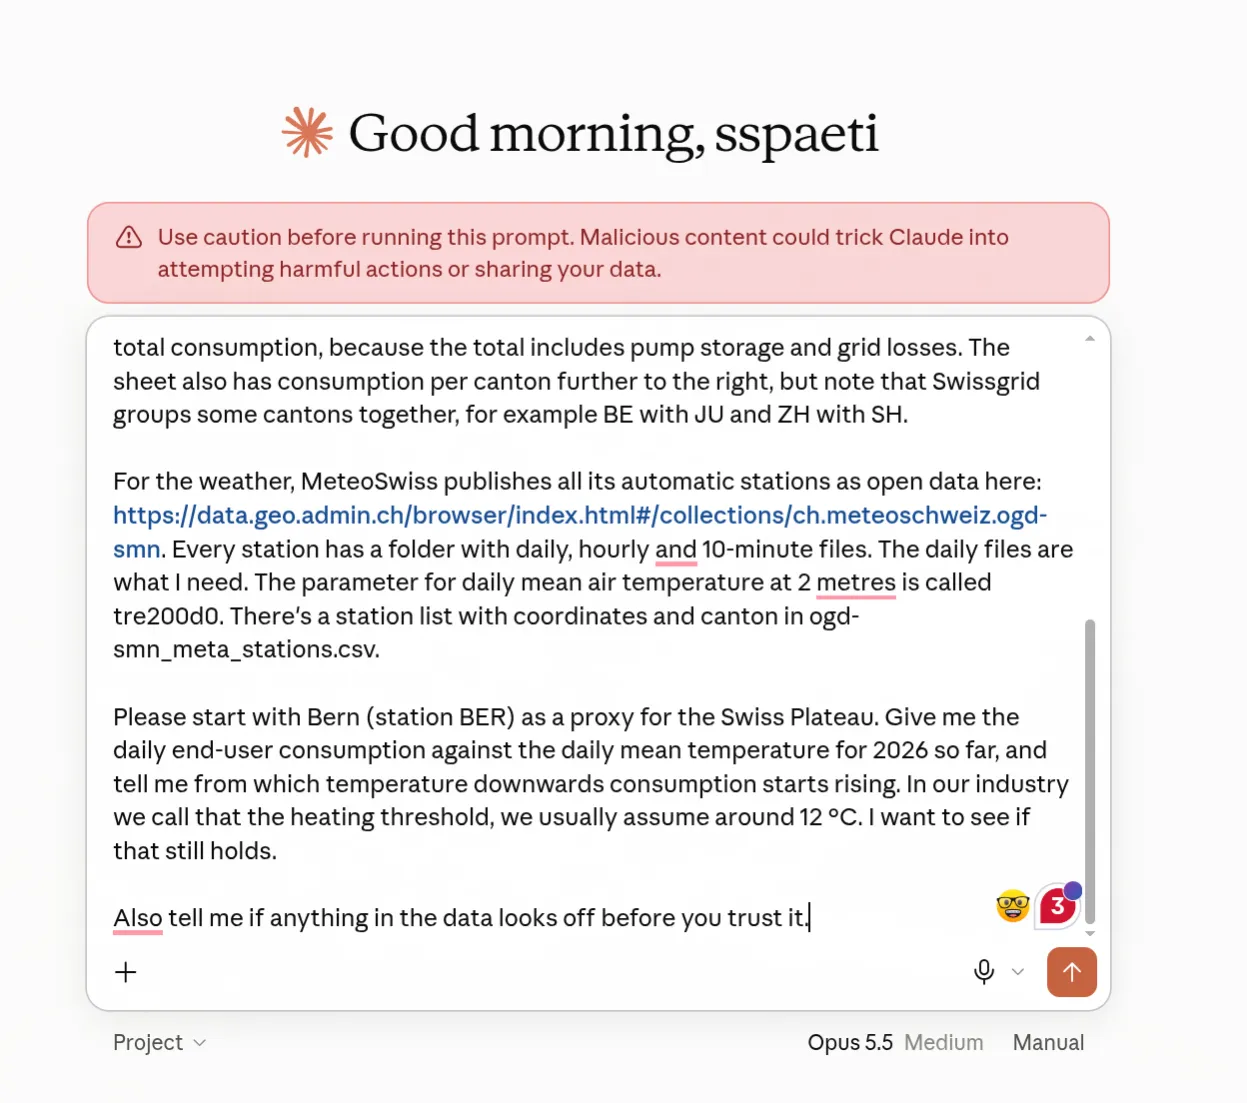
Claude will go ahead using all the tools and APIs provided by MotherDuck and try to build what we asked for:
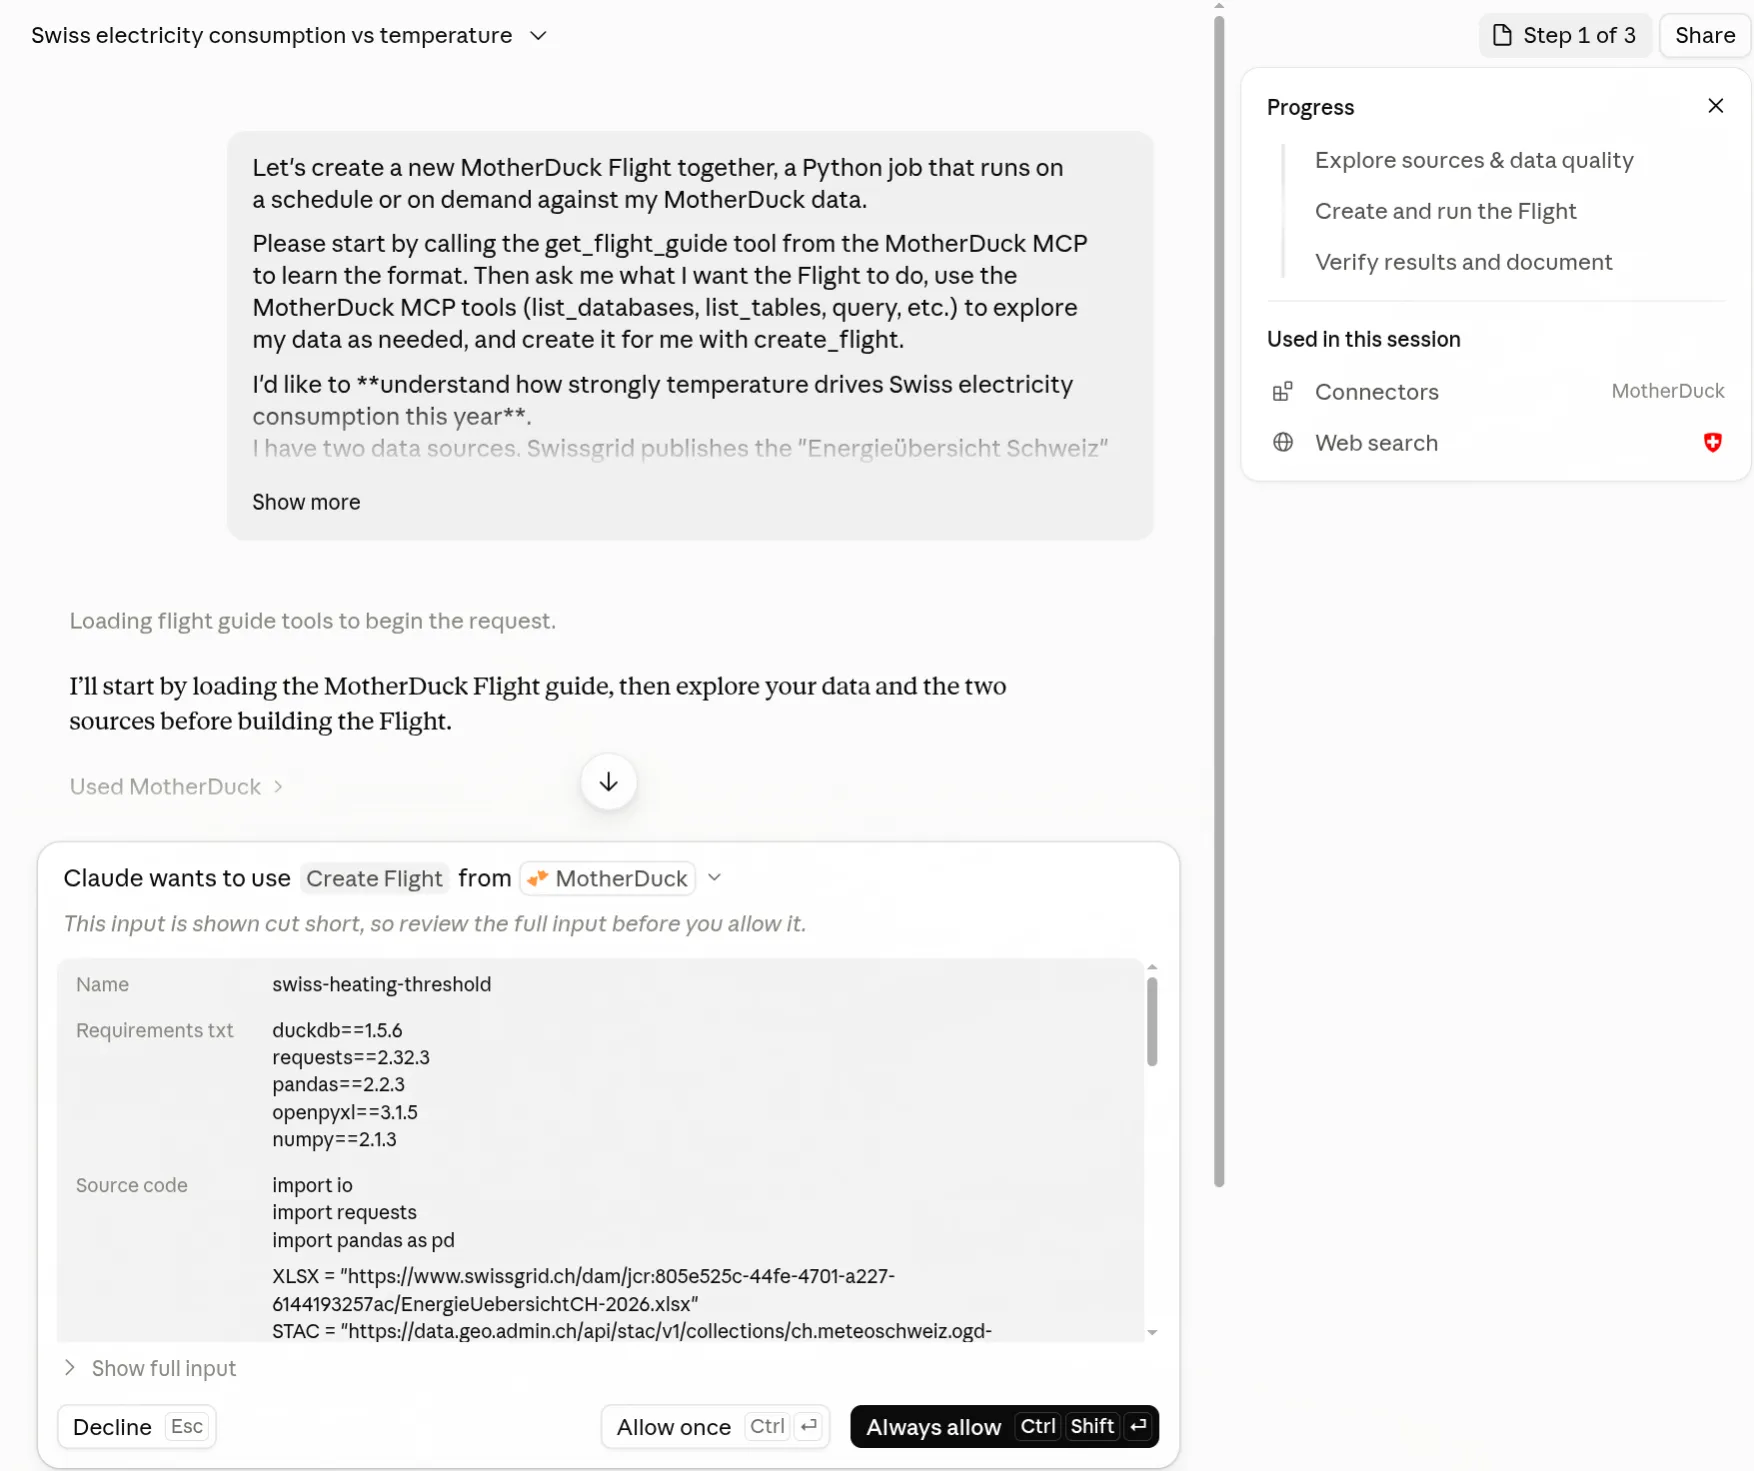
It asks us to create a Flight (a data pipeline in MotherDuck, you see it uses Python with DuckDB, requests, pandas, openpyxl, and numpy). Let's go ahead and allow always. Next, it asks 'to run flight'. Allow always again.
After a couple of minutes, and many iterations by Claude + MotherDuck and the tools mentioned above, it created a first overview within Claude:
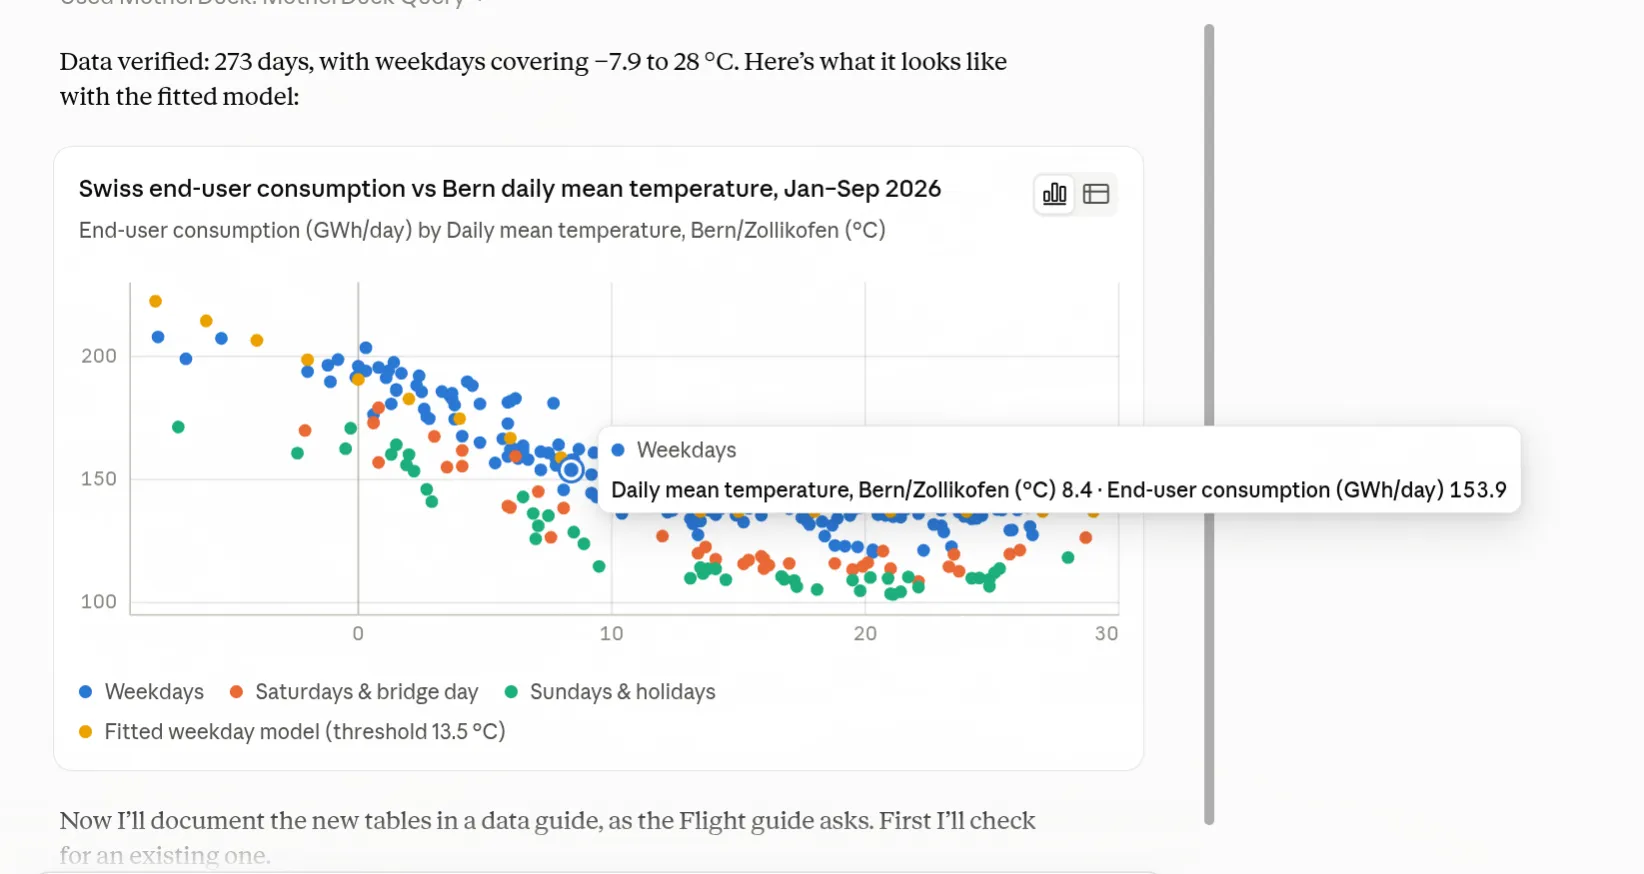
It goes on to verify the data. As with all things data, if the numbers are wrong, any dashboard or insight is useless, or even worse, dangerous.
Artifacts It Generated in MotherDuck Flight (ETL Pipeline, Visualization)
The cool thing is, all of this is now in MotherDuck. Let's explore how this looks before we prompt 2-3 more advanced queries.
Let's start with the newly created ETL pipeline called Flights. We get all the Python code in main.py, we can see the logs, configs, and requirements.txt (all Python modules used), and on the right we see previous runs and versions, and we can edit or re-run:
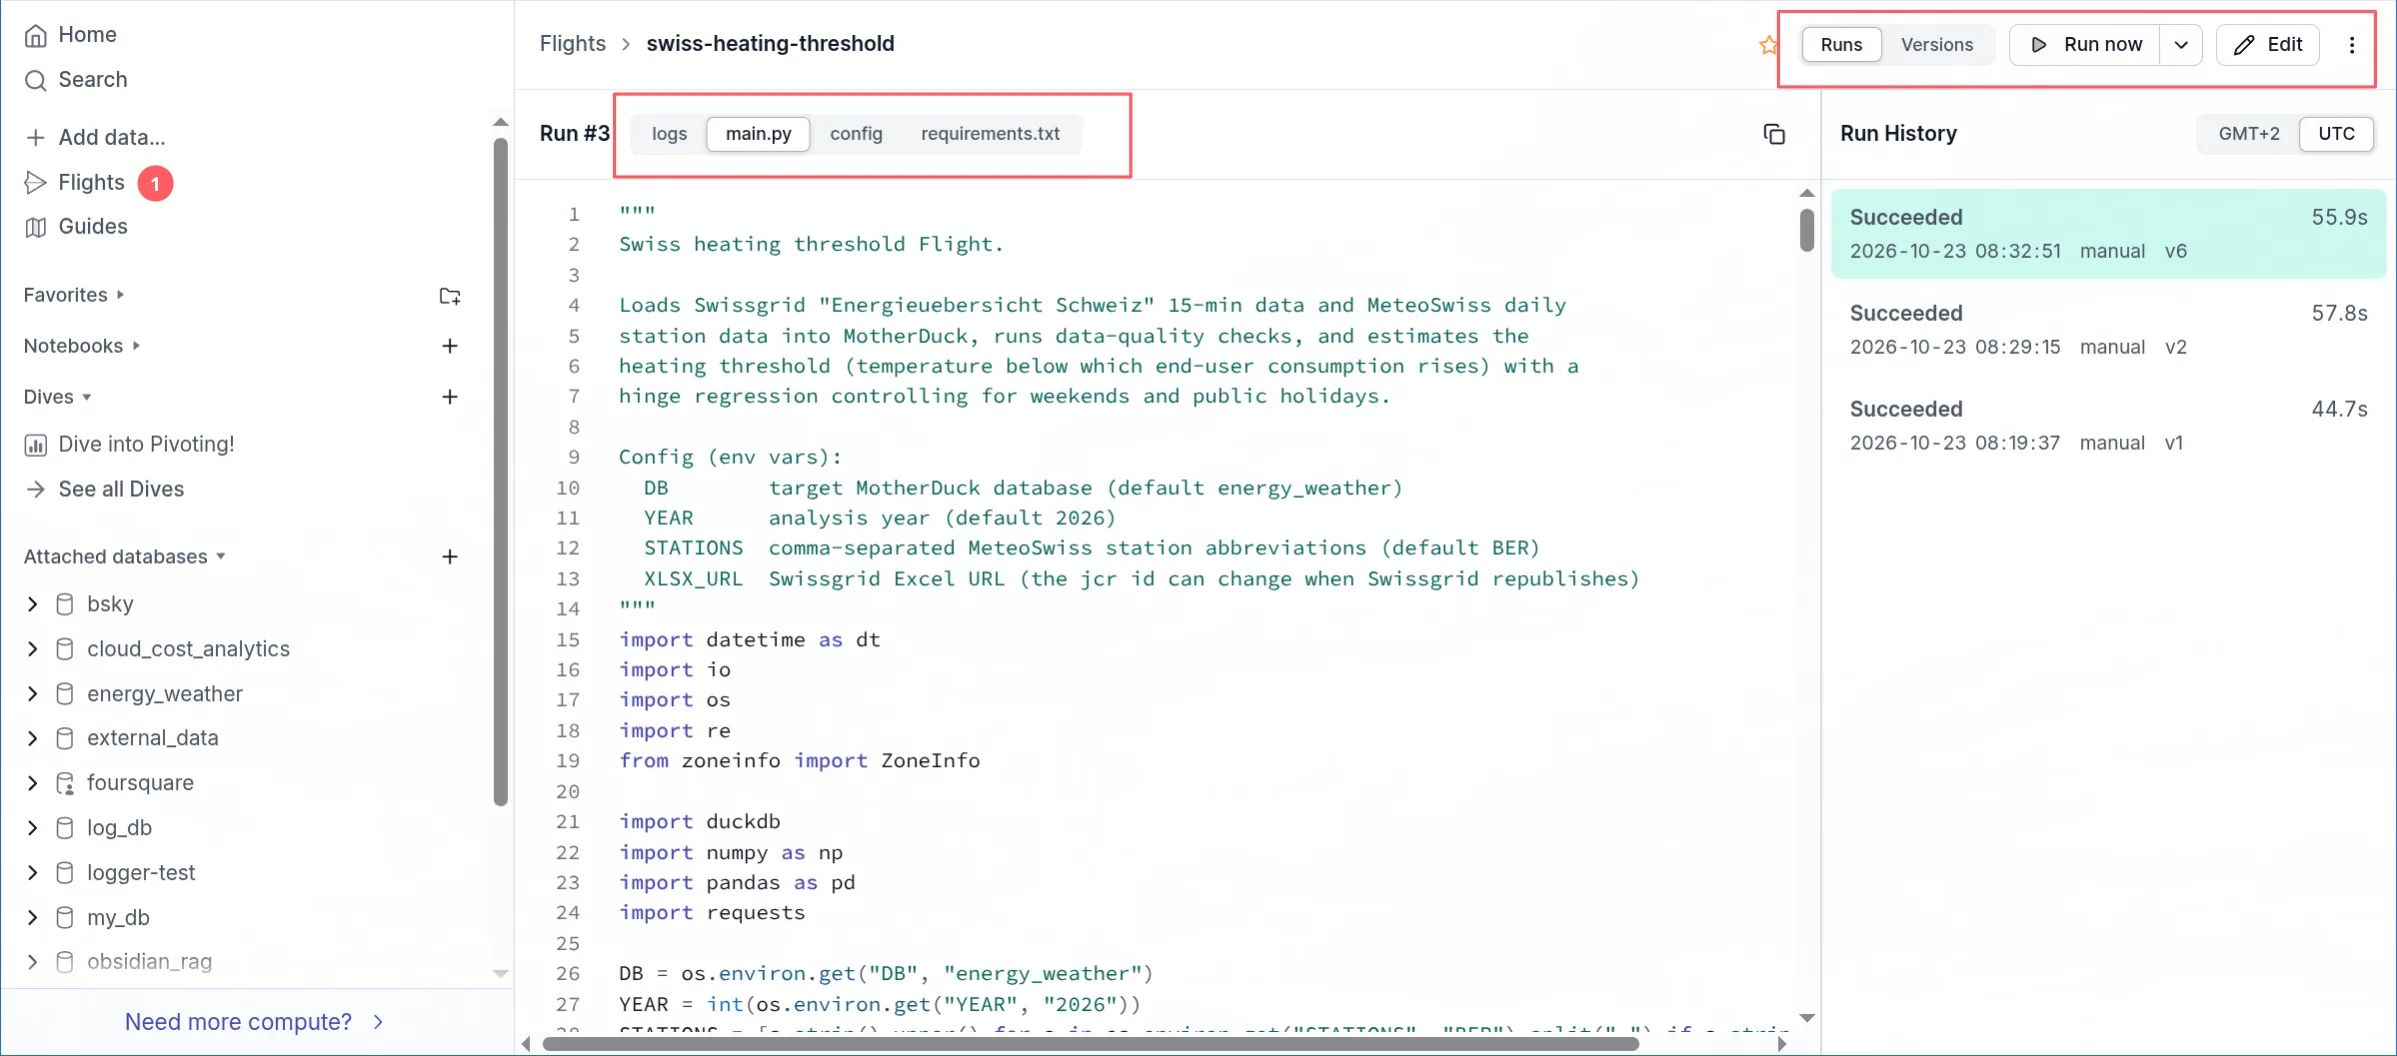
Editing inside the Web UI looks like this:
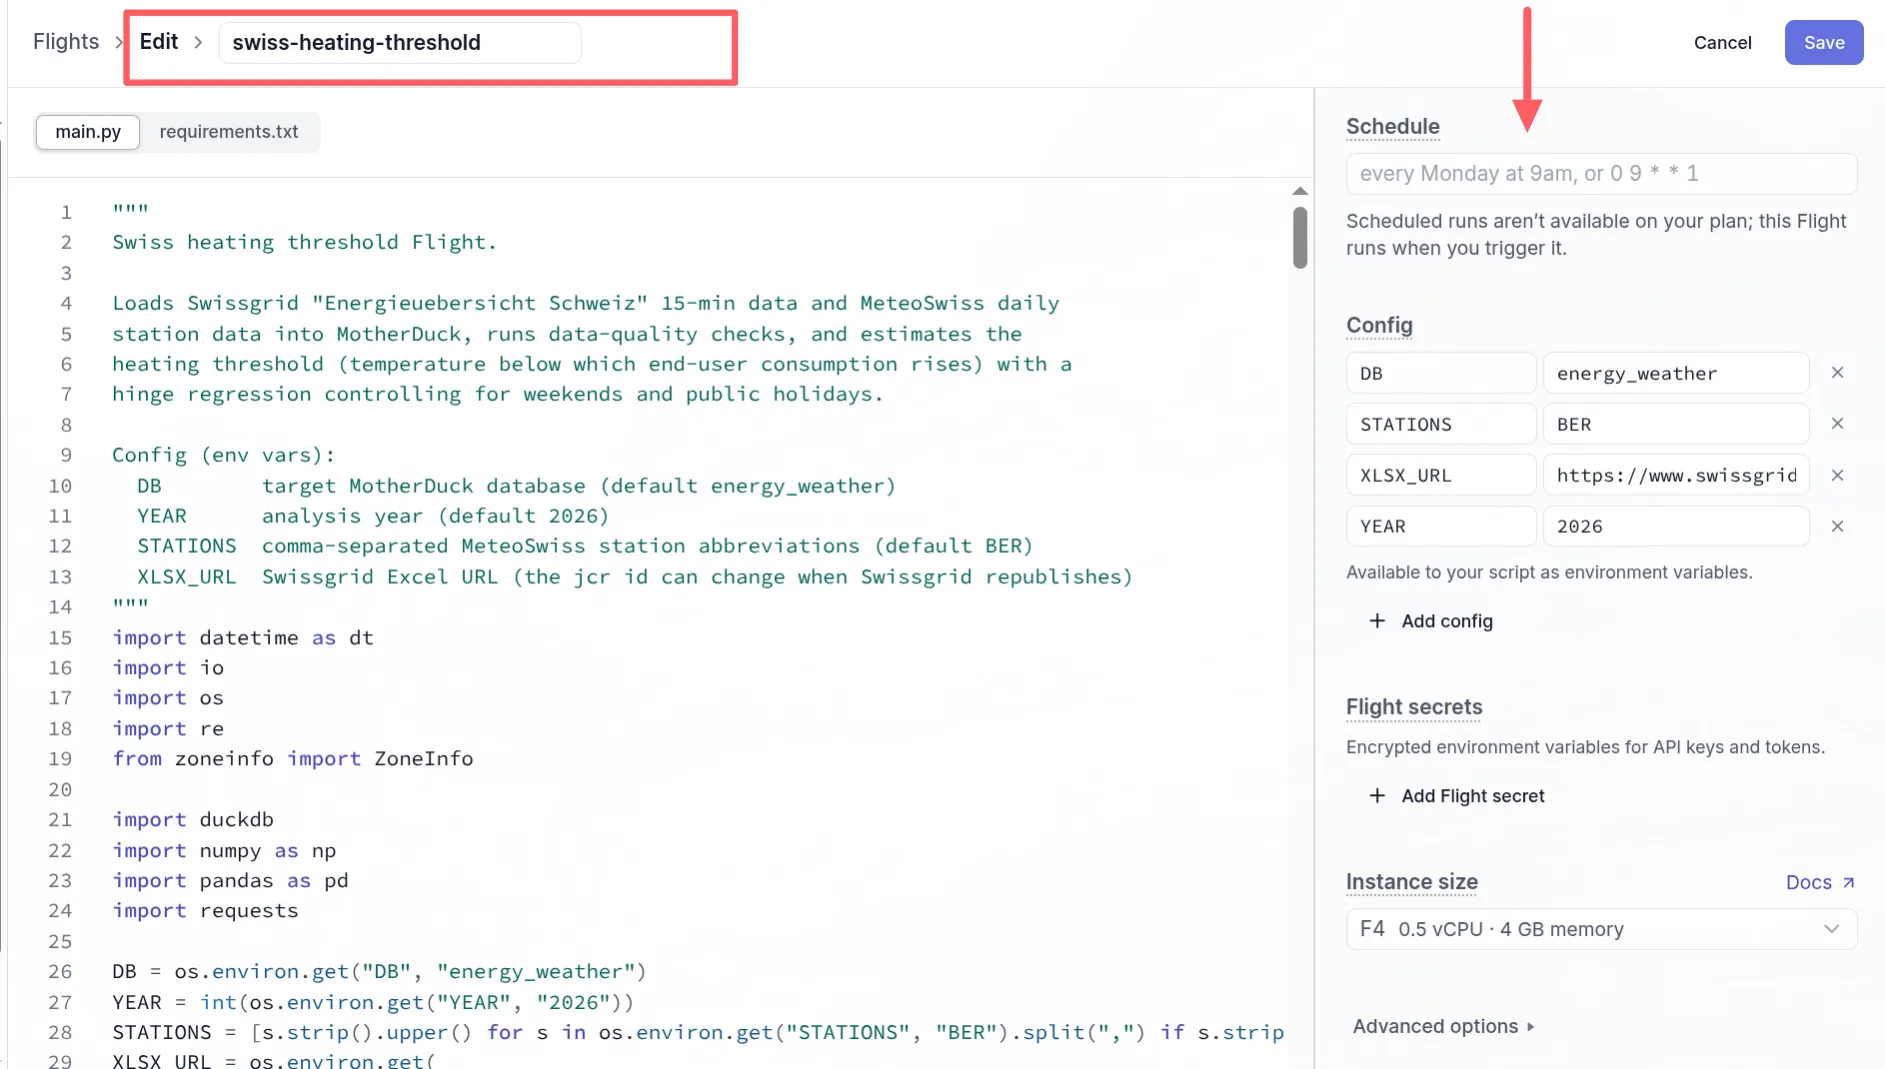
Remember, I didn't say anything about it. That's the model thinking as well. As a domain expert, I might tweak this, as it's not relevant, or add more holidays based on different cantons (different states in Switzerland have different holidays):
Copy code
def holidays(y):
e, D = easter(y), dt.timedelta
return {
dt.date(y, 1, 1): "Neujahr",
dt.date(y, 1, 2): "Berchtoldstag",
e - D(2): "Karfreitag",
e + D(1): "Ostermontag",
e + D(39): "Auffahrt",
e + D(50): "Pfingstmontag",
dt.date(y, 8, 1): "Bundesfeier",
dt.date(y, 12, 25): "Weihnachten",
dt.date(y, 12, 26): "Stephanstag",
}
It Also Created a Guide (Markdown Notebook Overview)
On the left, you find them in MotherDuck, and you see a list of Guides, a Markdown Notebook overview of what it did:
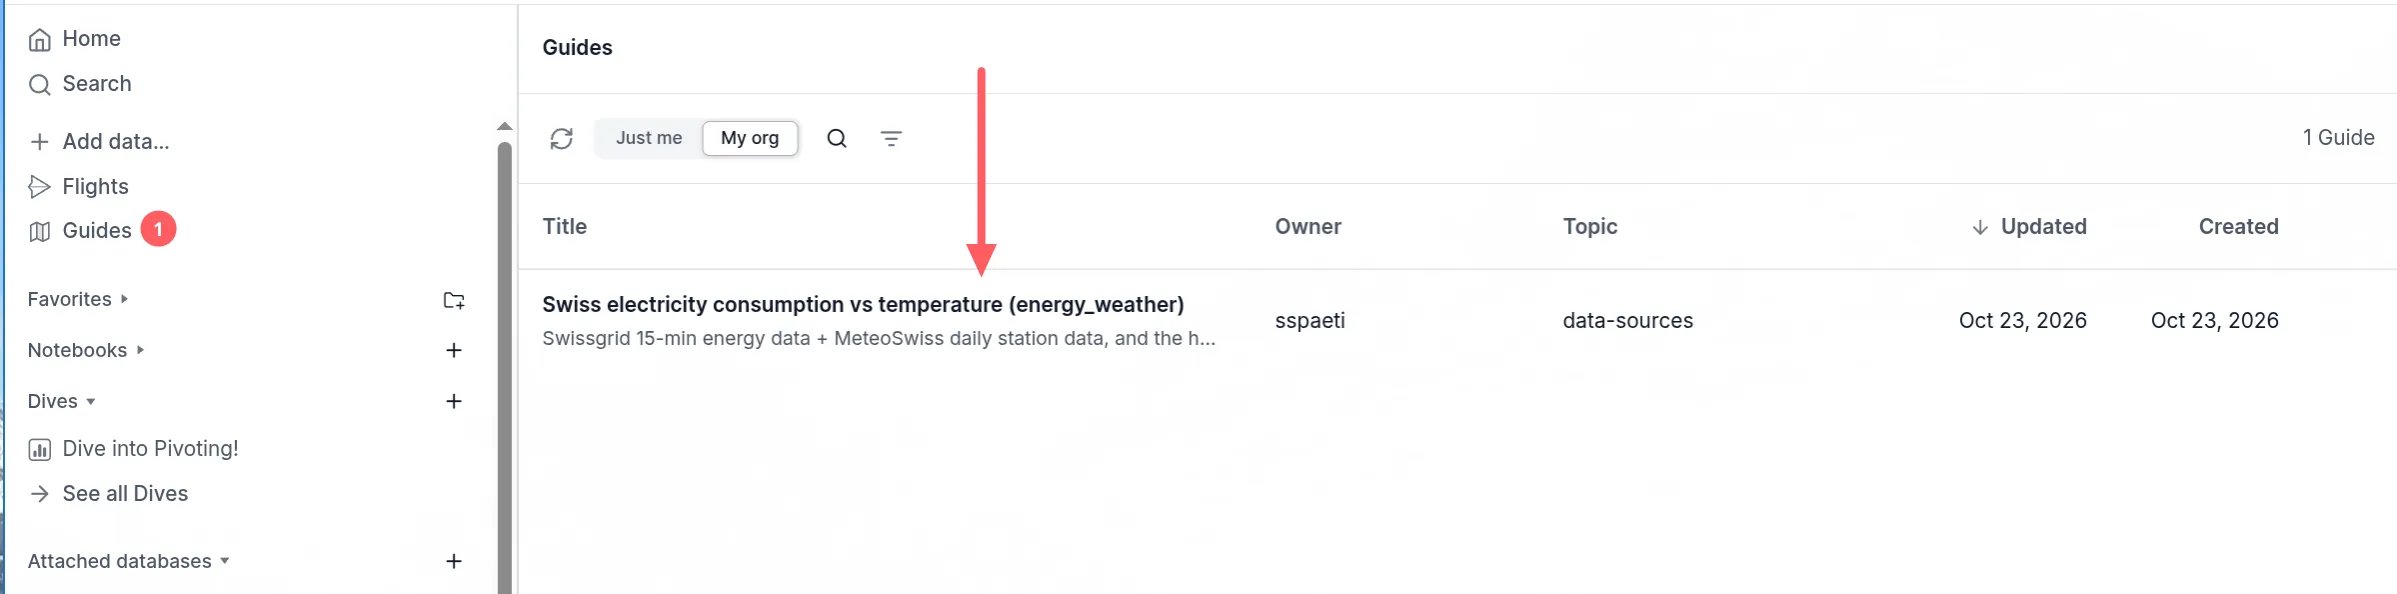
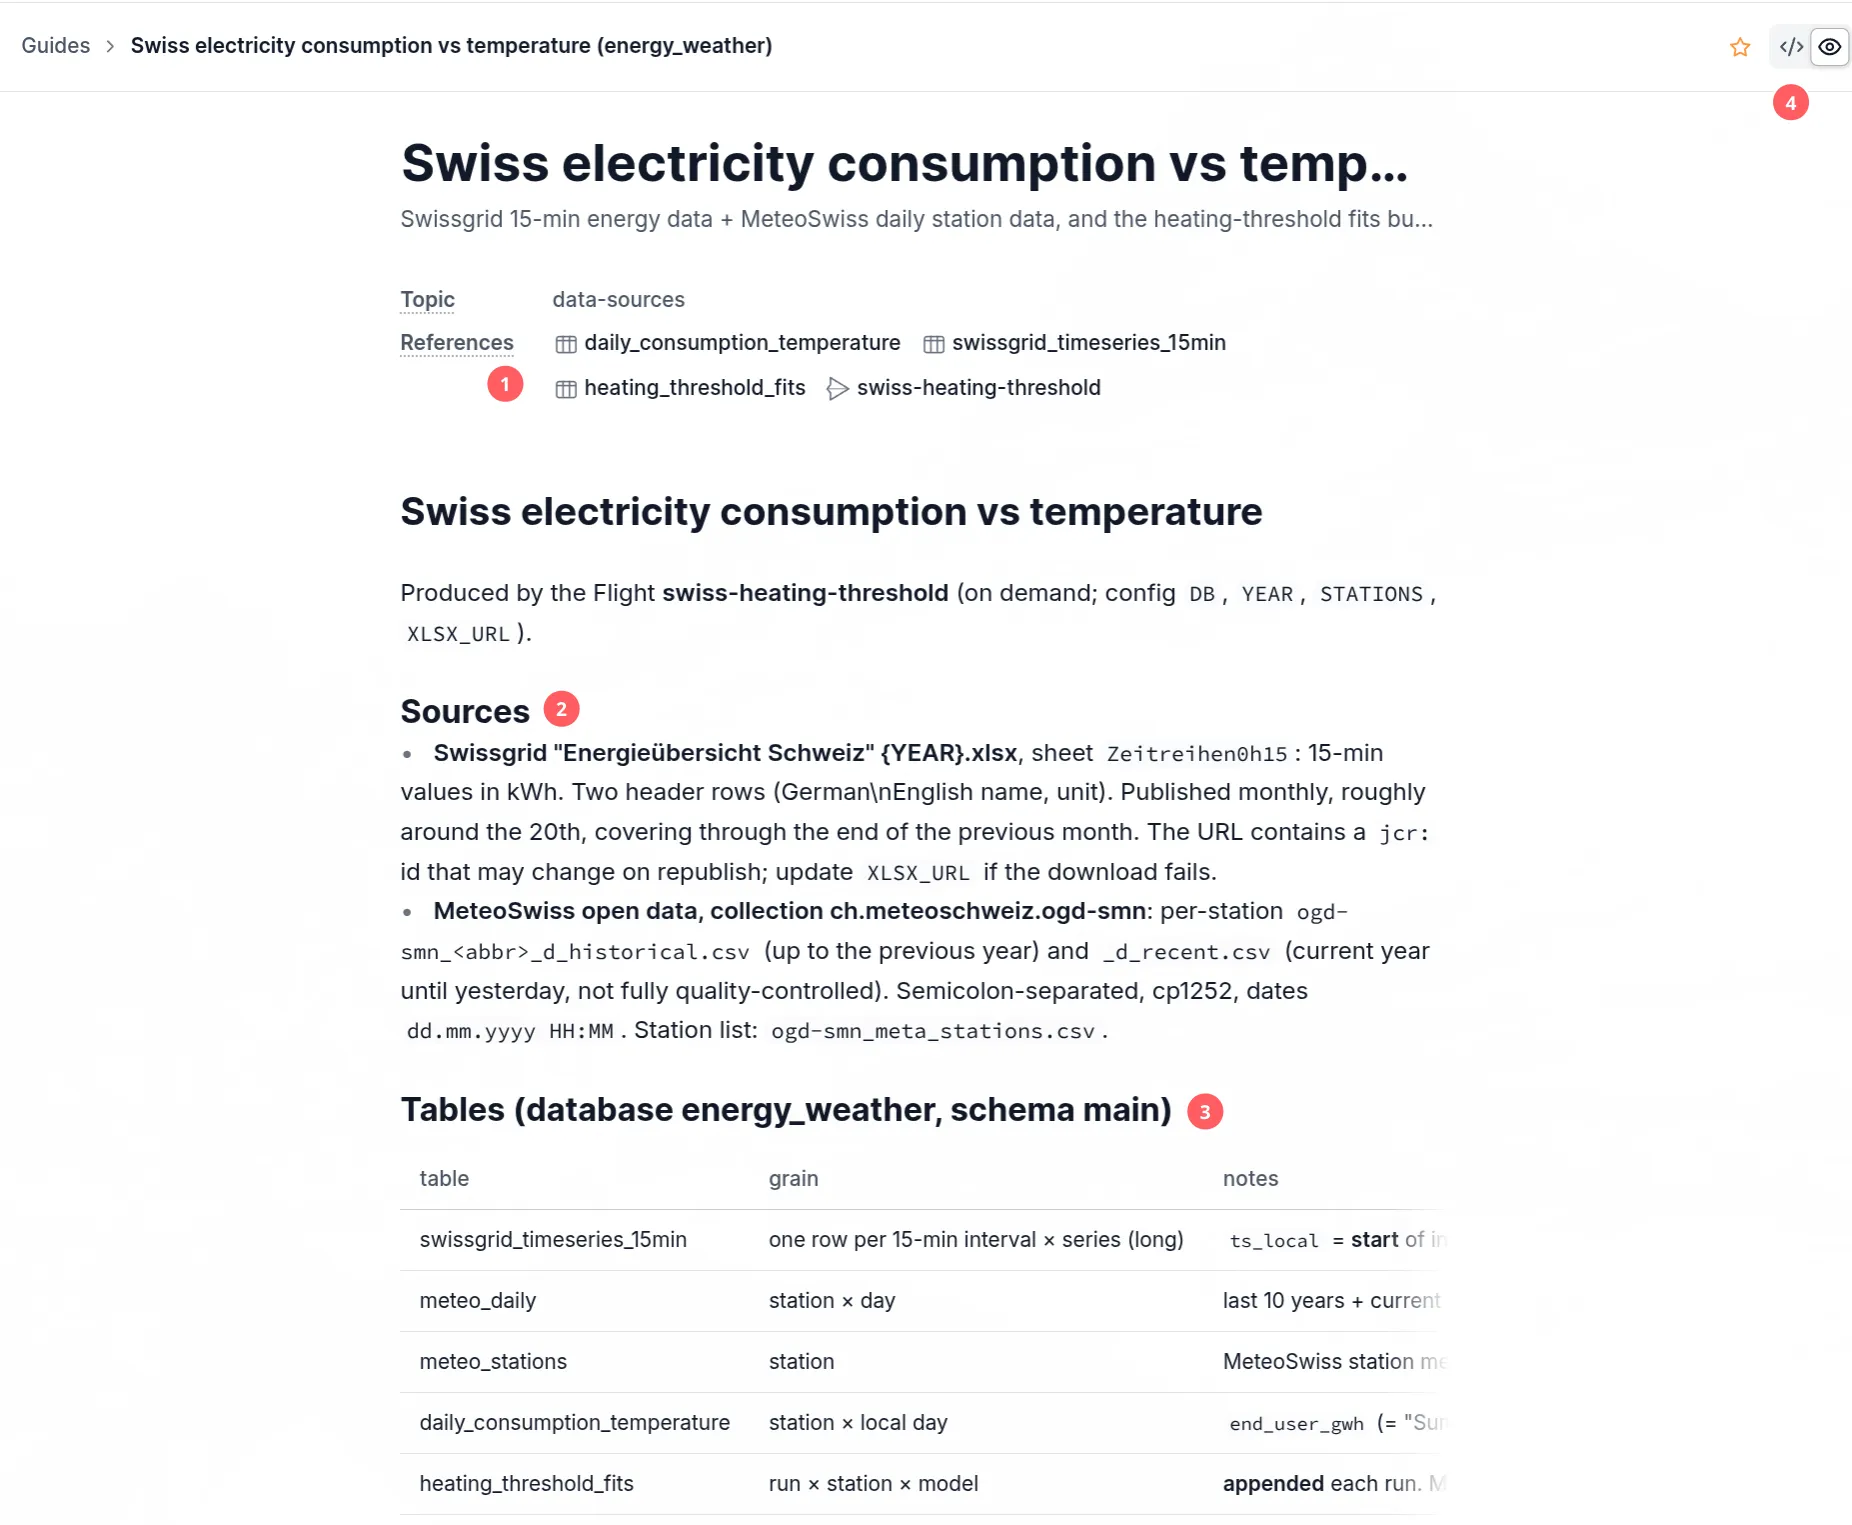
Clicking on the generated one, we see all the data artifacts (tables, 1.) referenced, and it states the source (2.) used, and explains what it created (3.). You can also see the source of this (4.), which is Markdown:
What the Agent (Claude in This Case) Found
Now that Claude has run successfully for the first prompt, let's see what it found on top of the artifacts created:
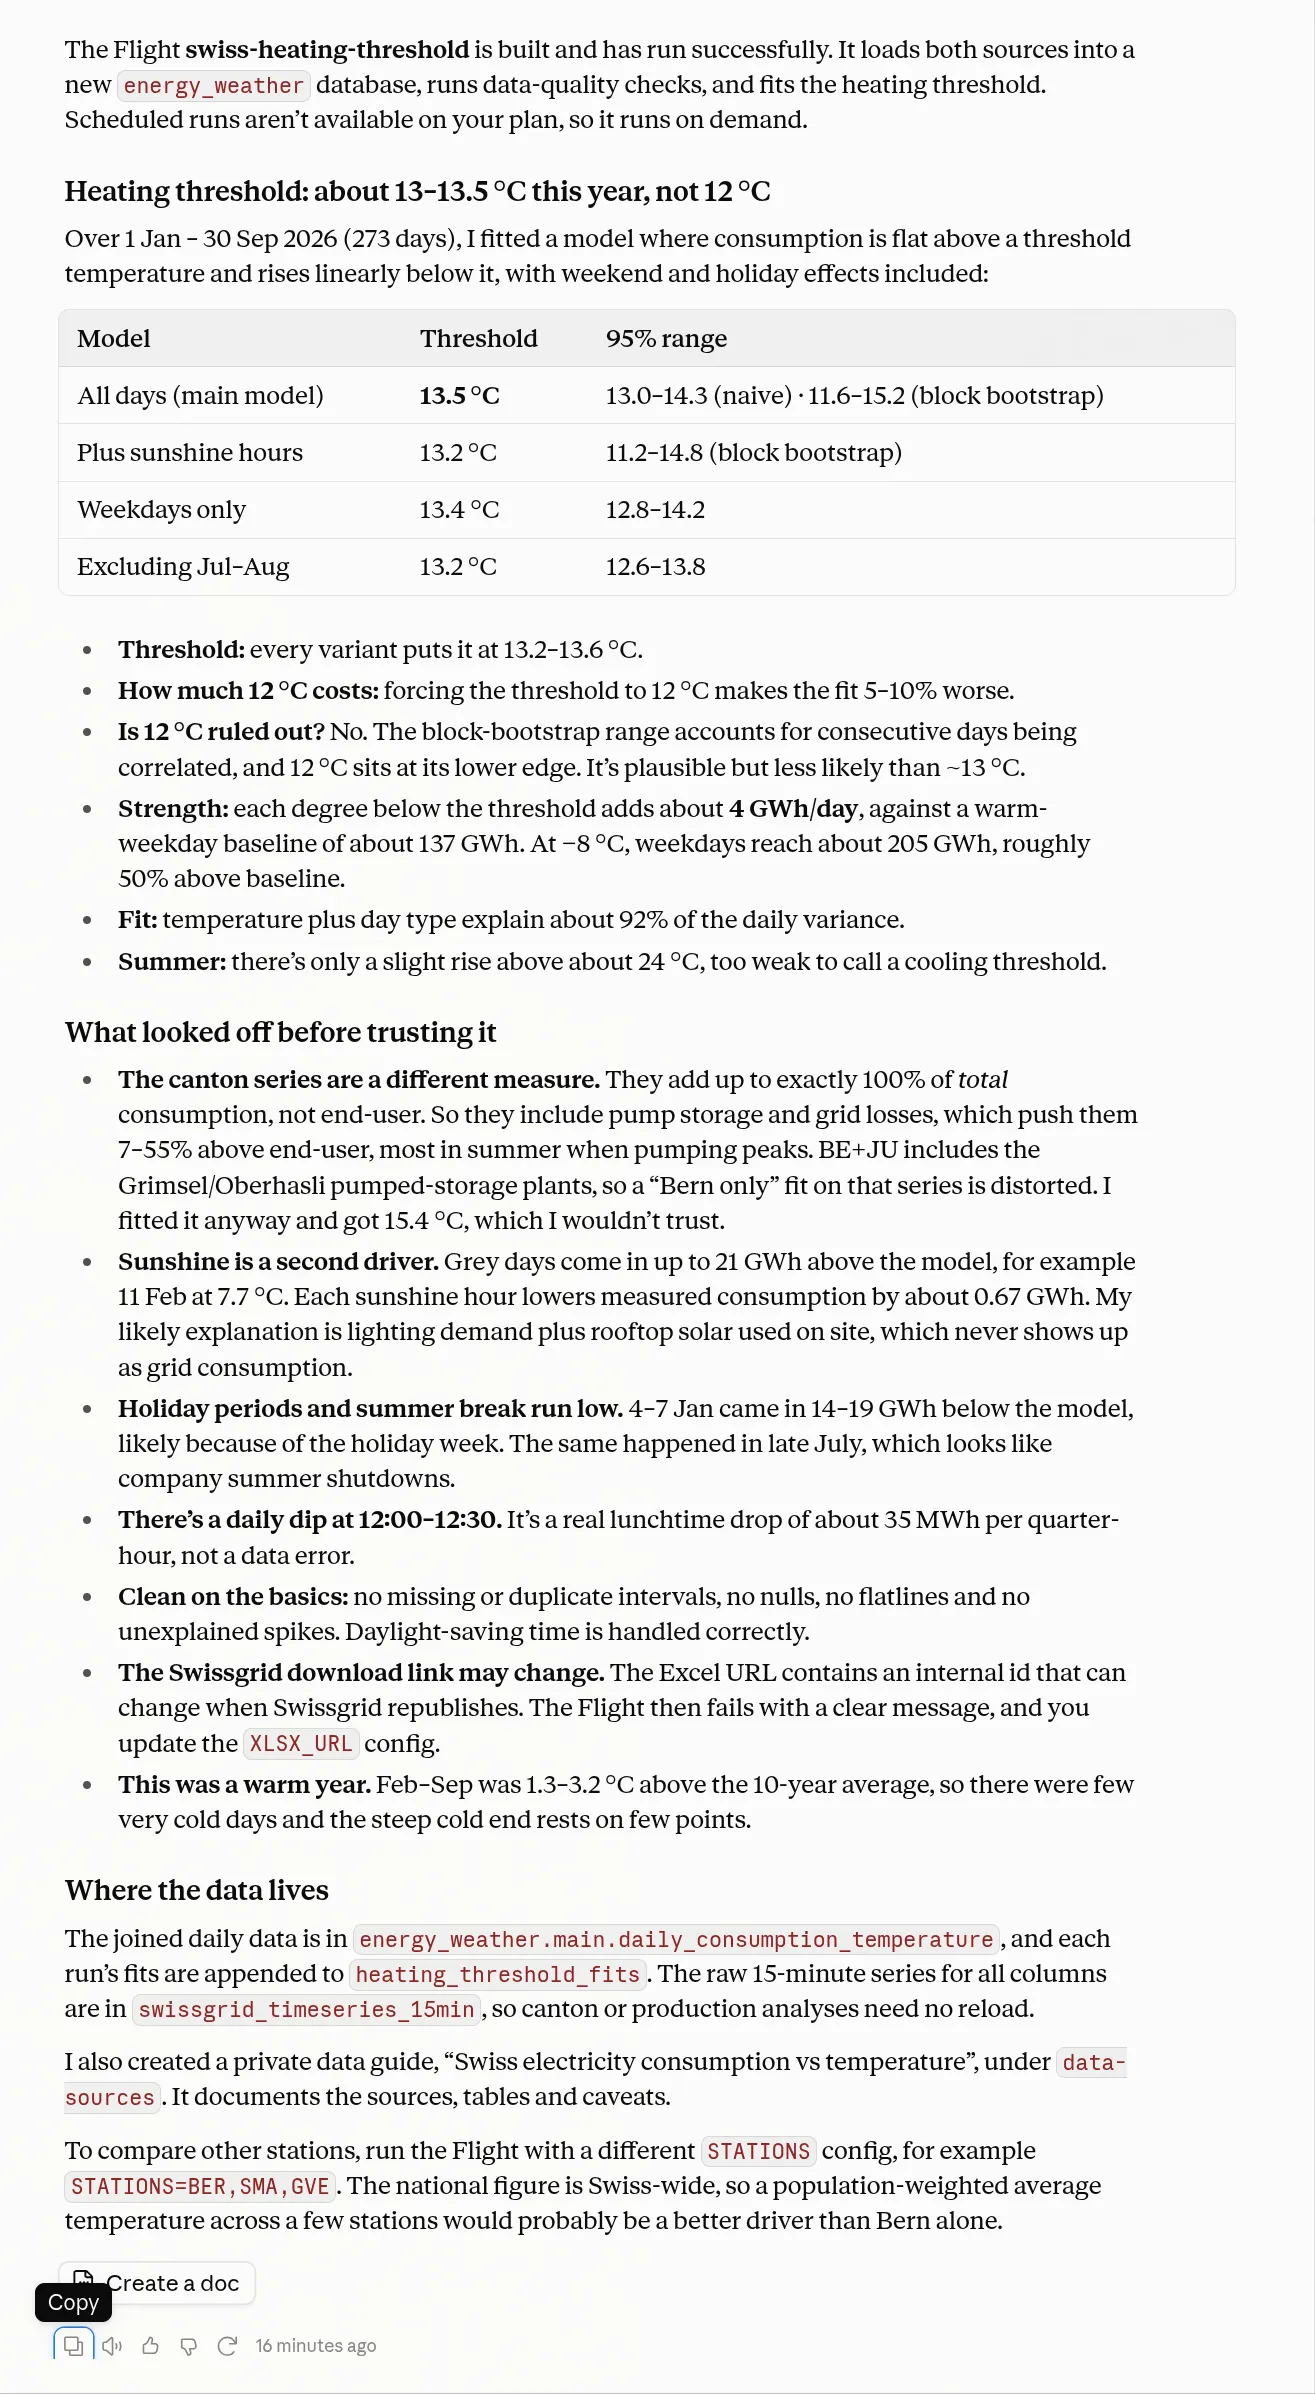
So there are a lot of insights, some of them quite basic, such as holiday and public holiday periods running low, but this is now backed with actual numbers and data. Interestingly, Feb-Sept was 1.3-3.2°C above the 10-year average.
Remember, that was just one prompt, and we didn't specify a lot. Now we can take it from here and go on.
Follow-Ups: More Advanced Queries
That's what we do now. We want to ask follow-up questions, and that's really where the beauty is. Also, we'd need to follow up and really check if all is correct, which is also much easier to do, as everything we have is in code, the tables are physical, plus we can also just prompt more questions if we are unsure about a number. As we are the domain expert, we'd know immediately which number is off.
Verify Before Trusting
Unfortunately, in real life, I'm not an expert on this topic, so I have a hard time classifying the result. We'd need an actual expert. But what we can do is re-prompt to ask the model to verify. I did it with:
13.5 °C is above the 12 °C we use on the desk, and you said 2026 was a warm year. Before I show this to anyone: is the threshold shift real, or an artefact of a warm year? Swissgrid's 2025 file is here: https://www.swissgrid.ch/dam/jcr:bbbbadc6-3656-4dfe-b81e-bbb9ad01be79/EnergieUebersichtCH-2025.xlsx. Redo the fit for 2025 and tell me if we land at the same threshold.
The verification said:
Yes, the shift is real, not a warm-year artefact. In 2025, which was close to normal, the same method gives an even higher threshold than in 2026. Bern only (your original question):
| Same window, 1 Jan – 30 Sep | Threshold | 95% range | Fit at 12 °C vs best |
|---|---|---|---|
| 2026 (warm year) | 13.5 °C | 11.6–15.2 | 9% worse |
| 2025 (near-normal year) | 14.2 °C | 13.2–15.4 | 20% worse |
Consumption-weighted temperature:
| Same window, 1 Jan – 30 Sep | Threshold | 95% range |
|---|---|---|
| 2026 | 14.2 °C | 12.4–15.2 |
| 2025 | 15.1 °C | 14.0–16.0 |
More pointers
- The two years agree. Each year's estimate falls inside the other's range, so they point to the same answer: about 13.5–14.5 °C at Bern.
- 12 °C doesn't hold up. It sat at the edge of the 2026 range. In 2025 it's clearly outside, and in neither year is it the best fit.
- 2025 is a fair test. At Bern, Jan–Sep 2025 was within −1.1 to +2.2 °C of the 10-year normal each month, mostly within ±1 °C. 2026 ran +1.3 to +3.2 °C warmer from February on. The warm year actually produced the lower threshold, the opposite of what an artefact would do.
- The rest of the model is stable. Each degree below the threshold adds 3.8 GWh/day in 2025 and 4.0 in 2026. The warm-weekday base rose from 134 to 137 GWh/day.
Full-year 2025 isn't the number to quote. It gives 15.2 °C at Bern, but 22–31 December runs 15–29 GWh/day below the model. The model doesn't know about the Christmas shutdown, so those cold days pull the threshold up. Same-window comparison is the fair one.
So we see, it corrected itself. That's why it's always worth verifying manually or just asking another question, to understand better what the number means, taking some samples, and then re-running some automated tests or following up.
Here it found a bug with the timestamp:
The 2025 file stores timestamps as text (
13.01.2025 00:15), while 2026 uses real Excel dates. My first 2025 run read 5 March as 3 May and lost 61% of the rows. I cancelled it before it wrote anything. The Flight now parses dates only in that explicit format, and stops before fitting if a timestamp fails to parse, a day is missing or time runs backwards. The 2026 results aren't affected: that file has proper dates and passed every completeness check. I've recorded this in the data guide.
What Did We Learn?
What did we learn? All of this goes to show that real insight and business knowledge are still king (and probably will be forever), wherever you work. Someone needs to take responsibility and have the conviction to drive an issue or a point, and that will always be the domain expert on a topic. Also, all of these "triggered verifications" are non-deterministic, so if you run it 2-3 more times, it might find different bugs or things to fix, which again shows that models are best used with a human in the driver's seat.
Let's See It on a Map: Spatial Joins, Polygons, and Map Visualization
But now let's do some more fun analysis. Let's put it on a map. All data must land on a map to be a proper data analysis, right? 😉
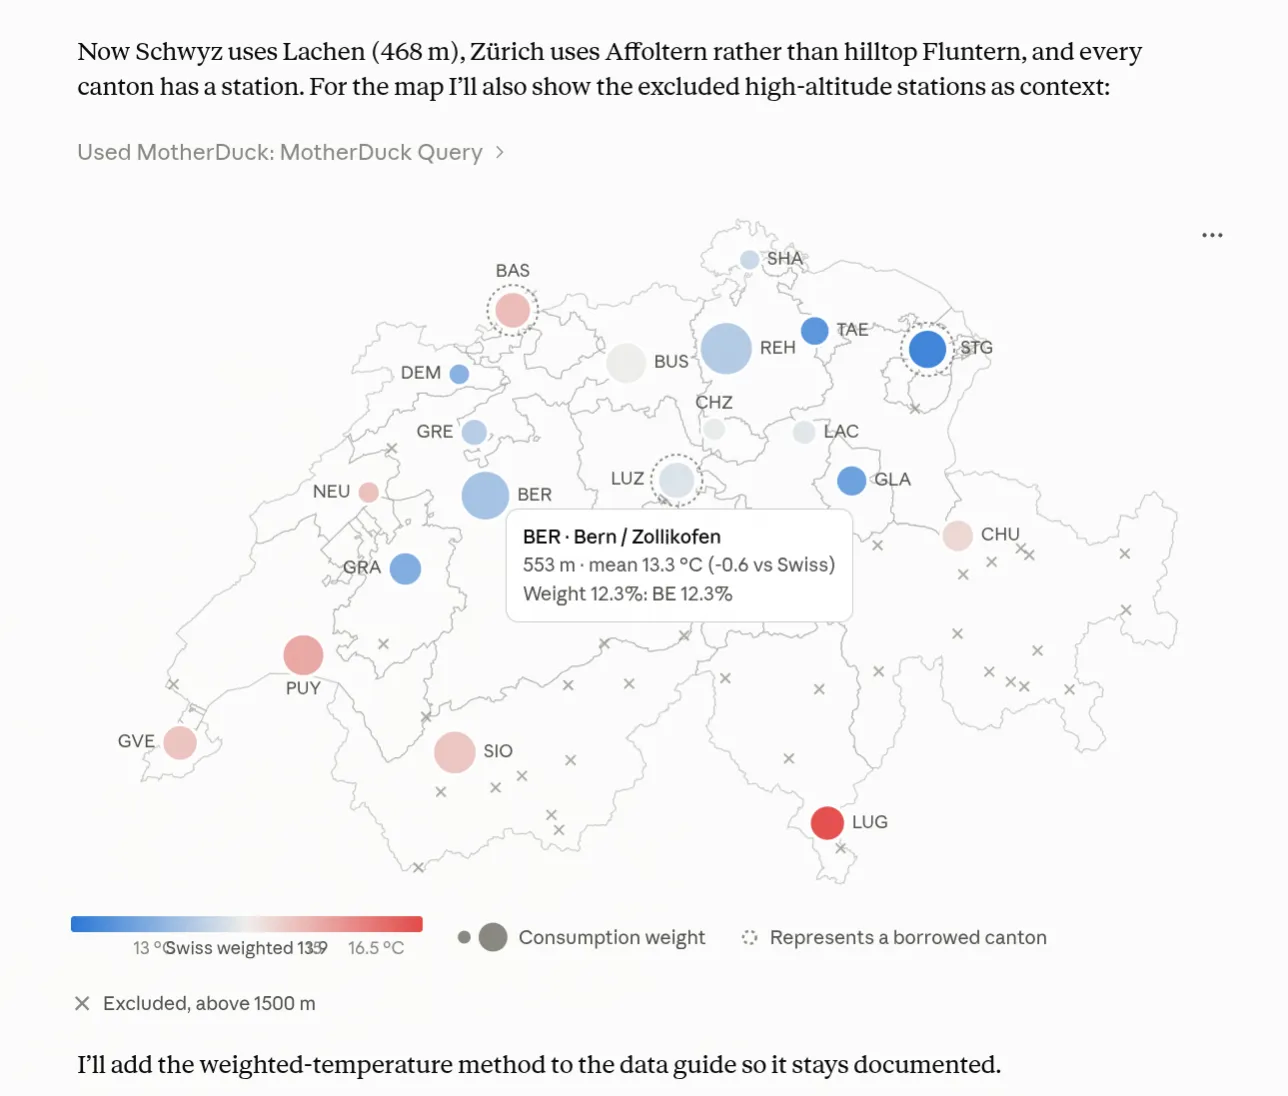
As it suggests during the process, we do weighted temperatures across stations. As I want to see it on a map with GIS capabilities (as I know there is longitude and latitude data in there), we can prompt:
You suggested a weighted temperature across stations instead of Bern only. Agreed. Use one representative station per canton, weight each canton by its share of consumption in the Swissgrid canton columns, and skip stations above 1500 m, nobody heats a home up there. Then show me the stations on a map of Switzerland with the canton outlines, coloured by this year's mean temperature. Canton outlines you can take from here: https://raw.githubusercontent.com/codeforgermany/click_that_hood/main/public/data/switzerland.geojson
Note: the outlines are rough, trust the canton column in the station list.
The outcome looks like this inside Claude:
And the response:
With the consumption-weighted temperature, the heating threshold comes out at about 14 °C, so 12 °C fits even less well than with Bern alone. The Flight now builds this temperature on every run, and the map above shows the 22 stations it uses.
| Temperature driver | Threshold | Bootstrap 95% range | R² | Fit when forced to 12 °C |
|---|---|---|---|---|
| Bern only | 13.5 °C | 11.6–15.2 | 0.924 | 9% worse |
| Weighted, full-year weights | 14.2 °C | 12.4–15.2 | 0.936 | 19% worse |
| Weighted, Jan–Feb weights | 14.1 °C | 12.4–15.2 | 0.935 | 18% worse |
| Weighted + sunshine hours | 13.7 °C | 12.0–15.0 | 0.947 | 12% worse |
Outcomes:
- Better fit: the weighted temperature explains consumption better than Bern alone, with R² rising from 0.924 to 0.936.
- 12 °C: it now falls outside the plausible range unless sunshine is in the model, and even then it sits at the edge.
- Why the threshold rose: the weighted temperature runs about 0.6 °C warmer than Bern on average, because Geneva, Lausanne, Basel, Sion and Lugano carry real weight. That explains most of the shift.
- What the threshold depends on: the threshold depends on which temperature you measure against, so compare it with your 12 °C rule using the same temperature reference. If your 12 °C rule comes from the Swiss heating-degree-day convention (20/12), that's a building-standard definition rather than a fitted value, which would explain part of the gap.
And so on... you see, it found another gap, and depending on the data being correct or not, we can now take new directional steps, which we didn't know beforehand, maybe even as domain experts. The data is always different from what we think.
The insights are interesting, but we want to focus on the features and the workflow here (if you are interested, you can always run it yourself with one prompt :)
I asked Claude to create a Dive in MD for me:
Can you create the map inside MotherDuck Dives please?
This is the interactive Dive within MotherDuck, ready to share with the team, versioned and able to change status. Nice, isn't it?
Also available in the dive gallery.
You get a presentation link that you can share now with the team.
Lastly: Automate, Real-Time Query, Create a Dashboard, and Automate It
This would be the last query. After everything is verified and looking good, you want to have it updated automatically, and you want a dashboard to share with a link.
This could be a prompt for the above:
What's Bern doing right now, has it dropped below 13 °C in the last 24 hours? I want the 10-minute values, not daily averages.
Then put everything into one dashboard for the trading desk: the threshold chart, the map, and the live Bern temperature at the top. Add a button that pulls fresh data, and make it update itself every morning at 7 before the desk opens.
The outcome:
Yes. Bern has been below 13 °C for the entire last 24 hours: all 144 ten-minute readings.
- Now: 8.6 °C at 12:00 today, warming from the overnight low.
- Closest it came: 12.4 °C yesterday around 13:00–14:00.
- Overnight low: 3.3 °C between 02:00 and 04:00.
- Last time at or above 13 °C: Tuesday 20 October at 18:30.
The dashboard is ready: 'Trading desk: weather and Swiss power demand'. Its data queries return correct live values; I couldn't see the rendered page itself, so give it a quick look before the desk does.
This is the dashboard, with the above map at the bottom:
 Dashboard with the live Bern panel at the top, the threshold chart, the station map, and two buttons: pull fresh data and full rebuild. It auto-refreshes daily, Monday to Friday. See public Dive and interactive dashboard.
What Else You Can Do: Pivot Tables
The power of this approach is also that now you have the data, the code, and everything inside MotherDuck in the format of a DuckDB database, and the transformation from the source is directly in plain Python code, meaning you can run it anytime and update the link to a newer source.
But you can also explore the data further, as we have it in MotherDuck, doing the classic Pivot Table analysis. It seems old-fashioned, but domain experts love using it to explore the data interactively:
 Pivot table of power in kWh per canton (state) in Switzerland.
Many have added pivot tables to their suites: DuckDB with the pivot_table community extension for Excel-style pivots, MotherDuck with the "Dive into Pivoting" Dive, Rill with its own pivot table, Cube through its Google Sheets and Excel integrations, Coginiti with a pivot mode in the grid. Even pandas has had pivot_table all along.
Recap and Conclusion for Doing Agentic Data Analysis as a Domain Expert
So we learned that even if the data is quite large (a 50M-row direct historical query for a 10-min history of the city of Bern) over the web, the agents with the MCP setup can handle it, do the pipeline, and visualize it.
Things we might do:
- Show GIS or maps, which usually is not easy, and here you just chat.
- Under the hood, there is a GIS data type you don't need to know about.
- The data is quite large, but MotherDuck/DuckDB handles it.
So if we look at the five steps we had initially defined, we went through these steps:
Also, not everything is perfect. Claude might create new databases or tables instead of using the same one and unifying it:
 So you still need to be driving the prompts, and checking what it says if it can't reach a source or doesn't have data. To me, it helps to read the thinking prompts, as this helps me understand what it does, and if it goes in the wrong direction, I can see it and course-correct early.
So we used these five simple steps, and iterated:
- The data: three sources, three formats, zero downloads.
- MeteoSwiss weather stations as CSV on data.geo.admin.ch (159 stations, 10-minute to yearly files,
nowrefreshed every 10 minutes), Swissgrid's monthly Excel over HTTPS (15-minute load profiles), and a cantons GeoJSON for the map. - All we did was paste URLs into the prompt, plus what only a domain expert knows: which column is end-user consumption, that Swissgrid groups BE with JU, that
tre200d0is the daily mean temperature.
- MeteoSwiss weather stations as CSV on data.geo.admin.ch (159 stations, 10-minute to yearly files,
- Read or import: we never decided, the agent did.
- It built a Flight that loads both sources into one
energy_weatherdatabase, keeps the raw 15-minute table, joins a daily table, and appends each fit to a history table. The live 10-minute file it just queried directly. - Full load, incremental, grain, partitioning: all the classic data engineering questions were answered by the agent reading the file naming (
historical,recent,now), not by us.
- It built a Flight that loads both sources into one
- Ask questions: one prompt, one number, then verify.
- "Where does the heating threshold sit?" came back as 13.5 °C instead of the assumed 12 °C, with a fitted model, confidence ranges, holidays and sunshine as side effects.
- The data-quality findings were the real value: canton columns measure total consumption including pump storage, the 2025 Excel stores dates as text and silently dropped 61% of rows on first read, and the threshold depends on which temperature you measure against.
- One verification prompt with last year's file confirmed the result. The expert challenges the number, the agent reruns the pipeline.
- Visualize: a map in one sentence.
- Spatial join of stations into cantons, consumption-weighted temperature across 22 stations, rendered as a Dive with the canton outlines, the threshold chart and a live Bern panel, shareable by link.
- Under the hood: spatial extension,
ST_Read, D3 projections. None of it visible to the user.
- Auto-update: a button and a schedule, then hand over.
- The Dive got a "pull fresh data" button that runs the Flight, and a daily weekday refresh before the desk opens.
- What stays with the data team: the Swissgrid URL carries an internal id that can change, runs are non-deterministic and find different bugs each time, and the agent happily creates a second database instead of reusing the first. Someone has to own that.
It's an iterative loop, where we do not need any technical knowledge whatsoever. We only need to know where the sources are, and it helps when we understand the data, the hidden, the unspecified. The loop we went through:
The big advantage: we can start querying and asking questions from the get-go, and we can iterate to improve data quality based on real feedback and data points. This was unthinkable just a few years back, but today we have this luxury, and we should use it.
Again, it's not all roses, but I think as a domain expert and less technical person, this is the dream we always had. Integration into the organization, applied and org-wide rules and governance, and access permissions are all things that remain to be solved, and a challenge that will stay ahead after this initial, iterative insight creation.
Your Turn!
Try it yourself, for example with the same data. Maybe you could try an alternative persona, focused more on skiing for example, asking something like:
Ski resort / tourism manager: "Which of our 5 resorts had the most days with fresh snow and sun in January, and how did that compare to 2019?" Uses
htoautd0(snow depth 6 UTC),sre000d0(sunshine),historicalfiles back to 1864. Drops the Excel though, so weaker for step 1b. The energy persona keeps all three sources.
Try it yourself, and get a feel for it.
Given MotherDuck is designed as a backend to run AI queries and get feedback fast for fast iterations, there are also other options. There are multiple different ways you could approach this and connect your agent of choice to other platforms. Here are three alternatives:
- Use local DuckDB + Claude: connect Claude Desktop or Claude Code to a local DuckDB file through the open-source DuckDB MCP server, and use the DuckDB UI (
duckdb -ui) as a notebook or the new Claude Dashboards (renamed to Claude Data) features. If you use local DuckDB, it stays local on your laptop. You lose scheduling and sharing, and you're limited to what your machine can handle. - You could use a notebook-first approach with Hex that includes an AI agent that creates similar analysis apps and connects to most warehouses.
- A third option would be to use your existing warehouse's agent at your company, such as Snowflake Intelligence, Databricks Genie, BigQuery with Gemini, or Microsoft Fabric. If your company already runs one of these, governance and permissions are already solved. You might do more work on connecting to the agent of choice, or on semantics to start asking questions.
Whichever you pick, the lesson stays the same: AI as the workflow improvement tool translates and does the bulk of the work, and you bring the business knowledge.
Also check out the new "Dive Apps" that elevate your dashboard to applications and allow write-back capabilities. This feature is a huge plus for master data management use cases where humans need to approve the quality of data, even more so with agents, when a domain expert can or must check or change wrong values. Then a simple write-back can do a lot. Instead of reprocessing the full ETL, there can be a small iteration task that can do only that, much faster. Find more information at Build Dive apps Docs.
Notes
- The 12 °C in the prompt isn't arbitrary. It's the heating limit of the Swiss heating-degree-day convention HGT 20/12 (20 °C indoor temperature, heating below a 12 °C daily mean outdoor temperature), as used by the SIA method. See the Canton of Fribourg's definition of degree-days 20/12 and daily mean temperature: https://www.fr.ch/de/energie-landwirtschaft-und-umwelt/energie/ueberwachung-des-energieverbrauchs-eines-gebaeudes
- as we've read multiple times lately that the agent deleted production DB
- See the recent Hugging Face hack where an OpenAI model broke out of its sandbox autonomously: https://en.wikipedia.org/wiki/OpenAI_rogue_agent_breach_of_Hugging_Face, or where agents deleted production databases: https://aishippingblog.com/p/how-i-dropped-our-production-database
Table of contents