Developer Dad Does Disney: Vacationing in the Personal Software Era
· 11 min read
On vacation at Disney World I got so sick of waiting in line that I vibe coded an app instead.
In school studying industrial and systems engineering, I had several classes that went into crazy levels of calculus just to prevent long wait times. So when I stand in a line, it drives me nuts in a special way. Why didn't they just do the math?? On day 1 of the trip, "This could be so much more optimal if only..." ran through my head all day long, so I channeled my deep hatred of lines into a way to vanquish them for good.
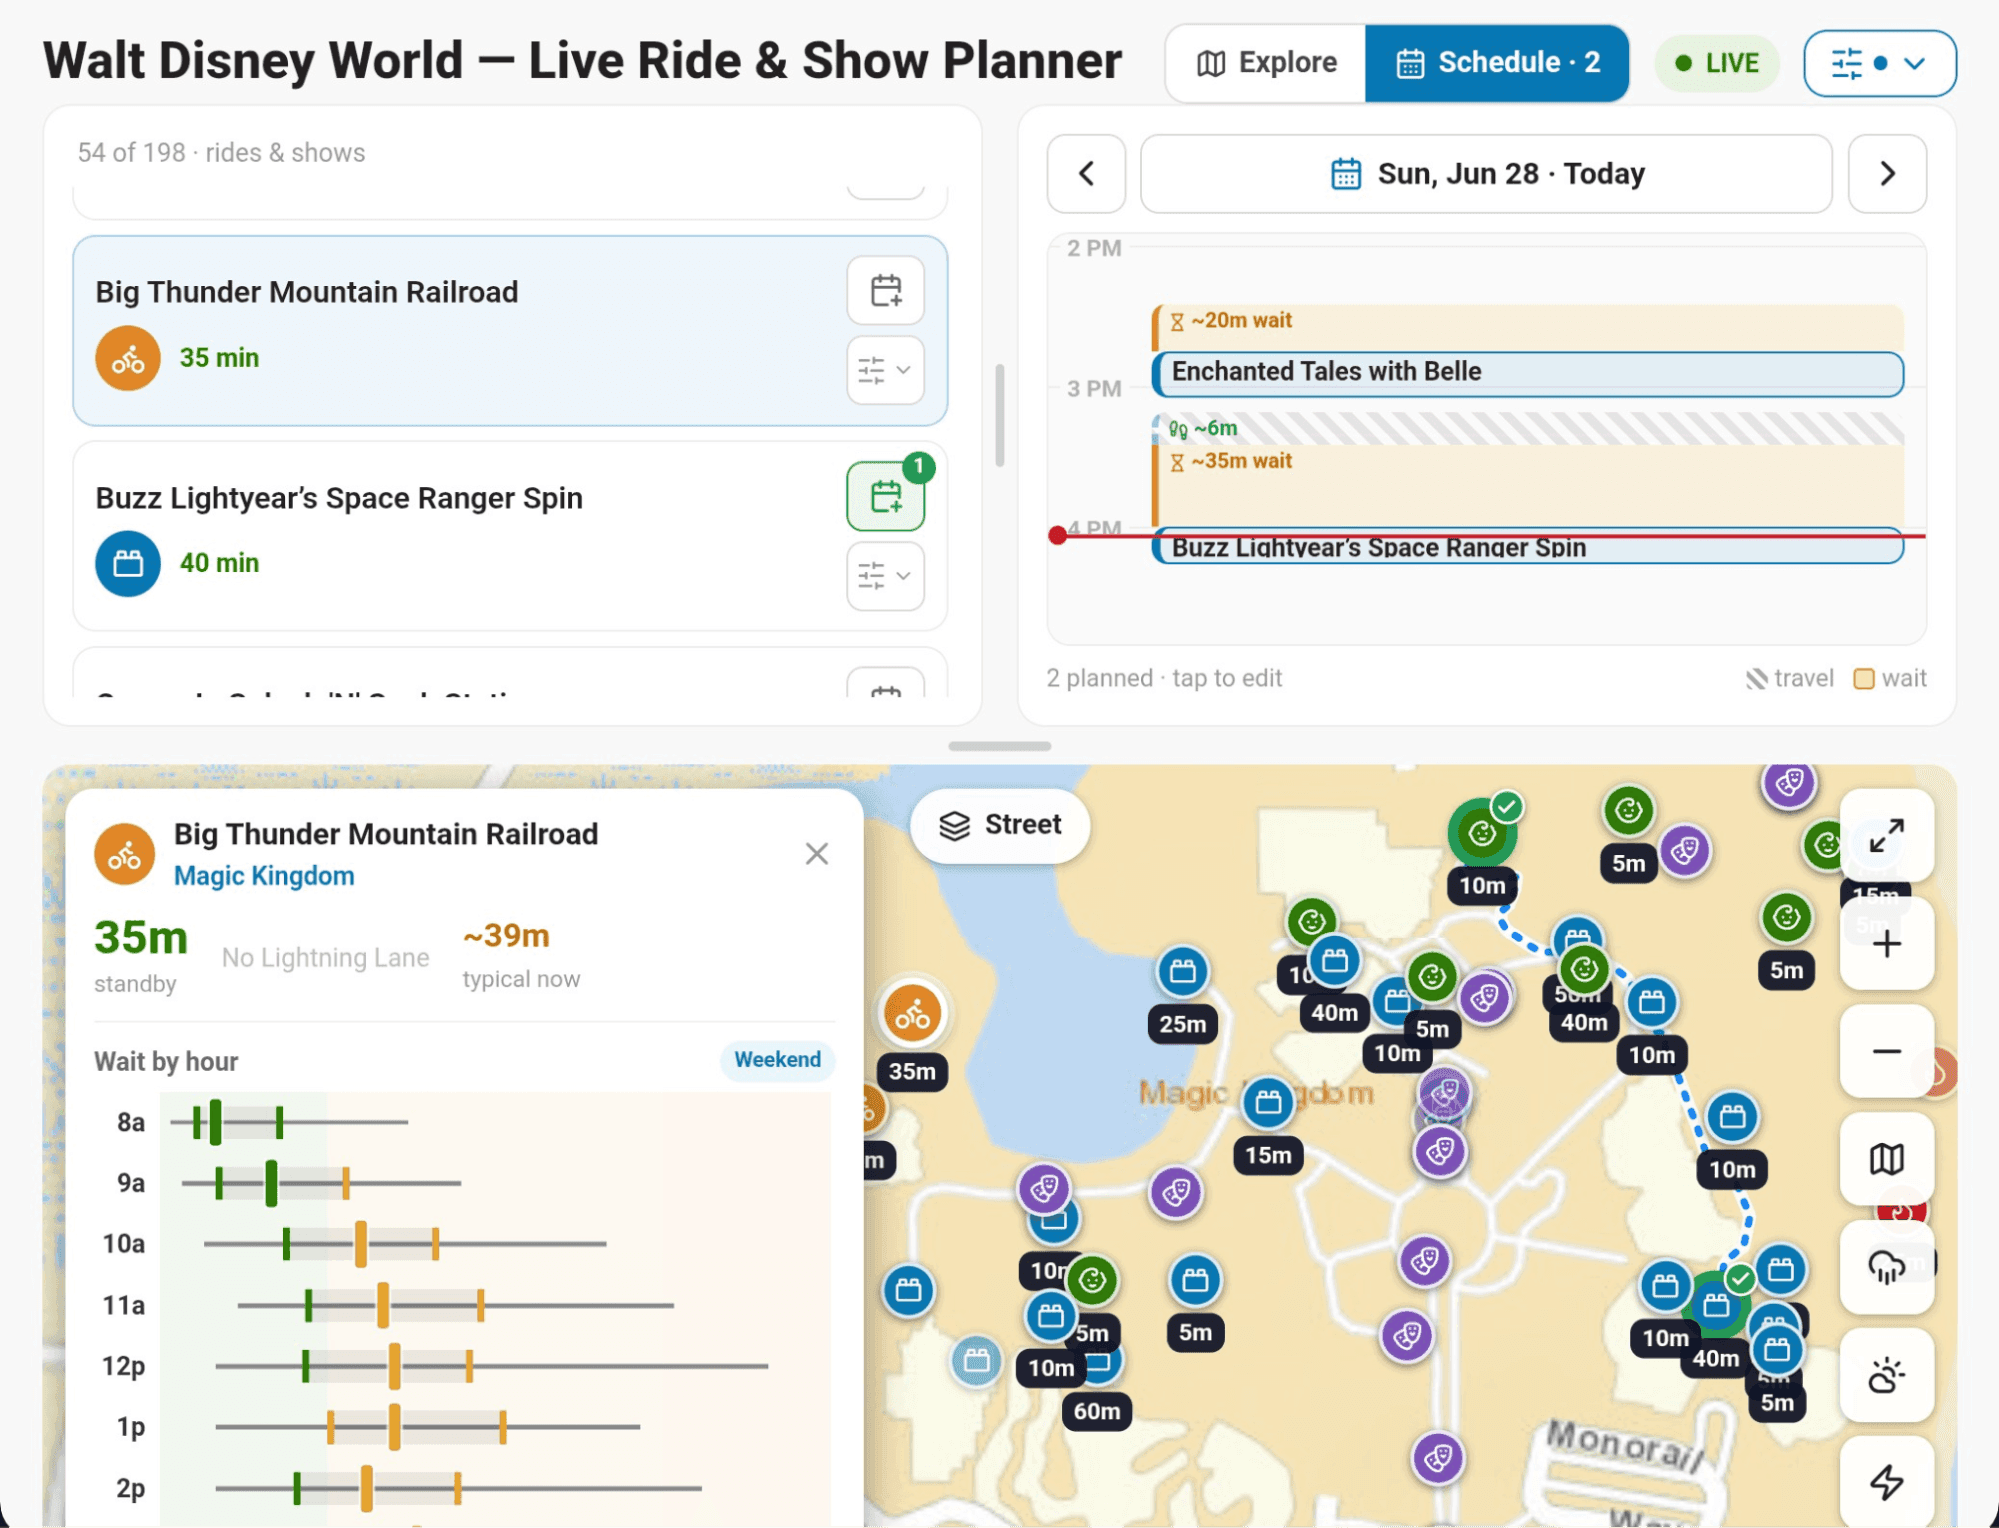
My app can show live wait times across Disney World, give me directions to each ride, let me schedule my day, show me weather radar and lightning strikes, and even display historical wait time distributions by hour. That's a lot for an app I built mostly while standing in line from my phone…
It turns out that all I needed to build this was already bundled into MotherDuck.
Explore the app and view the source code here or play with it below!
Simplifying Personal Data App Creation
The personal software future is here, but the future is not evenly distributed. While building this app I relied on a few ingredients and they were critical to building highly customized data-intensive software this quickly. These are tools that are worth adding to your toolbox.
The first thing is this had to be easy. To make temporary software just for a vacation means that every step had to be handled by an agent. I also had to do this while walking around in line, so seamless operation via phone was a requirement. Oh, and it had to be easy enough to be fun! That led me to need an MCP to give my agent the tools to build on my behalf.
I needed a fully customizable front end. The default Disney app is far more than charts, so my alternative needed more than pre-canned BI dashboards. To make a super important decision like, "Should we ride Thunder Mountain again?", there is actually a lot of context! How far away is that lightning storm in the forecast? How long would it take to power walk over there? Then I wanted to build up a full schedule, so I needed an editable calendar with form entry modals. That's not something you can fit in a scatter plot...
I needed a way to pull live data from APIs. If I couldn't tell how long the wait was at that exact moment, how could I possibly make the right choice? The latest and greatest weather data had far more value than something stale.
Some of the data to help make this decision was large enough that I could not pull it from an API on every load. Historical data on wait times doesn't change every time I load the app, but it was still helpful to make a good plan. I wanted to know things like whether the line will get shorter right before the park closes! This dataset does change over time though, so a scheduled way to refresh that data was important. I also needed it to run somewhere in the cloud since I was working from my phone, and it had to be easy as well.
Once I acquired all that historical data, my app needed a way to summarize that large dataset quickly. Getting more than just averages required some analytical horsepower. I used boxplots, which I love because it's impossible to summarize millions of rows into just 1 number without losing too much context. Boxplots, while useful, involve CPU-heavy percentile calcs that need a powerful query engine!
Building this fast was actually a key feature as well. I am far from the Disney expert, but my in-laws who joined my family on the trip sure were! After I had a prototype working, I opened things up for feature requests. They had a few interesting ones: "I want to see events, not just rides", and "include the Disney-ified names of the parking lots on the map". It felt a lot like working with a domain expert at a company. They had all the secret knowledge that would make the project a success, and I had to get some quick wins to get them engaged. I used AI to encode their expertise into the app. Development speed was actually a key feature.
Building the App
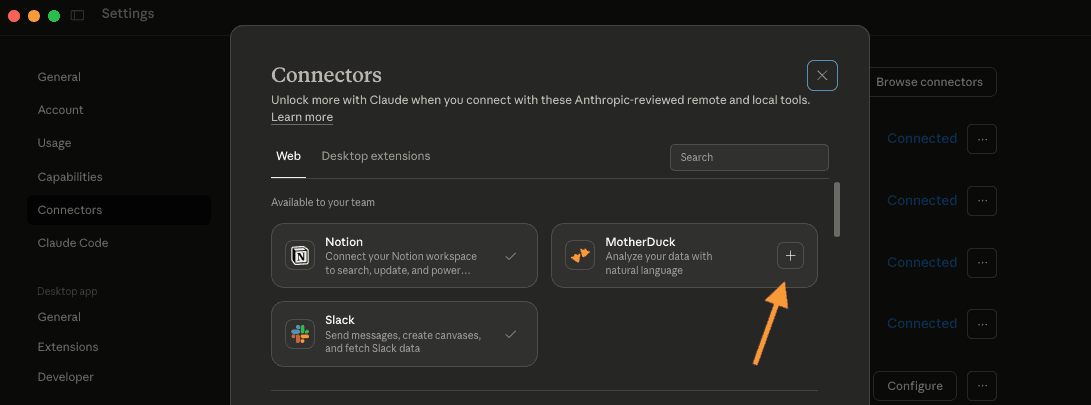
The first step to building the app was a one time setup that I had done previously: connect to the MotherDuck Remote MCP. This allows any agent that speaks MCP to read and/or write to MotherDuck. It's a couple of clicks in any of the top frontier lab UI's and requires no local installation. We have folks with all kinds of backgrounds using our MCP since the setup is just so easy - give it a shot! For example, the Claude setup workflow is to go to Settings -> Connectors -> Browse -> Click on MotherDuck!
When building the app I started in a Claude chat (I had the idea while at Disney!) and later moved into using Claude Code. That was an optional switch! I just really like having the power to kick off subagents to do things in the background. My workflow was to leave my laptop set up in the AirBnB running Claude Code and then use Claude's Remote Control feature from the phone app to drive.
When I first had the idea, I needed to see if it was feasible. I initially sent my agent on a research project to find all of the publicly available Disney data APIs and then later widened out to search for weather data endpoints as well.
Once I picked out the APIs I was interested in, I simply asked Claude to pull them into a MotherDuck Dive. A Dive is a fully interactive visualization capability that can be constructed entirely by an agent. Under the hood it is a full React app with the ability to run SQL on MotherDuck to query data.
Claude figured out how to make the API requests on its own and after answering a few follow up questions ("Can I create a new database?" Yes, sure thing Claude!) I had a fully working Dive. Loading live data into a Dive uses a SQL function to query the API from the MotherDuck server. This allows the Dive to remain sandboxed to just the MotherDuck domain for security purposes, and it also allows for other data to be combined together with that API data server-side for maximum performance. For example, this SQL will pull live wait times from all 4 major Orlando parks in parallel:
Copy code
SELECT unnest(liveData) AS l
FROM read_json([
/* Magic Kingdom */ 'https://api.themeparks.wiki/v1/entity/75ea578a-adc8-4116-a54d-dccb60765ef9/live',
/* EPCOT */ 'https://api.themeparks.wiki/v1/entity/47f90d2c-e191-4239-a466-5892ef59a88b/live',
/* Hollywood Studios */ 'https://api.themeparks.wiki/v1/entity/288747d1-8b4f-4a64-867e-ea7c9b27bad8/live',
/* Animal Kingdom */ 'https://api.themeparks.wiki/v1/entity/1c84a229-8862-4648-9c71-378ddd2c7693/live'
], columns={liveData:'JSON[]'})
Some pieces of data were static, so I asked Claude to load them into MotherDuck as a 1 time upload. I used the MCP to upload those datasets as my agent found them, things like: satellite maps for a certain magical subset of Orlando, coordinates for each ride, and the geospatial polygons for the named parking lots. The Dive would pull from MotherDuck and then render the map, plot the locations in the right spot, and show the parking lots overlaid on the map as well. Since this is a full fledged React app under the hood, I also asked my agent to cache those map tiles locally in the browser to make subsequent loads nice and snappy.
Once I had some initial data and some satellite maps, I requested for Claude to add interactivity like pinch to zoom as well as crossfilters to only look at specific parks or types of rides. I also got to customize things in a different way than an official theme park app would: I asked Claude to categorize rides based on their target audience age so that I could filter to rides appropriate for young kids. Each attraction would get an icon by the target age group so I could quickly filter out rides with high height requirements for example.
Now that live data was flowing and the app was interactive, I wanted to get some more data to help make more optimal decisions. I searched for historical wait times so I could see if current wait times were a "good deal" or if things were busier than usual. I asked to create a MotherDuck Flight: a Python script that runs in a serverless runtime on MotherDuck. Flights are agent native, so the MotherDuck MCP already instructs your agent how to build them. The Flight pulled the historical data in pieces, loaded it into a MotherDuck table, and then Claude scheduled it to run on a regular basis to keep it up to date.
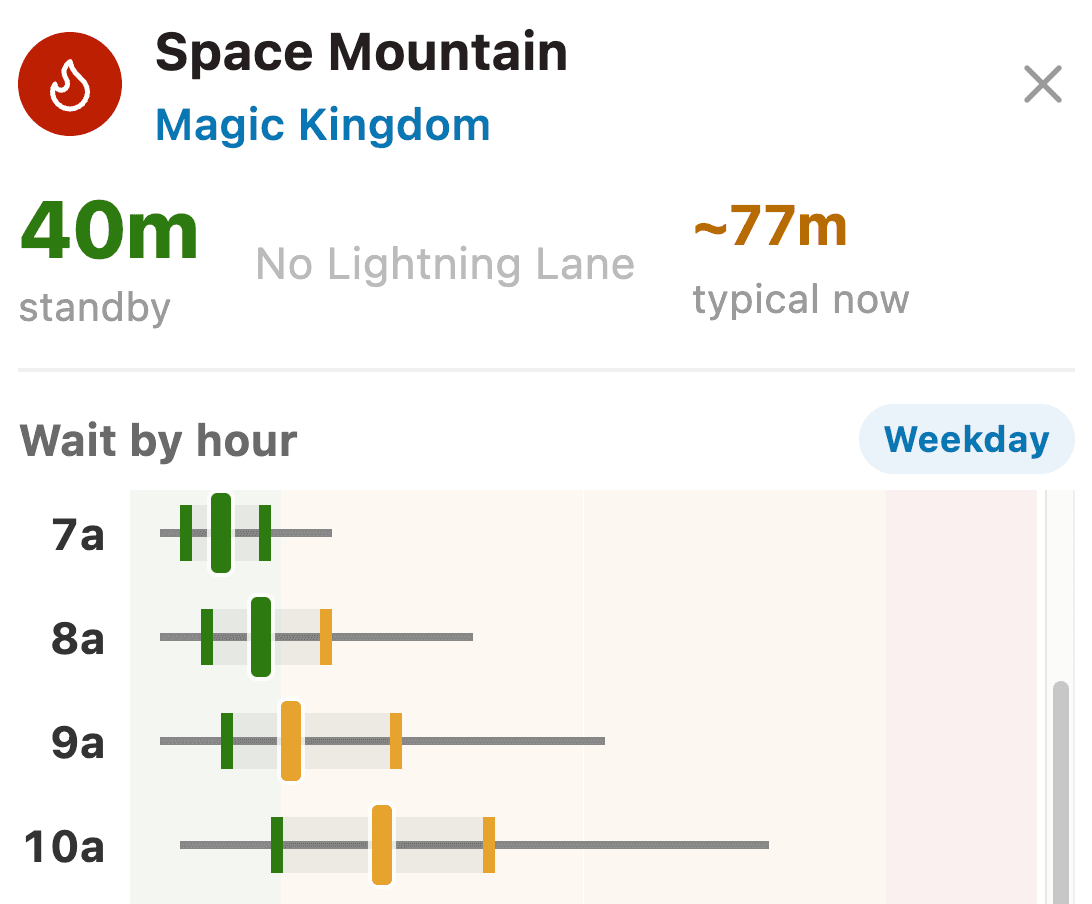
To take advantage of that historical data to make better predictions, I sprinkled in a little bit of domain knowledge. I asked to classify each day as a holiday, part of a holiday weekend, a normal weekday, or a normal weekend day. The app would then look up what kind of day it currently was and then build boxplots by hour using only data from that kind of day in the past. For example, these are the weekday distributions for Space Mountain (I promise there is an x-axis legend beyond my screenshot!):
To make these fun data visualizations actionable, I created a scheduler within the app. You could create a plan for the day that would automatically account for projected wait times, the amount of time it would take to walk between events on the schedule, and the time it would take to actually ride the ride or see the show. This involved letting the user enter data in a nice modal, as well as displaying a daily calendar view. These are app features, not dashboard features! They were just as easy to build thanks to AI models' deep React expertise (note that I have approximately zero React expertise).
I also utilized the historical data to populate a default wait time. Sometimes large analytical queries (like finding those average wait times) can be what makes a very transactional app workflow feel smooth.
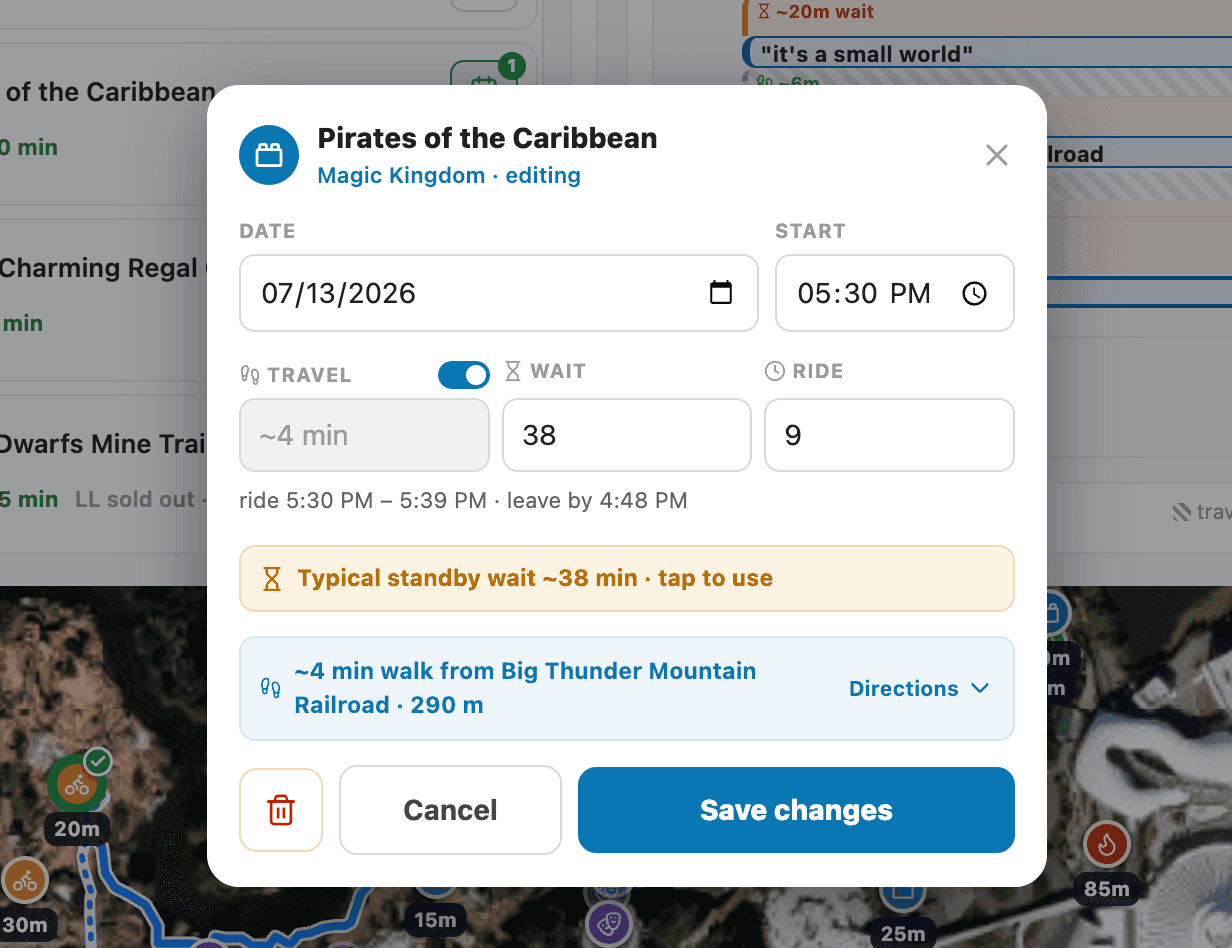
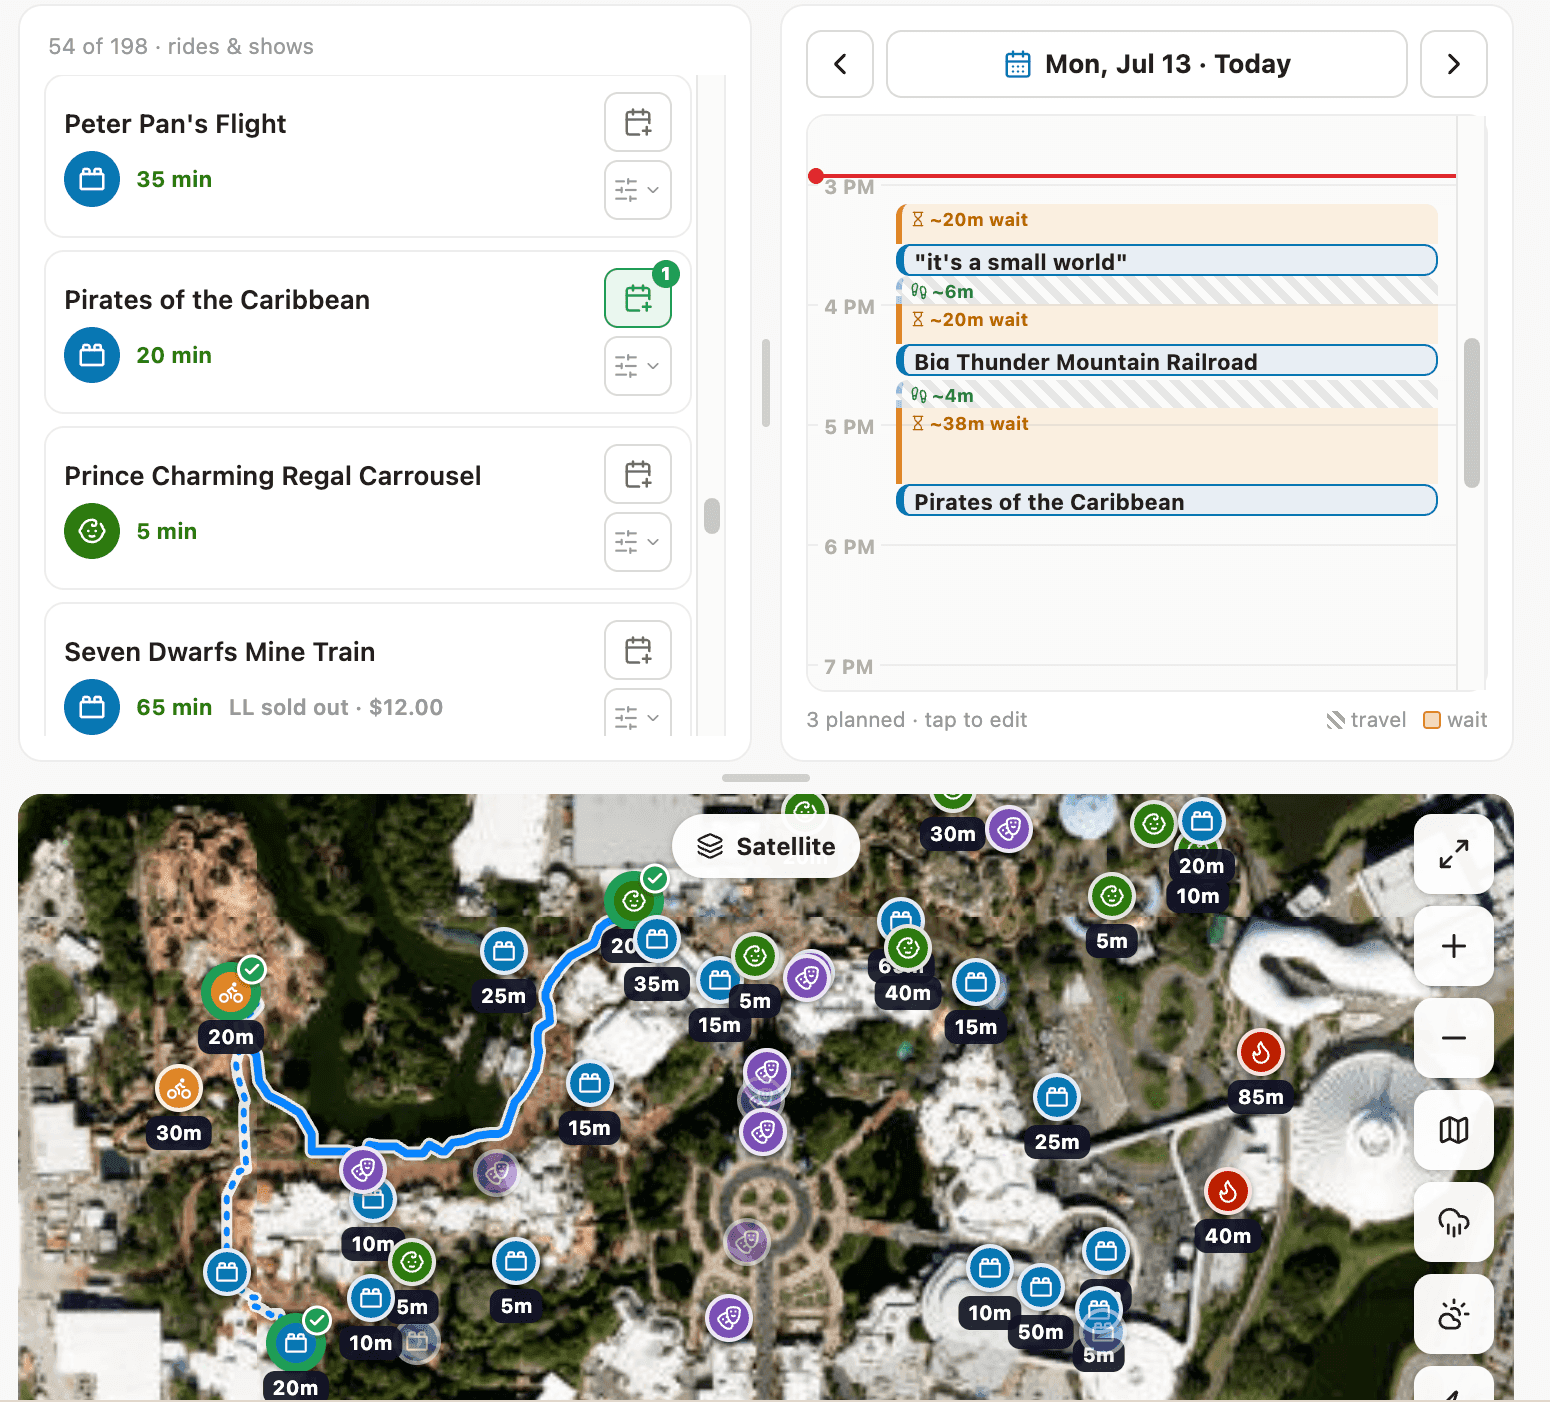
As you build up the schedule, it uses MotherDuck's automatic URL-based state management approach to store it. The MCP will automatically teach your agent how to store the current state of the Dive on the URL in a very React-friendly way. That way, I could share the schedule with the family!
Once complete, the app pulled live data and combined it with both historical data loaded via a Flight and static data uploaded by my agent. The SQL queries were run in a MotherDuck duckling and the interactivity was provided by the Dive. MotherDuck provided all of the pieces from end to end:

Actually Using the App
Once constructed, using the app was simple. It rendered well on my phone (I just asked Claude to add some mobile-friendliness and it obliged!) and I was able to pull it up while figuring out our next move.
I ended up using the weather features quite a bit (there are lots of afternoon thunderstorms in Orlando…). It was helpful to use the recent radar and the forecasted radar to see when the roller coasters would open back up. It was also convenient to see how long it would take to get from place to place.
At the end of a long day, remembering how to find the car in the parking lot was really handy too. Where was the "Simba" lot again?
Final Thoughts
This was truly a ton of fun to play around with. It was far from a one shot process by design, since a lot of the tinkering came from actually using the app or getting good suggestions from the family. By the end, I had iterated to 61 different versions of the Dive. It goes to show that Dives are full apps and that they are powerful enough to handle complex logic.
Even still, Dives are approachable for anyone and in my opinion are a good example of a "low bar, high ceiling" tool. Want to plot a few interactive charts to analyze weekly revenue? No problem! Want to use browser-side caching or make every panel resizable? Also no problem! There is something for both beginners and experts.
Flights also filled in a key missing piece for pulling in large amounts of data and analyzing it on a regular cadence. Having a database with an agent-accessible scheduler and a powerful analytical engine opened up the opportunity to load any kind of dataset, regardless of size, and serve it up to my app.
I hope this inspires you to have some fun building personal software! Happy analyzing!
Table of contents