Announcing DiveMaxxing: An Online Data Viz Hackathon
· 3 min read
We launched Dives earlier this year, they're highly customizable data viz that people love. Today launching DiveMaxxing — part hackathon, part showcase, fully online. Build an interactive data visualization, submit it, and let the work speak for itself.
Three categories. Real prizes. A community vote. Runs May 28 through June 22, 2026.
The competition
Categories
- Best Overall goes to craft, clarity, and design — the total package.
- Most Creative rewards surprise and originality: strange, ambitious, or so unexpected you didn't see it coming, though the data still has to hold up.
- Community Favorite has no panel and no rubric. Most upvotes in the gallery wins.
Prizes
Best Overall and Most Creative each get:
- A duckified Mac Mini M4 with a custom MotherDuck skin
- Swag box filled with MotherDuck Merch
Community Favorite gets:
- $500 gift card
- Swag box
All winners get featured in the Dive Gallery with a winner badge.
Judges
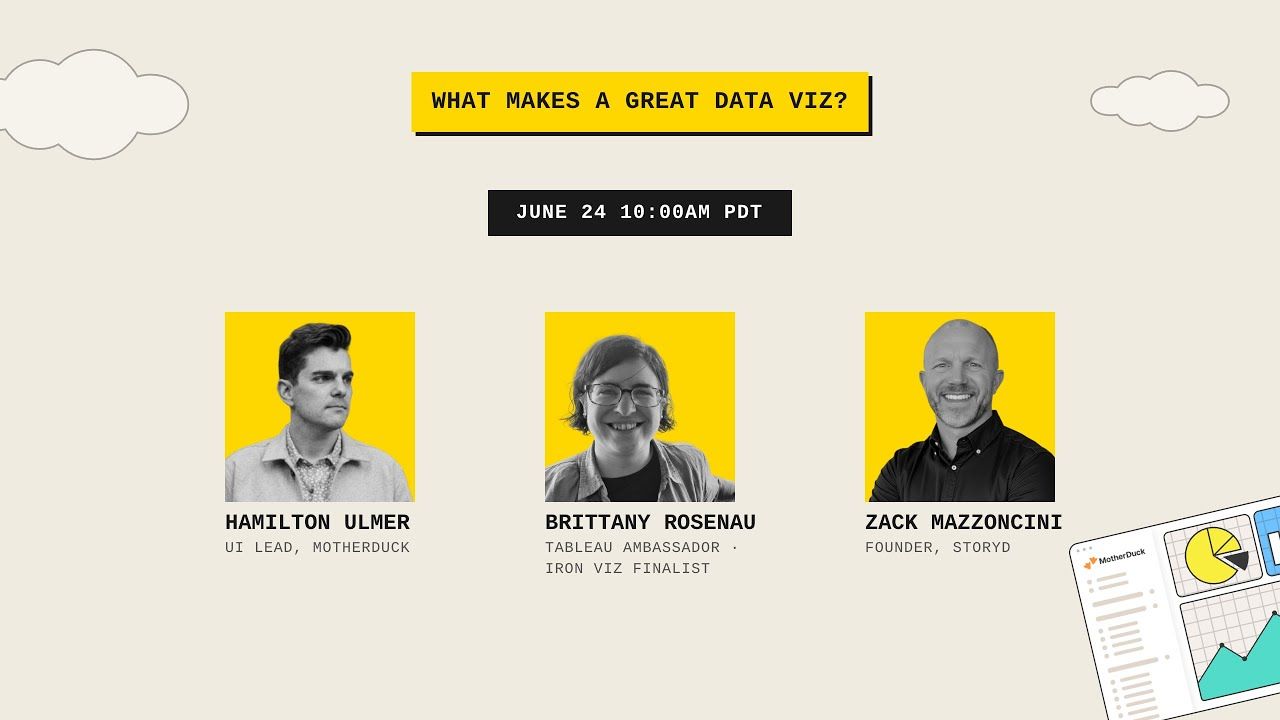
- Hamilton Ulmer — MotherDuck
- Zack Mazzoncini — Founder of STORYD / Data Story Academy
- Brittany Rosenau — Iron Viz winner
Timeline
- May 28 – June 22: Submissions open. Community voting runs throughout.
- Late June: Winners revealed on a livestream.
New to Dives?
A Dive is an interactive data visualization you build by talking to an AI agent, Claude or ChatGPT, through MotherDuck. You describe what you want to see, the agent builds it, and you refine through conversation. Live queries against real data, not static screenshots. Most take 10 to 30 minutes to build.
If you want the full picture: What are Dives? · How I Dive with Claude AI
What people are building
Here are a couple of Dives from the gallery that show what people have already built.
Data Jobs 2025: A Year of Hiring pulls from 109k job listings sliced by city, role, and company status. Weekly trend charts, topic filters, expandable job descriptions. There's real depth once you start clicking around.
Night Sky Atlas is an interactive star map built on ESA Gaia data. Pick from 54 cities, scrub through the year, toggle constellations, drag a 3D globe. Not what most people picture when they hear "data visualization."
Browse more in the Dive Gallery →
How to enter
You need a free MotherDuck account, an AI agent, and something you want to visualize.
- Sign up at motherduck.com (free, no credit card).
- Connect your AI agent — add the MotherDuck integration in Claude or ChatGPT. (Setup guide)
- Build a Dive — describe what you want to see, iterate until it's great.
- Submit to the Gallery — publish your Dive, check the contest entry box. Up to 2 submissions per person.
Already have a Dive you're proud of? Pre-existing Dives are welcome.
Tips
- Start with a question, not a dataset. The Dives that work best answer something someone actually wants to know.
- Iterate a lot. Your first version won't be your best. Try three approaches, keep the one that clicks.
- Make interactivity earn its place. Filters and drill-downs should reveal something, not just exist.
- Be weird on purpose. The gallery doesn't need another sales dashboard. Pick a dataset nobody expects, or show familiar data in a way nobody's tried.
- Sweat the details. Labels, colors, layout, whitespace. The judges will notice.
Build something worth looking at
You have free tools, a few weeks, and a medium that didn't exist a year ago. Go make something.
Enter DiveMaxxing | Browse the Dive Gallery | Official rules
Table of contents