BLOG
Announcing Data Outpost - The conference for data people in a world being rebuilt by AINov 4-5 | San Francisco
- 12 min read
BY- 12 min read
BYText analysis presents unique challenges for businesses trying to understand customer feedback. Analyzing survey responses or product reviews can improve your customer experience. But, at the same time, extracting insights from unstructured text data is complex and time-consuming.
Large Language Models (LLMs) and Small Language Models (SMLs) excel at this task. However, integrating them into real-time, business-ready dashboards requires careful consideration of performance, cost, and usability.
Thankfully, MotherDuck is uniquely well-suited for this task for two reasons:
Adding on, Fabi.ai–an AI data analytics platform with SQL, Python, and AI support–perfectly complements MotherDuck. Fabi.ai provides the fastest way in the market to go from raw data to interactive, shareable reports.
This tutorial will show you how to use MotherDuck's prompt() function and vector embeddings, along with Fabi.ai's visualizations. We'll label data for sentiment analysis and create an interactive dashboard to improve your customer experience.
By the end of this article, you’ll know how to build an end-to-end sentiment analysis process, including:
To see the end result in action, check out our video:
Sentiment analysis is a technique in natural language processing that identifies and categorizes opinions or emotions expressed in text. It checks if the sentiment is positive, negative, or neutral and is often used to analyze customer feedback, social media, or reviews. This helps businesses and researchers understand public sentiment and make data-driven decisions about their products. Sentiment analysis is also a powerful tool for customer success and marketing teams because it can help them identify issues with their services or products, and understand what customers and users like about their offerings.
In our example, sentiment analysis means categorizing customer product reviews into “Positive”, “Neutral,” or “Negative” categories.
Traditional sentiment analysis methods, like rule-based systems and ML models, often struggle with context, sarcasm, and adapting to new domains. Rule-based approaches rely on lexicons. But they often fail with nuanced language, while ML methods require extensive labeled data and feature engineering. This limits their generalizability. For example, a review that says “I wanted to love this product but in the end I regretted it” is clearly negative. A human reader would easily glean that. But traditional sentiment analysis methods might misclassify it because of the word “love.”
Language models overcome these challenges. They can understand context, handle subtleties like sarcasm, and generalize across domains. Pretrained on diverse text from sources rich in emotions and sarcasm (comment sections, we’re looking at you), these language models easily capture nuanced sentiment, adapt to new domains, and support multilingual analysis with minimal additional training. All of which make them highly effective for sentiment analysis tasks.
In the second half of 2024, MotherDuck introduced a powerful new prompt() function. Prompt() lets you use language models directly in your MotherDuck queries.
Here’s a simple example:
Copy code
SELECT prompt('summarize my text: ' || my_text) as summary FROM my_table;
This query summarizes text in a “my_text” field and inserts it into a “summary” field in the results.
Prompt() leverages OpenAI's GPT-4o mini and GPT-4o models trained specifically for MotherDuck’s use case and is optimized for cost and performance. It’s well suited for extraction from unstructured fields in your MotherDuck tables.
OK, it’s time to get into our example: Building our sentiment analysis dashboard. It will extract the sentiment from customer product reviews for a fictional company, Superdope, which sells fashion apparel. We’ll use that information to build a product review dashboard that you can share with your customer success and marketing teams.
We’ll complete this in a few steps:
Before we get started, here are the technical requirements you’ll need going into this example:
This example will use synthetic data for our fictional company, which you can download yourself here if you’d like to follow along exactly. Otherwise, you can simply ask your favorite AI to generate some data for you with the following fields:
Once you have your data, go ahead and upload it to your MotherDuck instance.
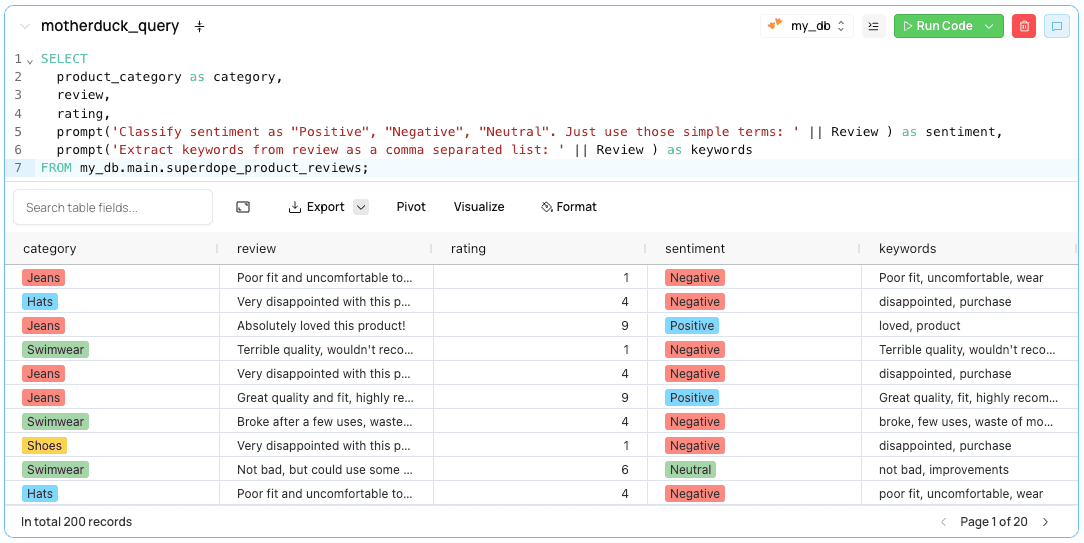
Once your data is loaded into your database, check that it’s there. Next, we’ll generate two fields: A sentiment field, which will simply be “Positive”, “Neutral” or “Negative”, and a keywords field, which contains keywords from the review.
Using prompt():
Copy code
SELECT
product_category as category,
review,
rating,
prompt('Classify sentiment as "Positive", "Negative", "Neutral". Just use those simple terms: ' || Review ) as sentiment,
prompt('Extract keywords from review as a comma separated list: ' || Review ) as keywords
FROM my_db.main.superdope_product_reviews;
Your results should have the sentiment in the sentiment field. This prompt worked for us, but you may need to tune it a little bit to get the results you want. For example, when I first didn’t specify “Just use those simple terms” it was using “Neutral sentiment” as a category. You may also want to consider some simple evals and errors when building this in production in the event that the AI decides to behave a bit differently.
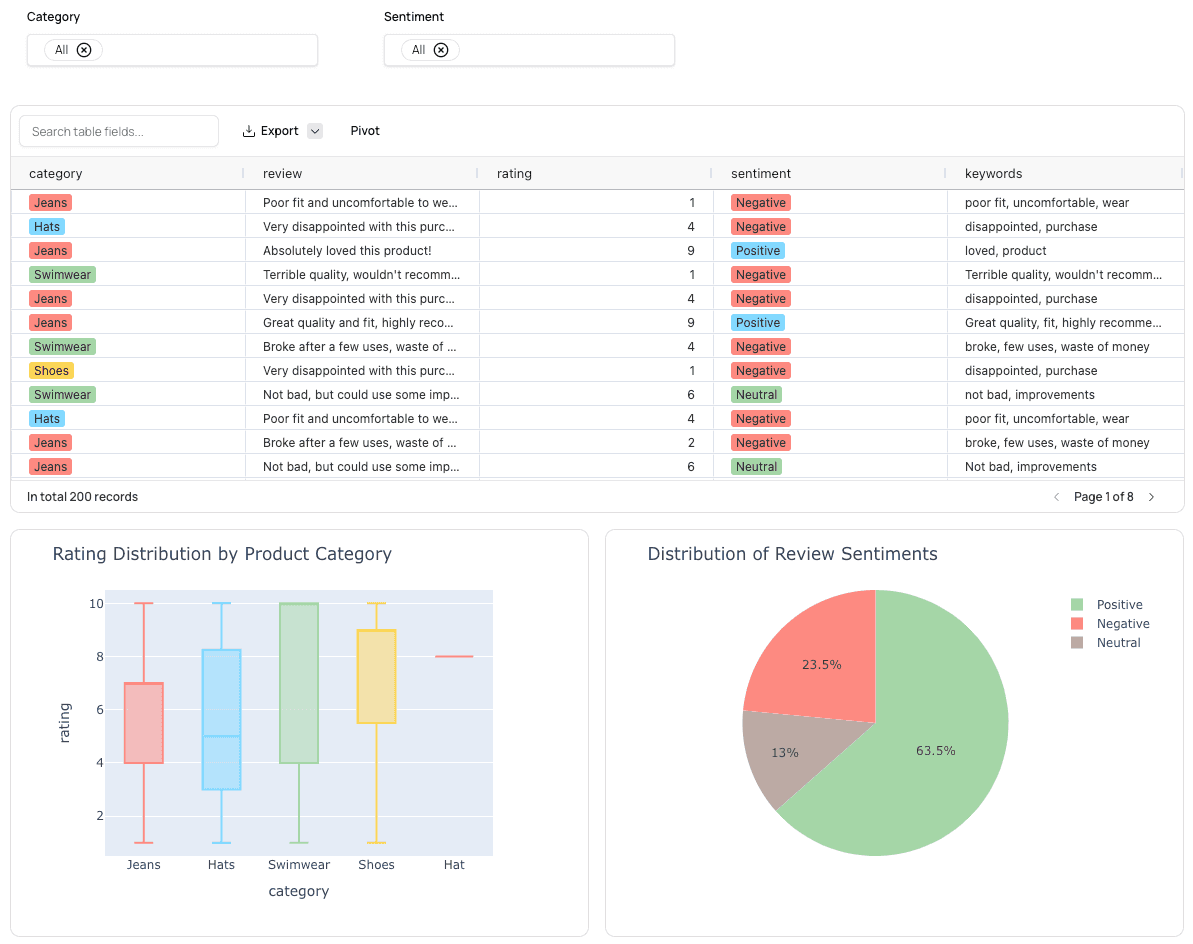
Now that we have our data loaded in MotherDuck and our query in hand, let’s conduct our analysis in Fabi.ai. We’ll create a table and a pie chart with some filters so your stakeholders can adjust the view on their own.
Follow these steps:
Step 1: Log in to Fabi.ai and create your account
Go to https://app.fabi.ai/ and log in with your corporate Gmail account.
Step 2: Connect MotherDuck to Fabi.ai
When you create your account, the system will prompt you to connect your data source.. Simply follow those steps and enter your MotherDuck access token. Or, in a blank Smartbook in the Schema browser, click on the “Add Data Source” option on the left hand side and follow those same steps.
Step 3: Query the data
In a blank Smartbook, create a new SQL cell and copy/paste the SQL query we wrote above. Run the cell. You should see the results in the output. Note: This data is now cached as a pandas DataFrame. This is important for the following steps.
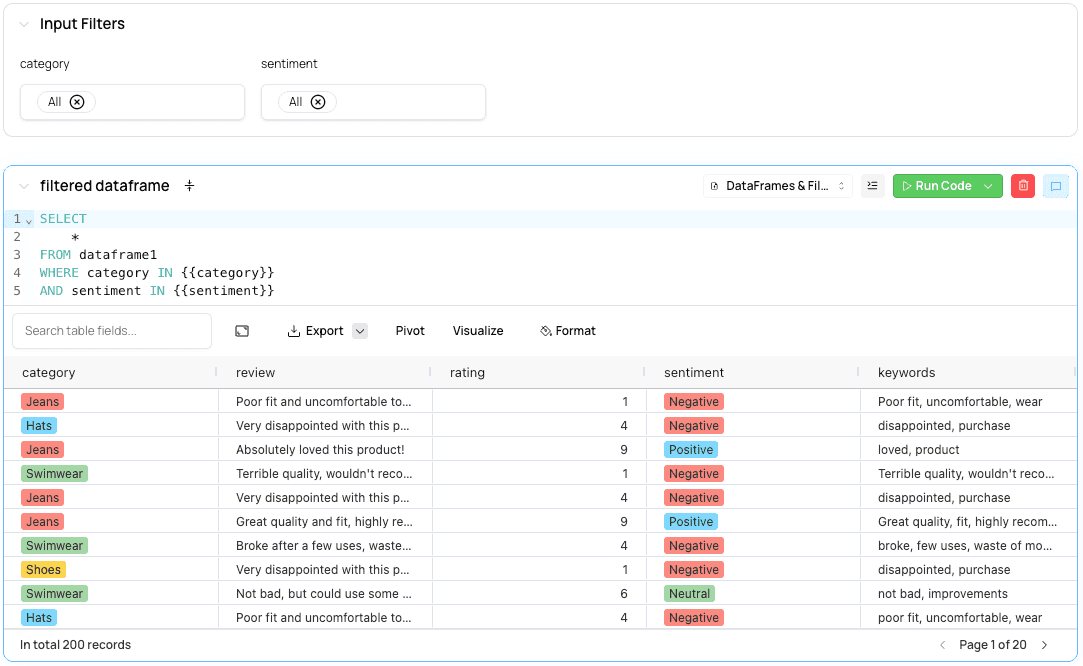
Step 4: Chain a new SQL cell and create filters
In this step, we’re going to query the DataFrame generated by the SQL cell. Under the first SQL cell, create another new SQL cell and query the DataFrame:
Copy code
select * from dataframe1
This step may seem redundant, but it helps when creating filters. Since dataframe1 is now cached, we can create dynamic filters based on the values in the result.
In your second SQL cell, we can adjust the query to add a dynamic variable:
Copy code
select *
from dataframe1
where sentiment in {{sentiment}}
Now let’s create the filter for sentiment. Above the second SQL cell, click “Insert a new cell” and create a Filters & Inputs of type Pick List. Follow the steps using the following parameters:
In our example, we added two filters, but this is what you should now see (below). If you change the filter or rerun the cell, it will pick up the values from the dropdown. You can create many more types of filters and inputs in Fabi.ai.
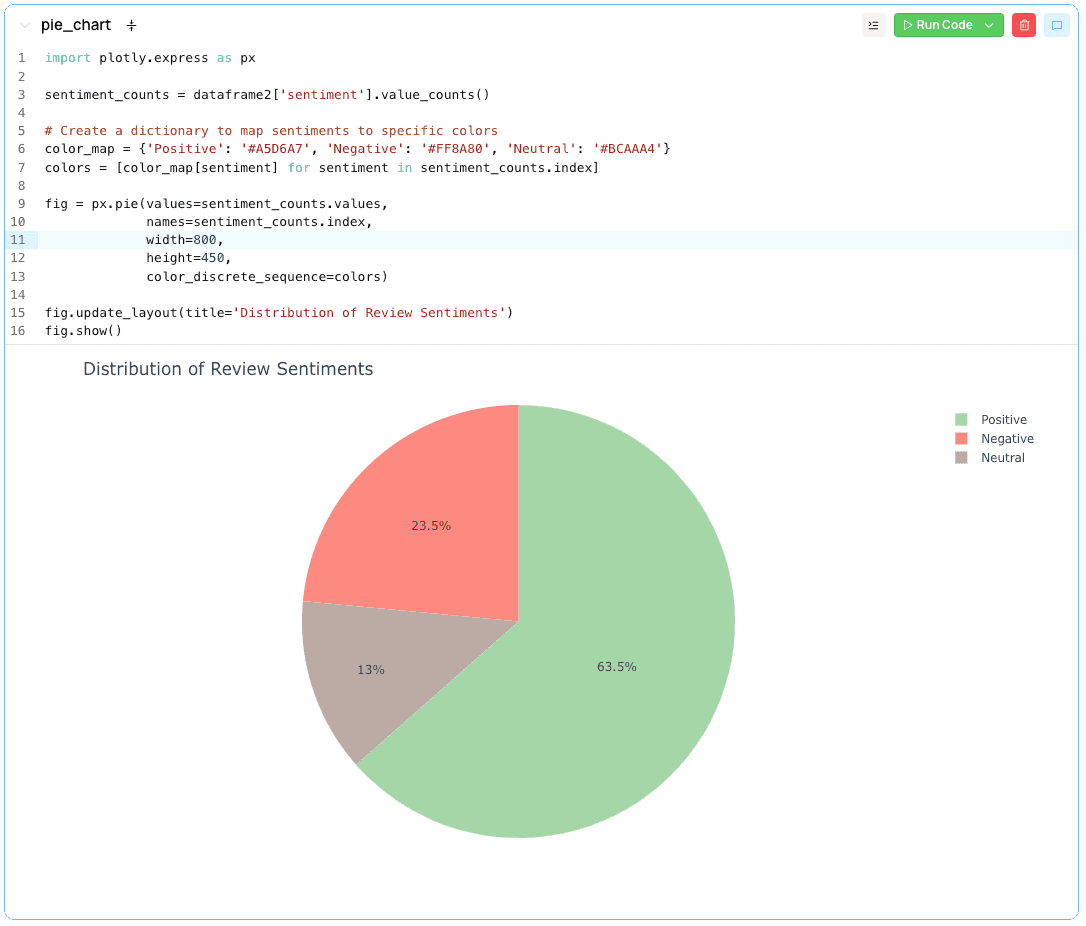
Step 5: Create a pie chart
Finally, let’s create a pie chart. It will show the distribution of sentiment for the filtered DataFrame.
At the bottom of the Smartbook, insert a new Python cell. Use Plotly to create a pie chart with dataframe2 (the DataFrame generated by your second SQL cell):
Copy code
import plotly.express as px
sentiment_counts = dataframe2['sentiment'].value_counts()
# Create a dictionary to map sentiments to specific colors
color_map = {'Positive': '#A5D6A7', 'Negative': '#FF8A80', 'Neutral': '#BCAAA4'}
colors = [color_map[sentiment] for sentiment in sentiment_counts.index]
fig = px.pie(values=sentiment_counts.values,
names=sentiment_counts.index,
width=800,
height=450,
color_discrete_sequence=colors)
fig.update_layout(title='Distribution of Review Sentiments')
fig.show()
Run that cell, and there you have it! Your pie chart will dynamically adjust as you change the filters above.
Pro-tip: Fabi.ai has an integrated AI assistant that can write both SQL and Python and understands the full context of your Smartbook. Rather than writing the code manually, you can simply ask the AI.
Congrats, you’ve successfully categorized product review sentiment using MotherDuck! We’ve also built a basic sentiment analysis. Now we need to convert this to a shareable report for your teammates.
In the top header of the Smartbook, click “Report.” This will take you to the report building staging area. There, you can add, remove, or rearrange elements as you wish. In our case, you can remove the first SQL cell output. It's a duplicate of the second one but without the filter. In the right-hand configuration pane, you can schedule this report to refresh as well.
When you’re ready to publish this, click Publish in the right hand panel, which will bring you to the report.
And that’s it! Now you can share this URL with your coworkers. They’ll be able to slice and dice product reviews by sentiment on their own.
If you’re building a sentiment analysis report, you may also want to let your users search reviews by content. Keyword and term matching using things like Regex or even fuzzy matching can be quite limiting. Say, for example, you want to search for reviews that mention “great quality.” It would be great if that search could return a review that says “The materials were top notch,” which is clearly a commentary on the quality.
MotherDuck’s vector embedding can offer a quick and easy way to build a clever search engine.
In the same Smartbook we created above, create a new SQL cell and add the following MotherDuck query:
Copy code
WITH embedded_reviews AS (
SELECT
product_category AS category,
review,
rating,
embedding(review) AS review_embedding
FROM my_db.main.superdope_product_reviews
),
search_query AS (
SELECT embedding('great quality') AS query_embedding
)
SELECT
er.category,
er.review,
er.rating,
array_cosine_similarity(er.review_embedding, sq.query_embedding) AS similarity_score
FROM embedded_reviews er, search_query sq
ORDER BY similarity_score DESC
The embedding() function will create an embedding for each review. It does this as a new column called review_embedding in the CTE. Then we use cosine similarity to match that embedding with the embedding for the string ‘great quality’.
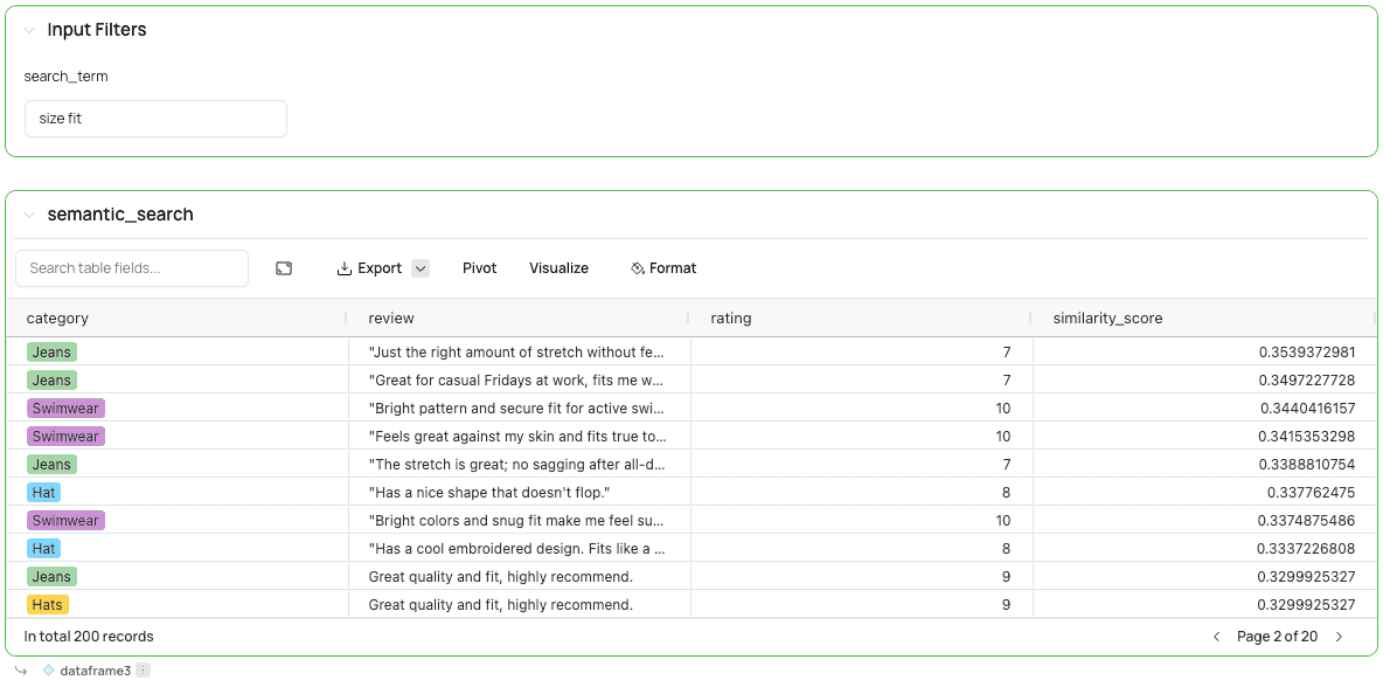
Now, to create a search function for your users in the dashboard, replace the ‘great quality’ string with a parameter:
Copy code
WITH embedded_reviews AS (
SELECT
product_category AS category,
review,
rating,
embedding(review) AS review_embedding
FROM my_db.main.superdope_product_reviews
),
search_query AS (
SELECT embedding('{{search_term}}') AS query_embedding
)
SELECT
er.category,
er.review,
er.rating,
array_cosine_similarity(er.review_embedding, sq.query_embedding) AS similarity_score
FROM embedded_reviews er, search_query sq
ORDER BY similarity_score DESC
LIMIT 10
For this to run, we’ll create a new input above this cell like we did previously for the filter. Select “Insert a new cell” above the SQL cell and select Text. Call the input “search_term” and insert some default value. After creating this input, you can search for any term in it. It will then perform a semantic search on the review field.
A few final, quick tips and thoughts to take your analysis to the next level:
With that, you’re now a sentiment analysis expert! This tutorial explored how to use MotherDuck’s native prompt() function to parse out natural language on the fly and leverage Fabi.ai to build an interactive, shareable report for your customer success and marketing teams. This is a great way to stay on top of reviews and improve your customer experience.
Check out the full tutorial walkthrough, or get started with your own data in MotherDuck today.