Introducing Flight Explainer: Live charts of your python pipelines
· 5 min read
MotherDuck Flights run your Python code on MotherDuck compute, on demand or on a schedule. They're how you pull data from APIs and other services into MotherDuck, run ETL pipelines, refresh tables and handle any other recurring job that reads or writes your data. Because you can create, run and debug flights through the MotherDuck MCP server, an agent can build a working one in a few minutes.
That speed makes an old question more pressing: how do you know the flight does what you asked for? Flights often do the work that is hardest to test, and reading code you didn't write, line by line, isn't a realistic way to find out.
Flight Explainer does for flights what EXPLAIN ANALYZE does for SQL queries. Before a flight runs, it declares its plan: the steps it will take and how they connect. As it runs, it reports what each step did. The result is a live chart of every run with the plan and the outcome side by side: which steps ran, which way the flight branched, how far each step got and what it touched.
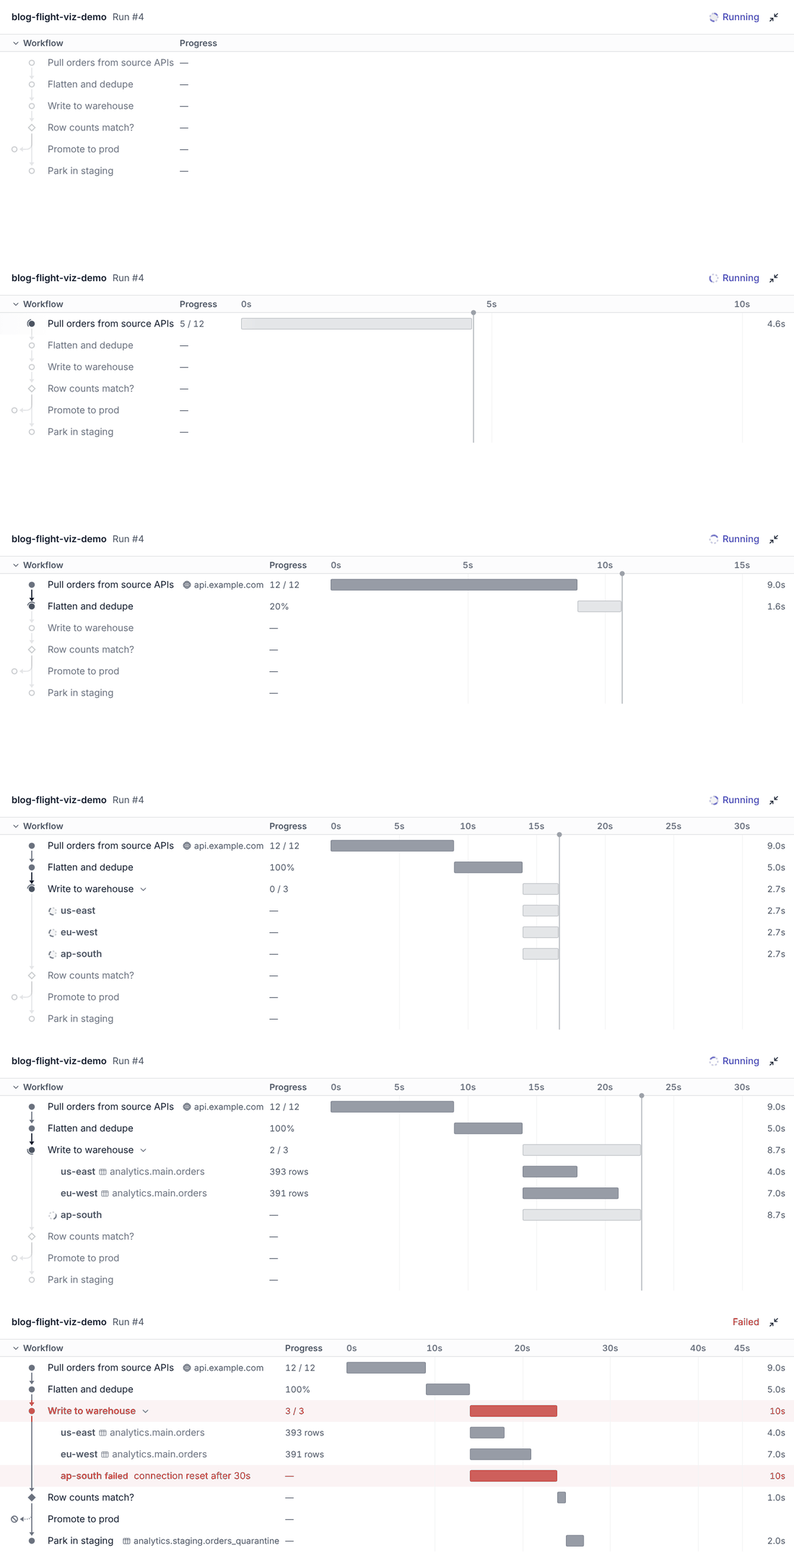
There's nothing to install or configure. Ask your agent to "add Flight Explainer instrumentation to my flights", then ask it to show you a run. The chart opens right in your chat.
The workflow: where your flight went (and where it didn't)
The left side of the chart is your flight's workflow: every step it declared, in order, connected based on the flight's logic. Since your workflow is declared up front, steps that haven't run yet are already on the chart, so you can see what's left and spot a step that never ran.
Each marker shows what happened to its step. A solid dot finished, a spinning ring is still running and a hollow outline hasn't started. Failed steps turn red, so they're hard to miss. Steps that make a decision are drawn as diamonds.
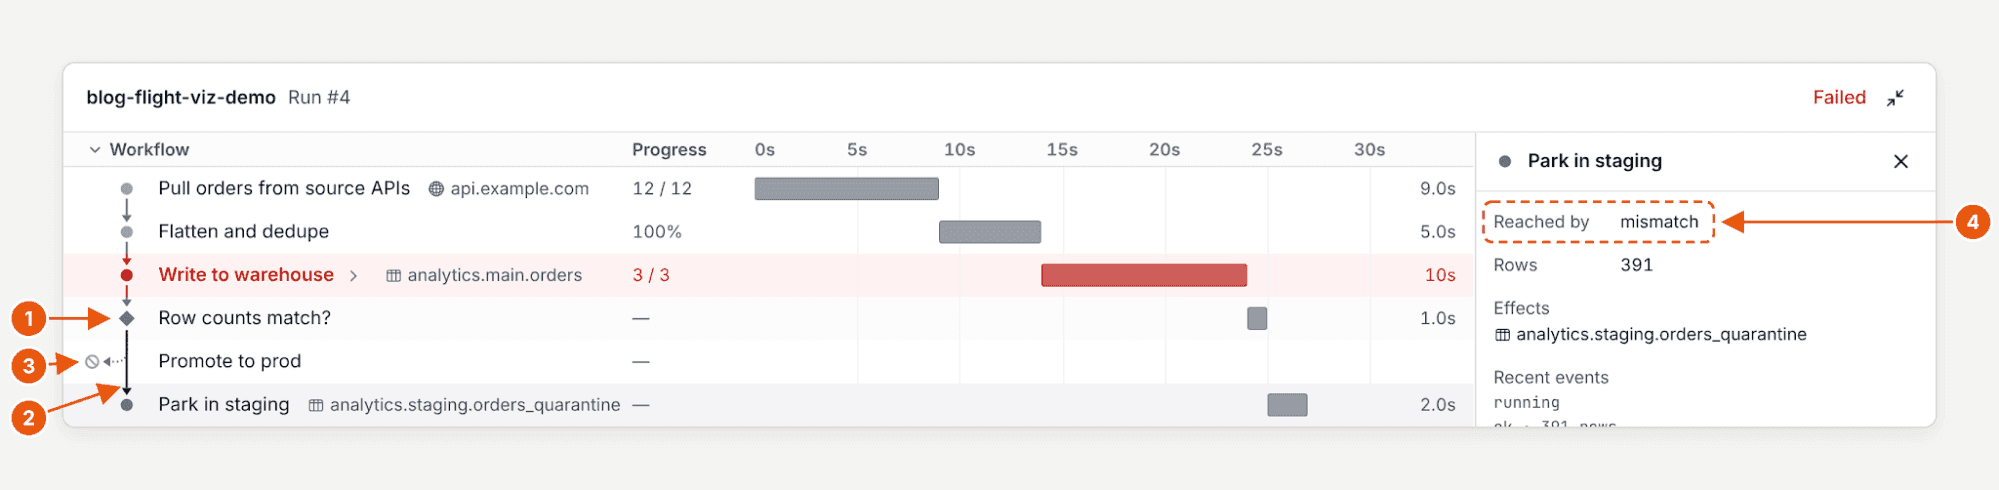
- Check: This step checks that the row counts add up before anything gets near prod.
- Based on that check: The counts didn't match, so the flight headed for "Park in staging". The solid line traces the route it took.
- See what didn’t happen: "Promote to prod" gets crossed out and nudged to the side. The check said which way it went, so the other branch shows as skipped, not as something that might still happen.
- How it got here. Click any step to see which branch led to it. "Park in staging" was reached by mismatch.
The check itself still finished ok because catching bad data is its job. Whether a step worked and which way it sent the flight are shown separately, so a pipeline that quarantines bad data on purpose doesn't look like a broken one.
Step progress
Each step can report how far along it is, in whichever form fits the work. The chart shows the reading live while the step runs and keeps it afterward, so a step that stopped at 812 / 1000 keeps saying so.
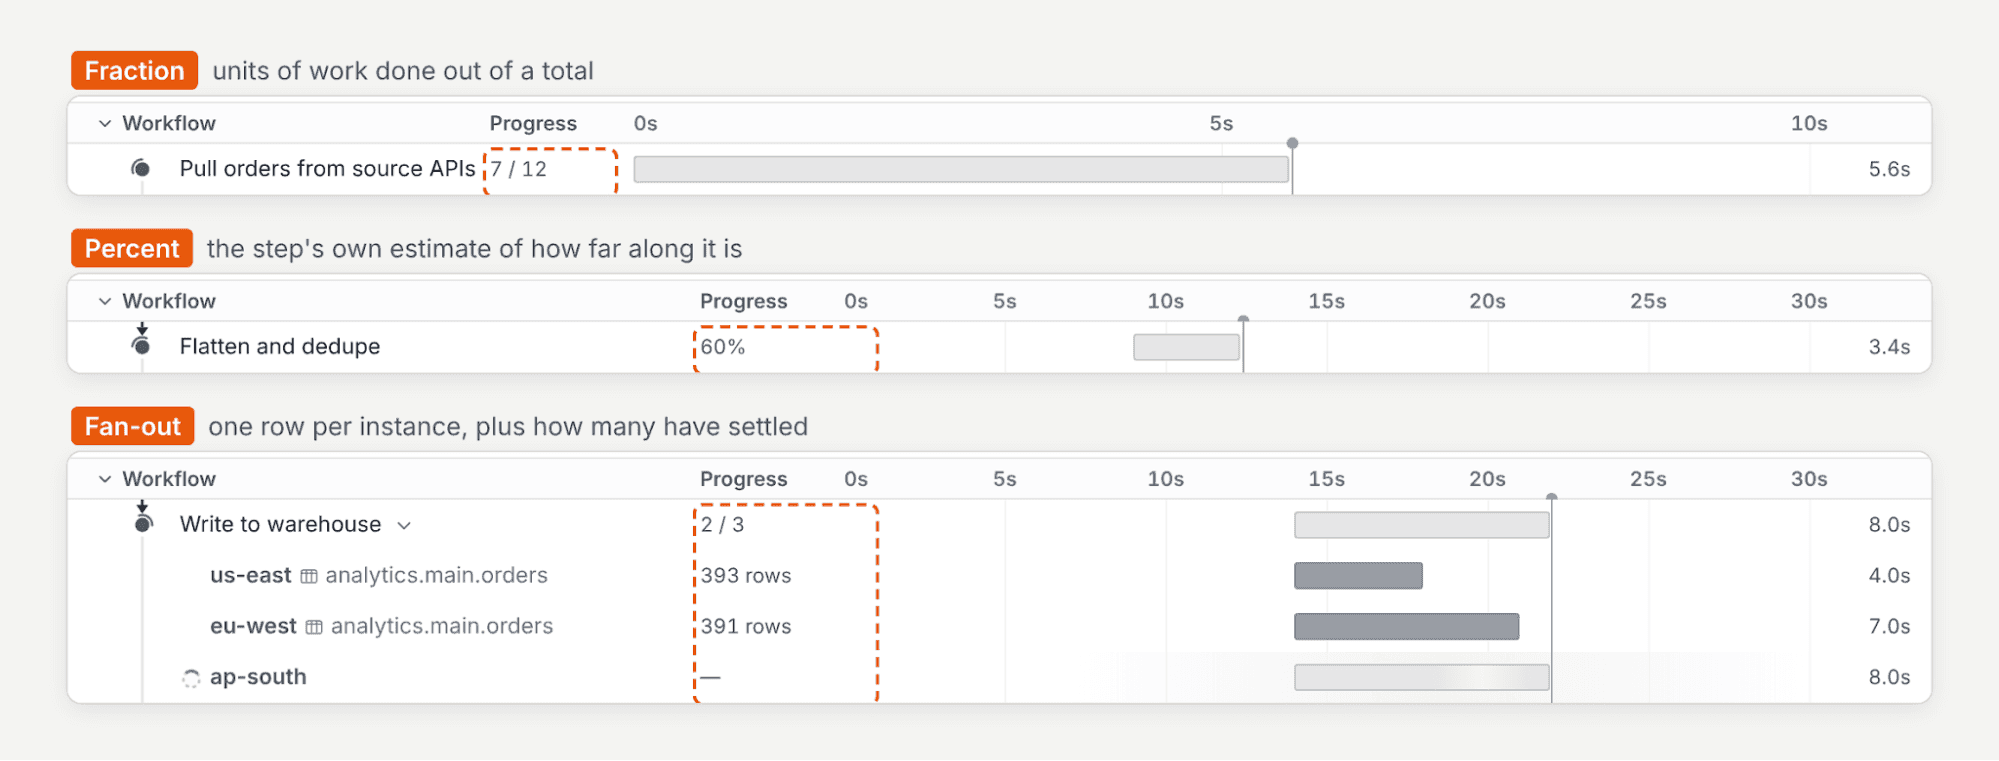
- Fraction counts units of work, like pages fetched from an API:
7 / 12. - Percent shows a step's own estimate of how far it has got:
60%. - Fan-out is for a step that runs once per item, like a load per region. Each instance gets its own row, with its result, duration and errors, and the step shows how many have finished:
2 / 3. A fanned-out step isn't marked failed while any of its instances is still running, and its slowest instance stands out on the timeline.
Effects and drift
Steps also report their effects: the tables and files they wrote and the endpoints they called. Each step's effects appear right next to its name (per instance for a fan-out), so you can see what it touched without reading the code.
Every step also declares what kind of work it does, such as extract, transform or load. Flight Explainer compares that declaration with the step's effects. When they disagree, for example a transform step, which should only compute in memory, writes to a table, the step is flagged with drift.
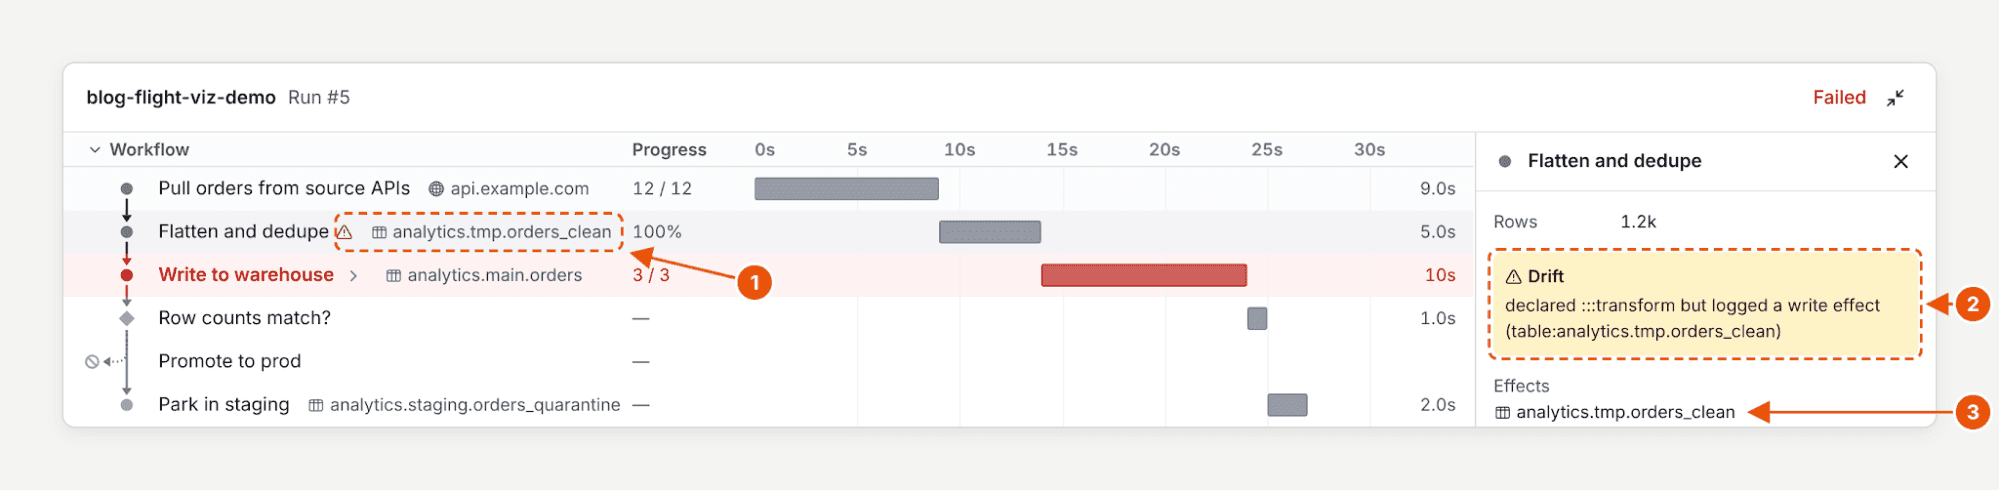
- The drift warning on the step that misbehaved, next to the effect that gave it away.
- What was declared and what happened. The step was declared as a transform but logged a write.
- The same effect in the step's details.
Drift means the chart and the code disagree, so one of them is wrong. That's often the first sign that an agent built something other than what you asked for, such as a step that writes data it was never supposed to touch.
Get started
Ask your agent to instrument a flight and show you its next run. Once you’ve tried it, tell us what helped, what confused you and what you wish it showed!
Stay tuned: in part two, we'll look at how the instrumentation works: the chart your flight declares and the log lines it prints as it runs.
Table of contents