BLOG
Announcing Data Outpost - The conference for data people in a world being rebuilt by AINov 4-5 | San Francisco
In a fully agentic world (without humans), will we still need analytics at all? Here’s something that may be helpful: Water Town, or Gas Town for Data. A pure thought experiment.
A few months ago, Steve Yegge introduced “Gas Town,” a system that enables an engineer to scale the number of AI agents that they can manage by dividing up the work into different coordinating roles. On first reading, Gas Town sounds absurd, but it also strikes a chord. Yes, the personae names are silly. But what else, exactly, is wrong with it? It is hard to deny that there is a real need for people to be able to handle large groups of agents building things–it may be the only way we build in the post-Modern Data Stack world. And once you believe that such a framework is necessary, something like Gas Town becomes inevitable.
"WARNING DANGER CAUTION / GET THE F*** OUT / YOU WILL DIE" – Steve Yegge, talking about his AI Agent orchestrator, Gas Town
What is Gas Town for data? If we imagine we’re in a world where your data pipelines are vibe-coded, as are your analytics and dashboards, how do you make sense of it all? How do you keep it all running? Agents, of course! To refurbish one of my favorite technology quotes, agents are like violence; the only solution to the problems they cause is to use more of them.
Yegge’s Gastown post walks through 8 levels of AI usage, starting at Stage 1, which is just using code completions, and ending with Stage 8, building your own orchestrator. It starts getting interesting around Stage 5, which is when people stop actually looking at the code that the AI is producing.
In order to figure out what the agent swarm looks like for data, I am proposing a similar progression. Whereas when you’re coding, you have only one role, the developer, in data, there are at least two distinct roles: analyst and data engineer. So, I have divided up the stages of agentic analytics by role.
Analytics is primarily concerned with getting answers. So AI’s impact here is that it can help make answers available more readily.
Stage 1: AI is helping you write your SQL. It can fix your syntax, look up the right functions to use, and provide feedback. But you’re primarily the one writing the queries.
Stage 2: One-shot Text-to-SQL in SQL editor. In other words, you feed a natural language prompt into an LLM, and it spits out a SQL query. This is a false stage, because it doesn’t really work very well. I’m including it here because at one point, everyone thought that this was going to be the next big step, but Stage 3, where you use an agent, is so much more effective.
Stage 3: Agentic Text-to-Results via an MCP server or Agent Skill. This is where you feed your natural language prompt to Claude or ChatGPT, and it runs a handful of queries to answer your question. This is dramatically more effective than Stage 2, because the Agent can figure things out about your data and doesn’t have to get it right the first time.
Stage 4: Agentic BI. An agent like Claude or Claude code is not only writing your queries, it is also building data visualizations. You don’t really need another tool like Tableau or Power BI because the visualizations that the LLM generates are as rich or richer than you could get before.
Stage 5: Agentic BI with Context. In order to make sure that your agentic BI is actually performing the right calculations and knows how to navigate your data, you provide a curated context layer. That context layer describes the metrics your organization uses, like how to compute Revenue, as well as a map of the schemas that are important.
Stage 6: Yolo BI. This just means you trust the outputs of your Agentic BI enough that you don’t even bother checking to see if the results are right. They might look wonky every once in a while, but you start using them for real decision-making without having to double-check.
Stage 7: Self-driving Context. The curation and management of the context layer is done automatically. If you tell Claude something about how a metric should be computed, that gets saved and used elsewhere by other people or other agents. If Claude figures out that one table has stale data, it saves that information so it doesn’t try to use it next time. This means that humans don’t have to write the context themselves; they just have to potentially approve what the agent has already figured out.
Stage 8: Automated Insights. Agents aren’t just capturing context about your business; they’re also trying to figure out what is interesting. Did the conversion rate drop overnight? The Agent will greet you in the morning with a custom dashboard showing the drop, as well as a couple of additional hypotheses about what might have been the root cause.
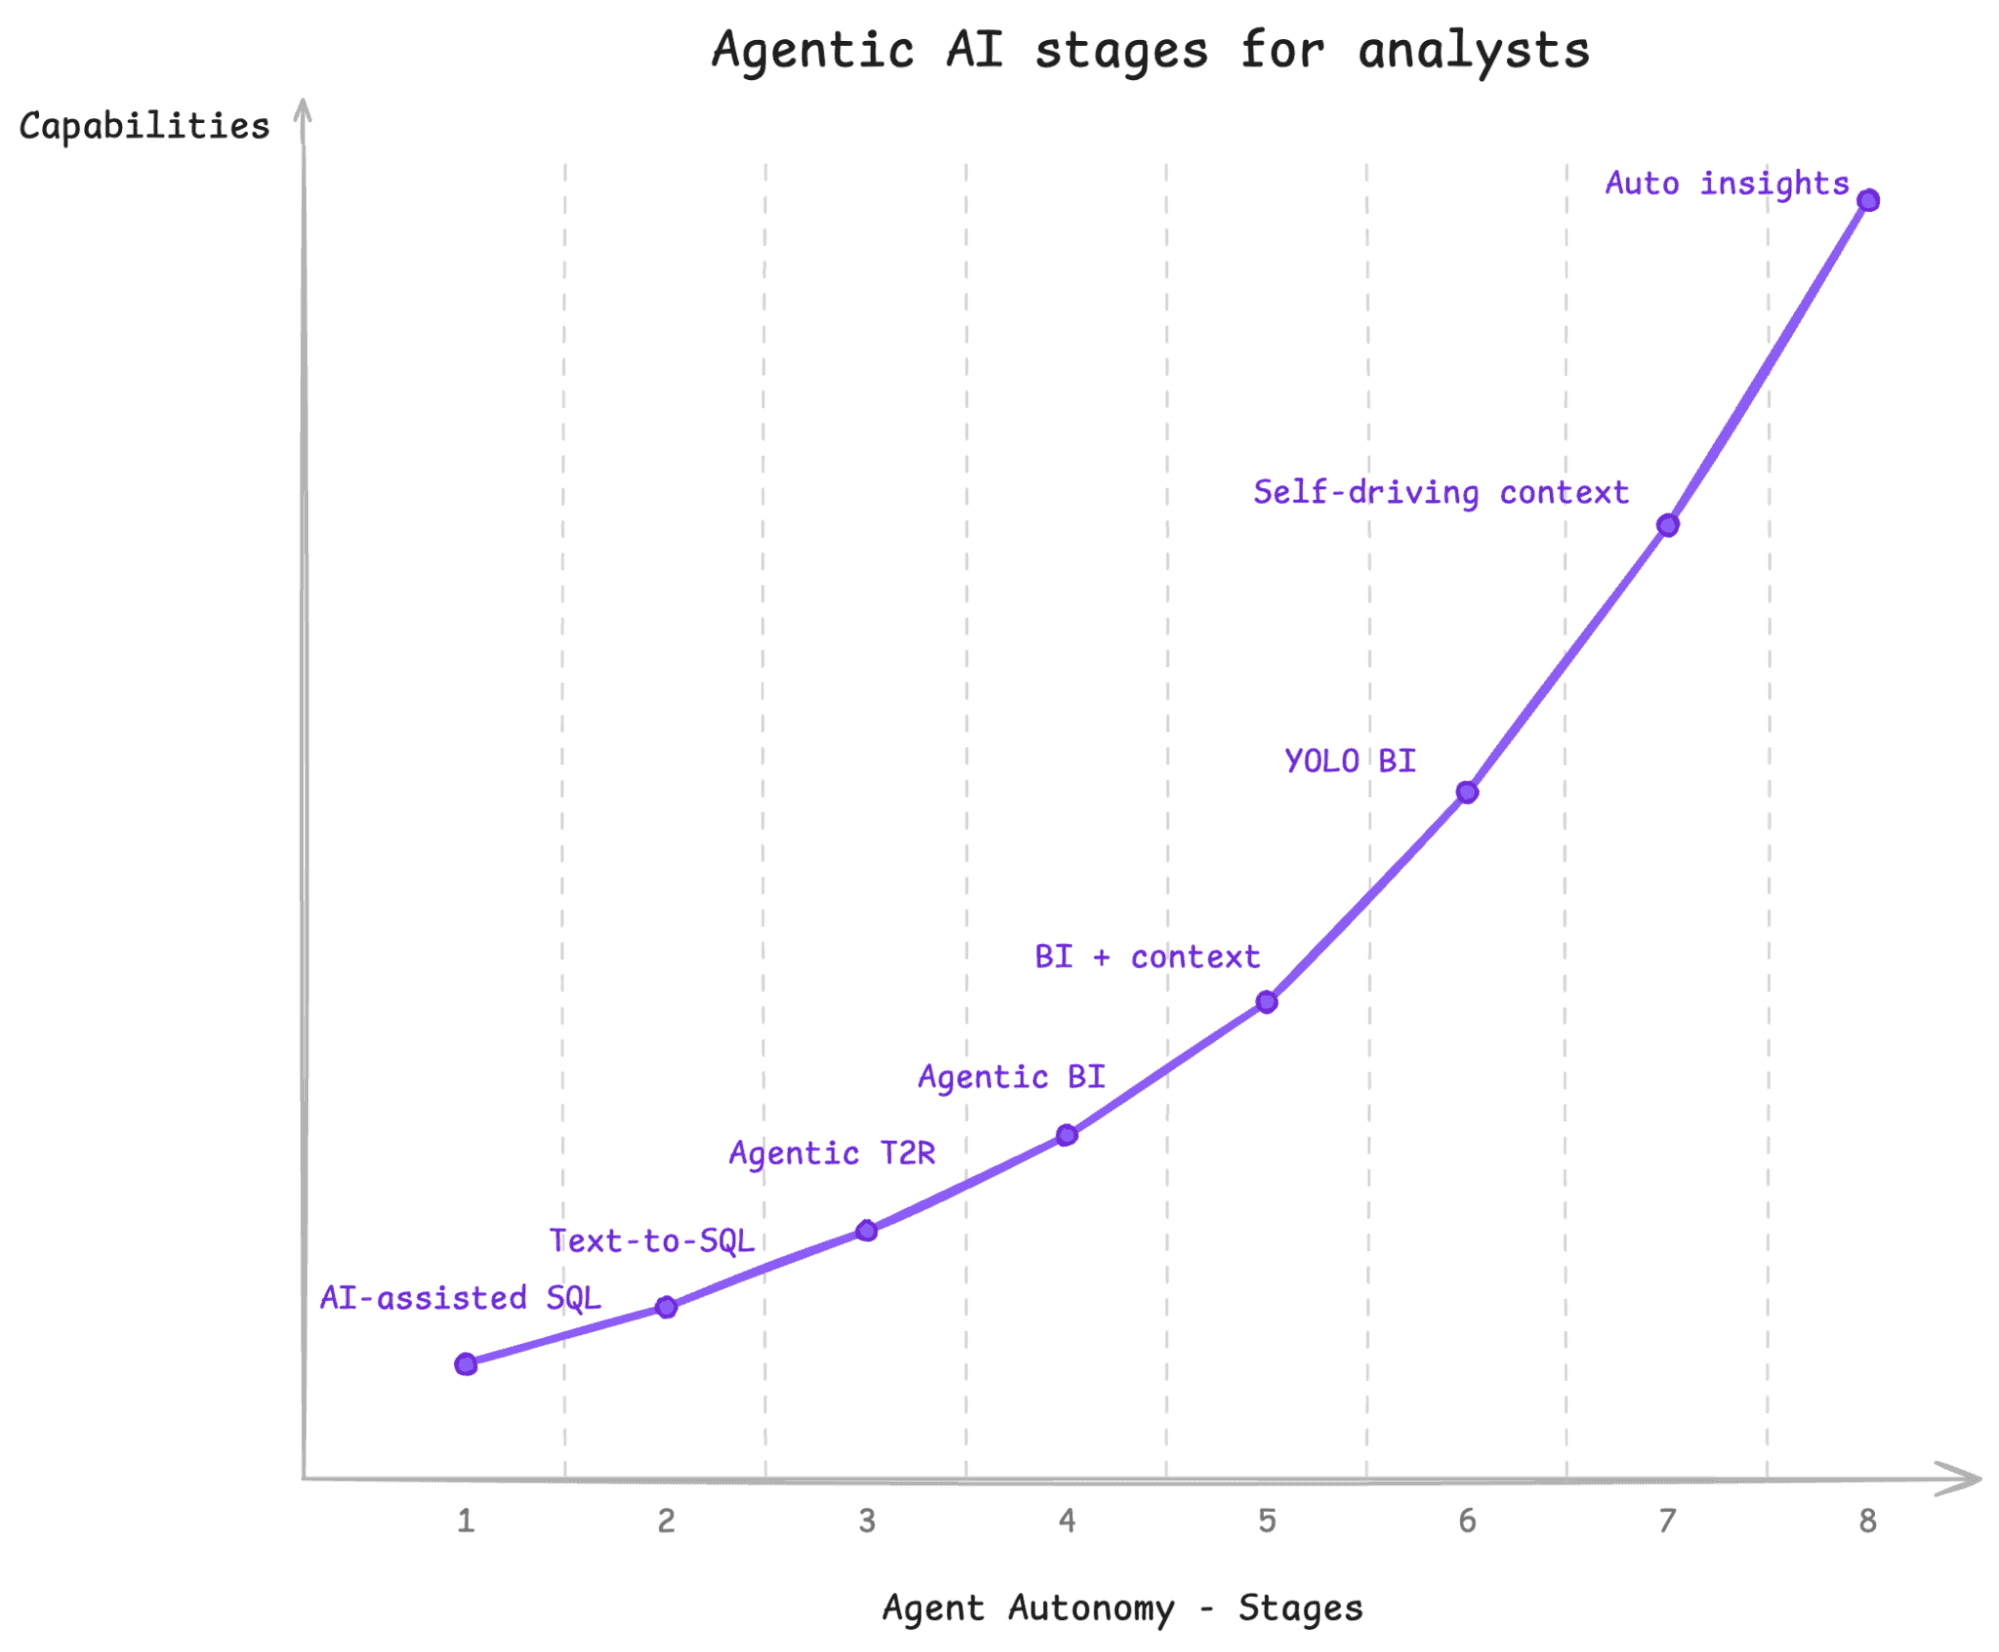
While all of this is possible now, I don’t know that I’ve seen anyone past stage 6 yet. But Stage 7 is coming; self-driving context is clearly desirable and within reach. If you make it to stage 8, you can just lean back and let your agents tell you what’s going on.
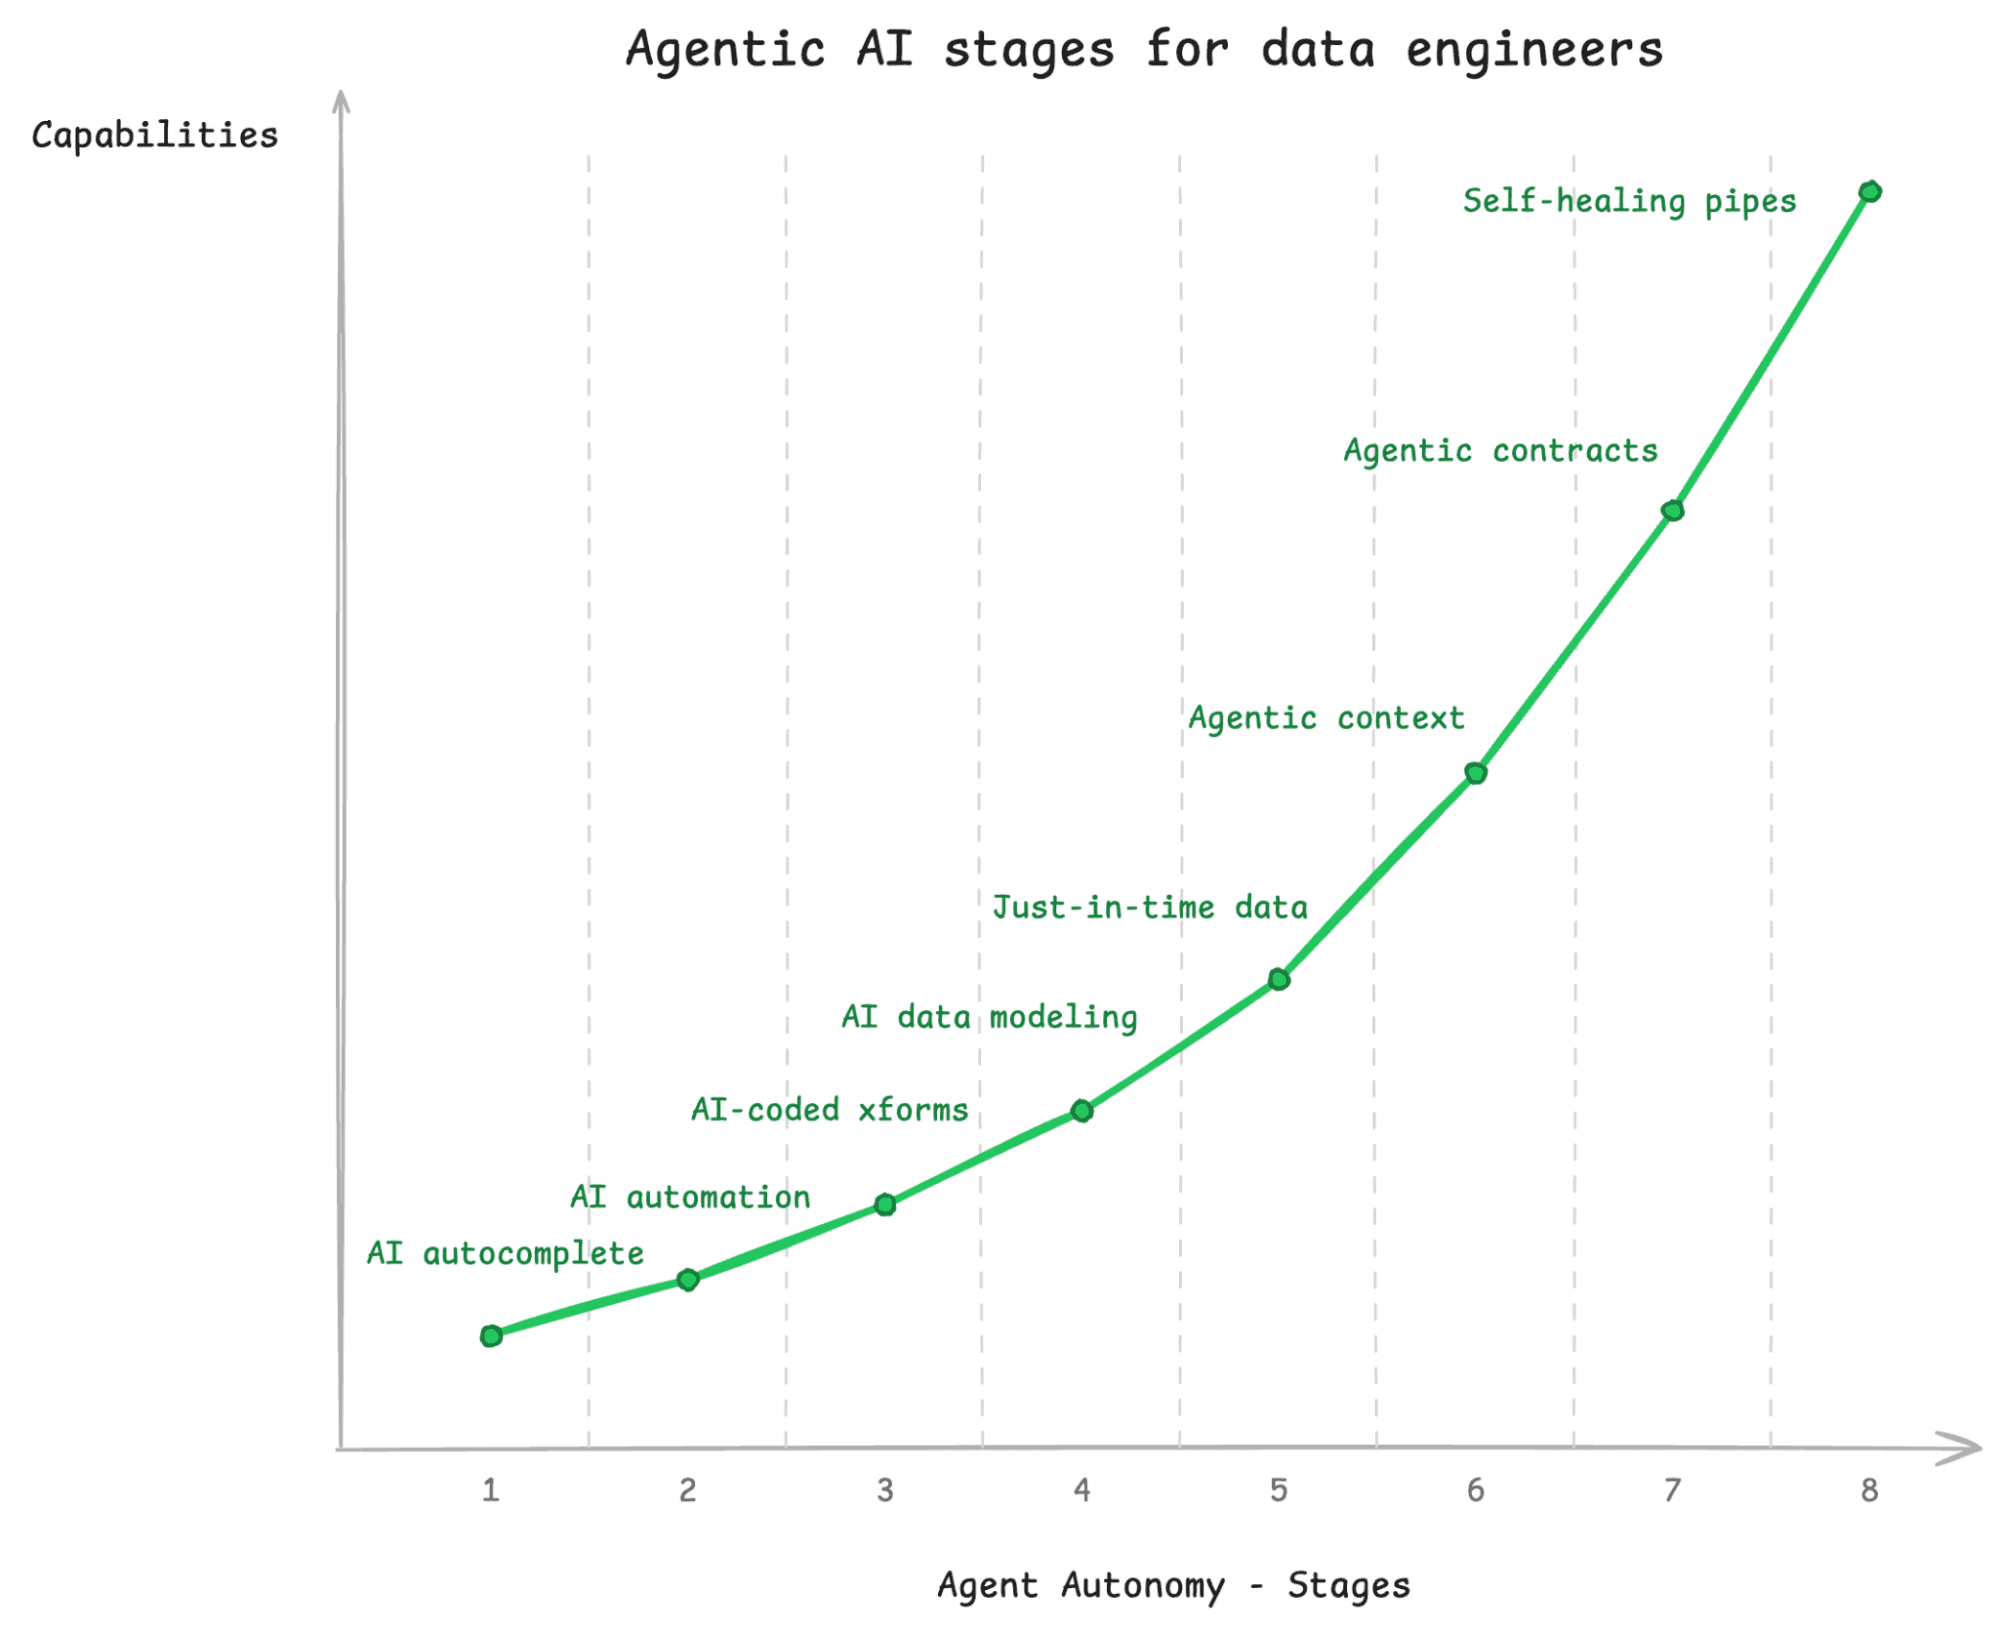
Data Engineering is about getting the right data in the right place at the right time in the right format.
Stage 1: Very little AI. This looks like Stage 1 for software engineering; an AI is doing auto-complete while a human is coding by hand. For data engineers, they’re building data pipelines or dbt models.
Stage 2: AI automation of existing tools. You’re using a coding agent to wire together existing tools and libraries, but it isn’t really creating things from scratch. At this point, it is mostly just automation.
Stage 3: AI-coded transformations. Moving beyond simple code suggestions toward agent-native data ingestion, AI is building end-to-end data engineering pipelines that keep your data up to date. But a human is still responsible for data modeling.
Stage 4: AI data modeling. Typically for analytics you want to transform your schema into something suitable for answering analytics questions. The better you are at modeling your data, the more straightforward and performant your queries are going to be. At this Stage, you can hand off that responsibility to AI; it can design a schema that will work well for the types of questions needed you’ll want to ask about the data.
Stage 5: Just-in-time data. This is where the analytics and data engineering roles start to merge; pipelines are created in response to an analyst asking a question about the data. Did they need a field that isn’t exported from their CRM tool? Claude will modify the necessary pipeline to add it or create a new one.
Stage 6: Agentic Context. This is similar to Stage 7 on the analyst side, but here, the context is gleaned at data creation time. As agents are loading and transforming data, they can infer lineage, keep track of data distributions, and propagate documentation from data sources.
Stage 7: Agentic data Contracts. Agents continually run evals to find when the “contract” of the data changes or breaks. The evals are human-or agent-created tests that check for norms like “this field should never be null”; “this table should join one-to-one with this other table”; these numbers should be within a certain range.” When the tests fail, the outcome is reported to a human who can intervene.
Stage 8: Self-healing pipelines. This builds on stage 7, but agents cannot only figure out when there is a problem, but also fix most problems on the fly. If the data type of a source changed, for example, the agent could either coerce it to the old type or modify the downstream schemas, queries, and dashboards as well.
One interesting thing to point out is that while data engineering and analytics start as completely separate, they start to blend. The context layer gets shared. An analyst can request additional data, which triggers data engineering workflows. Whereas these are typically completely separate in early 2026, the agentic systems of the future will likely bring these together into one coherent whole.
So what does the all-in-one agentic data system of the future look like?
Steve Yegge named his agents with a nod towards a “Mad Max”-themed wasteland. I’ve been reading the Patrick O’Brien Aubrey-Maturin historical fiction series (which starts with Master & Commander), and as I was envisioning agent duties, it seemed like they fit the roles on 18th century naval vessels reasonably well. In order to translate that into a post-apocalyptic scene, I’m basing my version on “Waterworld”, a critically panned but actually quite fun movie from the ’90s. And so instead of “Gas Town” we have “Water Town.” What better way to ride out the currents than in a great wooden boat?
Data engineering differs from software engineering in that maintenance of data pipelines is often significantly more complex than creation. Software projects don’t usually just break by themselves, but data pipelines break all the time when data distributions change, fields are added or removed from sources, or other invariants are violated. Data sources change, and those changes have ripple effects throughout pipelines all the way to dashboards. The pipelines themselves may have been relatively straightforward, but fixing them when they break can be subtle. Whereas Gas Town is designed to help you build, a “Water Town” is designed to manage change.
Water Town is what happens when you progress to Level 8 on both the Analyst and Data Engineering side of things; all of a sudden you have a ton of agents you need to keep track of. Like in Gas Town, we are going to divide up the agents into different roles.
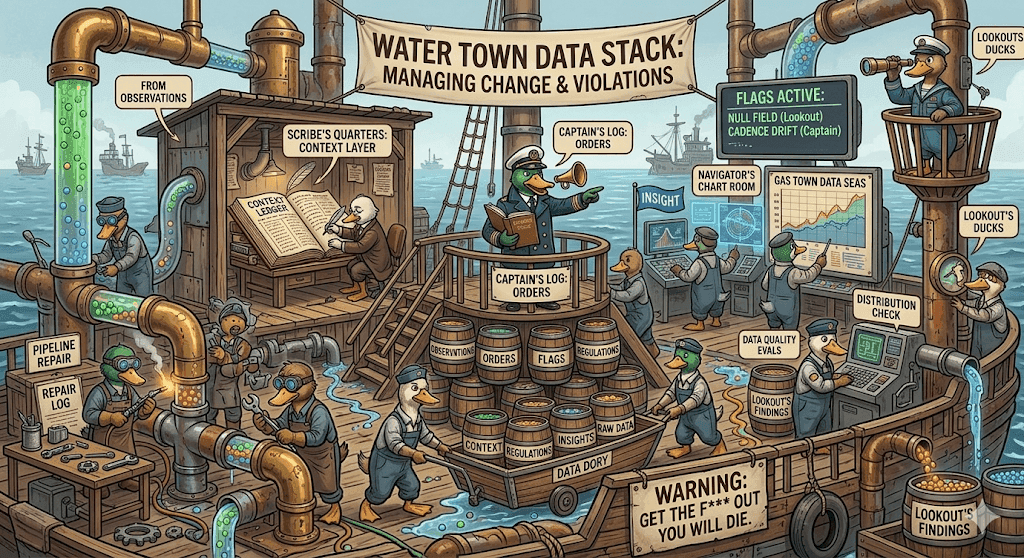
Before we get into the roles, however, there are a couple of key mechanisms that will be useful to understand. These are ways that different agents of Water Town communicate with each other.
Observations: Every ship has a logbook that contains Observations about what is going on and things that have been seen or done. We call these Observations because “logging” in software is so overloaded, and we want to refer to something a little bit more specific.
Every agent instance generates Observations describing what it did or what it learned. Observations are a kind of audit log that can be used to reconstruct everything that is happening. This includes running of evals, successful or not, or that a change was made.
Orders: Orders are commands that an agent issues to make other agents do something. Typically, only the Captain can issue orders. Moreover, all agents that are running should have Orders that describe what they are supposed to do. This helps ensure a clear chain of command.
The virtue of this system is that all changes to the system should be traceable to an Order that specified what was to happen, and Orders should be written as a result of Observations. Observations and Orders are used to build feedback loop mechanisms.
Flags: Flags are feedback to humans that human input is needed in the system. In general, the system attempts to be self-healing, but sometimes there are problems that can’t be addressed without human feedback.
Regulations: Every ship also has its Regulations; these are things that are not supposed to be violated. The Regulations are the data contracts; things are expected to be true of the data.
Regulations are used to generate evals, or tests, to ensure that the data is staying within certain expected limits and that pipelines are generally functioning.
We divide up the labor of building and running a full data analytics system into five roles: Lookouts, Carpenters, Captains, Scribes, and Navigators. The different roles coordinate based entirely on Observations, Flags, and Orders.
Lookouts: These are the data quality agents. They continually run evals that are looking for constraints being violated or even just significant changes in data distribution. Did a field suddenly start returning null? Did a timestamp that is supposed to always increase go back in time? Did a field that was supposed to be unique end up with duplicate values?
Lookouts may or may not be AI-driven; sometimes they’ll just be running a static set of tests, sometimes they’ll be using an AI model to detect things that look fishy. Sometimes they’ll just be looking for errors. They can be rules-based or test runners.
Lookouts typically write Observations about what they find, so the Observations can be picked up by other agents. They don’t typically execute any judgment on whether something is allowable; they rely on other agents to raise a flag if necessary.
Carpenter: The Carpenter agents can build and repair pipelines. They take an Order describing the scope of the change that needs to happen. It might be that a new data source needs to be ingested, it might be that the pipeline needs to run on a different cadence, it might be that a certain field has changed type, and so the system needs to be redesigned to accommodate.
When a Carpenter finishes its task, it will log an Observation, which contains information about what it actually did. The Carpenter may not have permissions to directly modify production, in which case it would raise a Flag for human inspection in order to make the change.
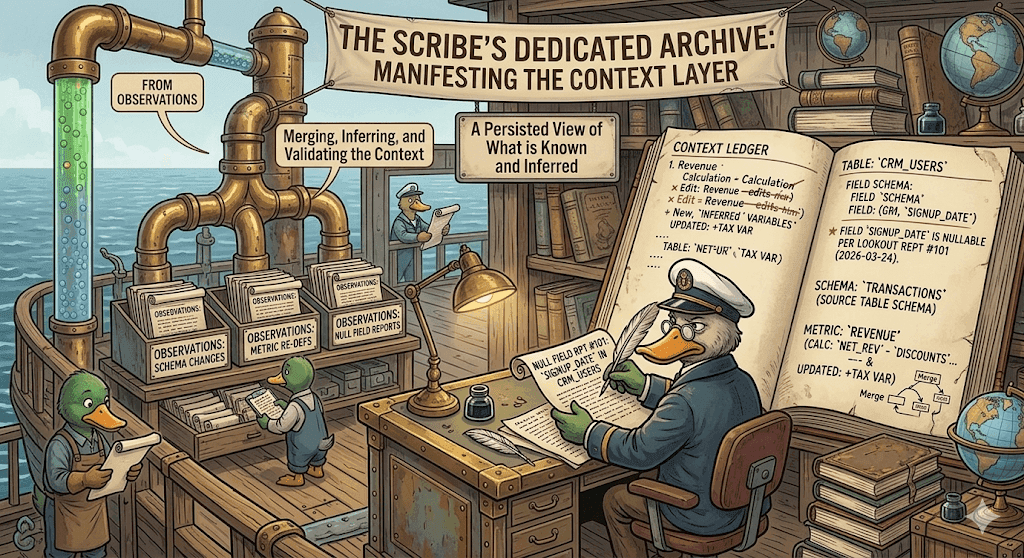
Scribe: The Scribe is responsible for maintaining the context layer based on Observations from other agents. For example, if a Lookout has reported that a field started returning nulls, the Scribe will update the Context for that field to indicate that it is nullable. The goal of the scribe is to infer what is inferable, to merge context when needed, and to make sure the Context always represents the best version of what is known about the data and the metrics that are being used.
Captain: The Captain is the one who can schedule work; there is only one captain. They take as input the Observations and can decide that something needs to be done about it. They can issue Orders for other agents to do work. For example, if a change should be made, they will have Carpenters pick the task up. Or maybe more tests need to be run, and they’ll ask the Lookouts to look into it.
Captains also decide whether violations of Regulations (i.e .the evals that Lookouts run) can be fixed, in which case they would order a Carpenter to take a look, or need to be reported to a human operator, in which case they’d raise a Flag.
All decisions that change production are made by the Captain. Note that for some changes, they might make the decision on their own, or they might raise a Flag for a human to take a look. There would be some guidelines around this, and at the start, perhaps all changes to production would be approved by a human. But over time, the Captain should be able to operate more and more autonomously.
Navigator: The Navigator is a special role that reviews Observations to generate insights. This is the role that would figure out if there is interesting new information that can be built into a visualization. These visualizations are raised as Flags that can be passed to a human runner of the system.
If you think this seems foolish, I encourage you to walk through what adding agents to your data workflows would look like. As you add more and more, with specialized roles and responsibilities, you may not want to name them after British Navy roles, but there is a good chance the duties are going to be pretty similar.
So back to the premise: in a fully agentic world (without humans), will we still need analytics at all? After all, isn't analytics as a whole just a way to make data digestible by humans? After you have agents providing your insights, what’s next? Agents making their own decisions? How far can you push the model? We’ll have to see where the winds take us.
This is part three in my series of posts about the future of data. You can find part 1 here and part 2 here.